Asymco

Asymmetric Intelligence

share

  1. Why I think Apple wants everybody to have an iPhone

    Research · 15 comments

    In recent entries I asked: Can the iPhone reach 10% of the world’s 3G subscribers? and  Can iPhone reach 20% of global smartphone market?

    These were rhetorical questions designed to demonstrate that a growth rate of 50% (compounded) over three years was clearly possible through reduction to absurdity of alternative scenarios.

    The question of iPhone as iPod vs. iPhone as Mac businesses is at the crux of any investment in Apple today and the key strategic question facing Apple and all its competitors.  Anyone holding or considering buying AAPL shares should answer this question for themselves.

    To the top-down market share scenarios above I add the following, more direct, signals Apple has made regarding their iPhone-for-all strategy:

    1. The fact that they entered the market at all.  When they were building iPods, Apple came to understand that to be a device company means to be a phone company.  The device business is much more sensitive to volume (i.e. economies of scale) than the PC business. Nokia proves this point every day.  You can’t be in the device business with low volumes and stay profitable for long. This is because you can't get component pricing low enough to sustain margins that can afford you R&D sufficient to differentiate your product.  Therefore you cannot stay in the phone business with low volumes (see Palm).
    2. Apple repeatedly signaled that they will not permit a pricing umbrella for their products.  Although the product seems priced highly now it’s only because that’s what the market can bear and because of the possibility of taking a cut from service revenues.  The iPhone is not as expensive as it might seem relative to other smartphones, it just has a huge gross margin (50% at least).  Apple can keep their costs low through volume but they can also tweak pricing down if they need to.
    3. The platform approach.  Apple is putting in an enormous effort to orchestrating a mobile platform.  This is the most obvious signal.  Platforms are expensive to build. If the cost to build a mobile phone is x, the cost to build a mobile platform is 10x.  Platforms are expensive to maintain but generate enormous rents if volumes are built and users are retained.  The platform’s value grows as the n*log(n) of the number of users (Metcalfe’s law).
  2. Can iPhone reach 20% of global smartphone market?

    Research · 3 comments

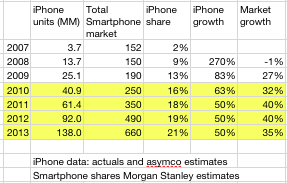
    On a yearly basis, iPhone has been growing at 270% in 2008,83% in 2009 and 130% so far this year.  The growth has been faster than the growth of the smartphone market during the same time.  As a result, the market share of the iPhone has increased from 2% in 2007 to 13% in 2009.

    The question now is: What is the required growth rate for iPhone to maintain growth in share as the overall market grows?

    Taking market estimates from Morgan Stanley, I tried to fit an iPhone growth rate which would result in a 20% share for Apple by 2013. This rate turns out to be a conservative 50%/yr.  Any growth beyond 50% would result in well over 20% share for the iPhone.

  3. The iPhone at three

    Research · 4 comments

    The end of June will mark the third anniversary of the market release of the iPhone. When it arrived in June 2007, anticipation for the product was significant with high consumer awareness and expectations--though the 10 million/yr. target for 2008 was met with skepticism by many.

    The iPhone launched on June 29th 2007, with only a few days remaining in the quarter. 270k units were sold in that quarter and that was considered a solid start. When the company reported earnings a few weeks later (July 18th 2007) the company's stock price jumped to $140 a share.

    As a sign of optimism in the company's prospects, the P/E ratio showed that the company was expected to reach 35% growth (35 P/E).

    Was this optimism warranted?

    A huge world-wide recession started only six months after the iPhone launched and, by some accounts, it is still lingering today. That meant the company faced decreasing consumer spending and constrained markets world-wide. The recession was expected to challenge Apple's premium positioning across all its product lines. The optimism from 2007 seemed exuberant. Where do we stand today?

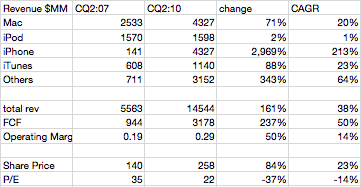
    This table shows the actual values of the iPhone's 2007 launch quarter vs. the estimated values for Apple's income statement exactly three years later.

    Free cash flow grew 237% or at a compounded 50%, significantly above the 35% that the P/E of 2007 would have suggested. The exuberance of 2007 turned out to be pessimism.

    Although we don't know what the share price will be come July, as of today the share price has grown at less than half the rate of FCF growth: 84% or 23% compounded. As a result the P/E dropped from 35 to 22.

    It's remarkable that growth expectations today are lower than they were at iPhone's birth even though the company outperformed those expectations through an unforeseen economic crisis.

  4. iPhone takes share from RIM, Android takes share from Windows Mobile

    Research

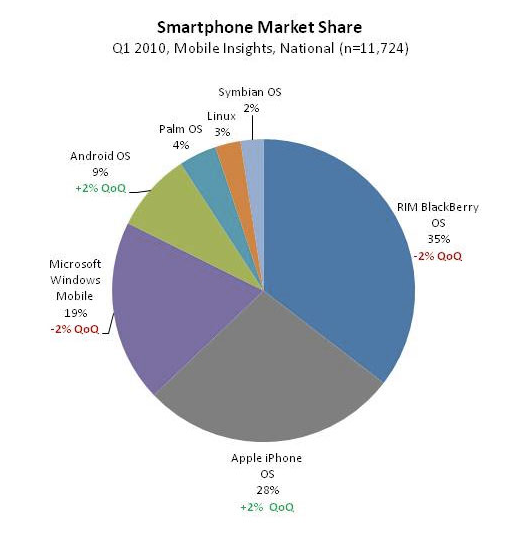
    Data tracking firm Nielsen Co.’s quarterly survey found that, in the U.S. the iPhone added two percentage points for a 28% market share in the three months ended in late March compared to the previous quarter. RIM still had the biggest market share at 35% but it lost two percentage points in that period.

    Phones that run on Google Inc.’s Android operating system also gained two percentage points for a market share of 9% over the same period, while Microsoft Corp.’s Windows Mobile phones lost two percentage points for a 19% share.

    via Appetite for IPhone Continues Undiminished - Digits - WSJ.

    Although Android is often considered in competition with the iPhone, as we've shown in the past, the two are seldom competing for the same purchase decision.  From a distribution and business model point of view, the platforms are mostly non-overlapping.

    The installed base data above shows that in their respective areas of competition: in the US, with the current operator channel, the iPhone is taking share from a similarly positioned platform (RIM) while Android is taking share from a similarly licensed alternative (Windows Mobile).

  5. Wall St. discounts Apple's growth potential

    Research · 2 comments

    Apple, with its $50 a share in cash, could earn as much as $17 to $20 a share in 2011, which means the stock is trading at a cheap 12.5 times next year’s earnings. Cramer said even if Apple hits his $300 target, the stock will still be cheap trading at just 15 times earnings.

    “That’s less than almost every single growth stock I follow,” Cramer said, “and even less than the S&P 500’s multiple.”

    via Jim Cramer Predicts Apple Inc. (NASDAQ:AAPL) will hit $300 a Share | Madd Money.

    S&P forecasts the S&P 500 average P/E for 6/30/2010 at 22.57.

    Readers of this blog may recall that I noticed Apple's discounted valuation several times.

  6. IDC: I Dream of Claim Chowder

    Research · 3 comments

    A few eyebrows were raised when Microsoft presented a slide at a French event where they made the claim that 30 Million Windows Phone devices would be sold by the end of 2011.  Given that the first Windows Phone won't ship until October 2010 at the earliest, or, according to Mr. Ballmer, "by Christmas," count me among the skeptics.

    However, the claim was later retracted by Microsoft stating that they mis-quoted IDC, the original source for the forecast.  The correction was perhaps meant to put an end to the credibility crisis.

    However, the actual forecast from IDC was even more preposterous. Apparently IDC makes the forecast that 32 million "Windows Mobile" devices will sell during all of 2011--a combination of both Windows Mobile and Windows Phone devices.

    Instead, the research company forecast 2011 sales of 32 million devices running all Windows Mobile operating systems. This includes expected sales of devices with Windows Mobile 6.5, which is already on the market. IDC has not given any sales estimate for Windows Phone 7, which Microsoft has said will be available in the fourth quarter.

    Their report showed about 16 million Windows Mobile devices shipped in 2009, with a forecast of 22 million this year and 32 million next year.

    Windows Mobile shipped a total of 3.7 million phones in 1Q10, so in order to reach 22 million this year they need to ship 18.3 million for the rest of the year or, on average, 6.1 million phones a quarter.  That's a higher number than what Android shipped in Q1 with BOGO promotions (5.2m units). That's almost as high as the launch quarter for the iPhone 3G.  And all this (mostly) with WinMo 6.5!

    Alternatively perhaps IDC foresees a huge launch for Windows Phone. Assuming an erosion of the WM6.5 to 2.7 m this quarter, 2 million in Q3 and 2 million in Q4, then Windows Phone would somehow need to ship 12 million units during the last quarter.  This number is higher than what iPhone sold in its highest ever quarter.

    This sounds sillier than 30 million Windows Phones in 2011.  By claiming that Microsoft's combination of deprecated Windows Mobile (6.5) and unreleased Windows Phone 7 will continue to sell at a growth of 38% this year, they are actually suggesting an acceleration in sales going into the second half at a rate higher than what the market is likely to grow at.

    In other words, they are suggesting that Microsoft will gain share during the rest of this year. Share gains for a platform that has declined in share in Q1 from 10.2% to 6.8% with 3.7 million units sold on the back of further share losses the quarter prior. Share gains against Android that competes with a free license. Share gains with a new platform that has no clear differentiation vs. the iPhone.

  7. At 135 devices, the Android army marches on but what happened to the Windows Mobile legions?

    Research · 2 comments

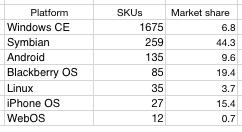
    The number of Android devices is rising steadily; it's already up to 135.  Android devotees should rightly rejoice.  However, Android is not the first mobile platform with an open licensing strategy. A quick visit to pdadb.net lets us count the number of devices that shipped for every mobile platform in history.  We can also see the current market shares as listed by Gartner for these platforms.

    The numbers of SKUs (stock keeping units) that have shipped historically vs. the market shares of the mobile phones running those platforms are (see Footnote below for some caveats):

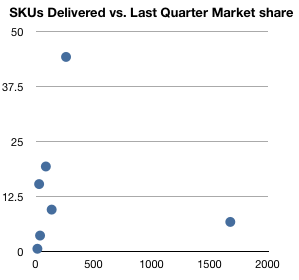
    The same data in a scatter plot:

    (SKUs on the x-axis and share on the y-axis)

    The thing that jumps out is how uncorrelated the two quantities are.  The Windows Mobile/CE number is such an outlier that it breaks any attempt to link the two variables.

    What's likely to happen is that since the licensing of Android is even less problematic than it was for WinCE (i.e. it's both free as in beer and free as in speech) the number of Android SKUs is likely to overtake WinCE.  In other words, we're very likely to see Android grow from hundreds to thousands SKUs.

    However, the real question for the Android platform isn't whether it will have licensees. WinCE proved that there is vast demand from many companies to build cloned and undifferentiated devices. The real challenge is whether Android can achieve significant volumes without fragmentation to keep the platform/network effect going.

    The WinCE platform was actually less fragmented through its life than Android is today. This is understandable since the source code was decidedly not open and thus not modifiable and new versions were released far less frequently. And even with a high price tag, it was wildly popular with licensees. Nevertheless, the volumes never came and Microsoft was forced to abandoned the whole strategy.  The next version of Windows Mobile (Windows Phone 7) will follow an "iPhone lite" model of highly restricted configurations and device and ecosystem specification.

    So will Android follow the fate of Windows Mobile with an even more fragmented, bazaar-like licensing model? Or will thousands of undifferentiated Android devices swamp their integrated competitors?

    Footnote: The total SKU number includes non-cellular devices whereas the market share number includes only cellular devices. Omitting non-cellular devices will not detract from the pattern or change the correlation meaningfully.  The argument can also be made that the "platform" value lies in both cellular and non-cellular devices (e.g. iPad) and they should both be counted.  Unfortunately there are no market share statistics that blend both device types into one market.

  8. Does iPhone really have 72% of Japanese smartphone market?

    Research

    MM Research does not count Symbian as a smartphone platform. This makes them inconsistent with any other analyst for counting smartphones.  So shouldn't Symbian be included?

    In a comment to iPhone has 72% of Japanese smartphone market | Asymco it's been pointed out that 12 million Symbian sold in the same time frame as Apple sold 1.7 million phones in Japan.

    It would seem then that the correct market share for iPhone would be 12%, with Symbian having 83% and "others" having less than 5%.

    However...

    Symbian in Japan is not the same thing as Symbian elsewhere.  Symbian in Japan is used as a low level OS by Fujitsu, Sony Ericsson Japan, Mitsubishi, Sharp and others to provide devices running the MOAP(Symbian) software platform.  MOAP (Mobile Oriented Applications Platform) is the software platform for NTT DoCoMo's FOMA (Freedom of Mobile Multimedia Access) service.

    Unlike Series 60 and UIQ MOAP(Symbian) is not a open development platform.

    MOAP is also supported by Linux with Panasonic and NEC using it in something called MOAP(Linux).

    MOAP(Linux) is also not an open development platform.

    So the "72% share for iPhone" in Japan must be stated with this important caveat: that Symbian and Linux are not included because, due to not having exposed APIs, they are classified as feature phone platforms.

  9. Global smart phone OS shares (part II)

    Research

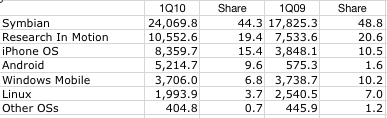
    On May 5th, I tried to fill in the blanks on Global smart phone OS shares | Asymco. I estimated that the shares for the mobile OS's were as follows (based on Canalys partial data):

    • Symbian (Nokia): 42%
    • Blackberry OS (RIM): 19%
    • iPhone OS (Apple): 16%
    • WinMo (Microsoft): 10%
    • Android (Google): 10%
    • WebOS (Palm): 2%

    Now Gartner has published their sell-through estimates:

    • Symbian (Nokia):: 44%
    • Blackberry OS (RIM): 19%
    • iPhone OS (Apple): 15%
    • Android (Google): 10%
    • WinMo (Microsoft): 7%
    • Linux: 4%
    • Other OSs: 1%

    My estimates were within 1 or 2 percent of actuals except for Windows Mobile where I over-estimated by 300 basis points.

    The analysis of Android vs. iPhone market shares (globally and within the US) which depended on this estimation does not change materially.

    The complete data from Gartner follows:

  10. Apple's Valuation Struggle

    Research

    I don't know how many times I can re-write this story but here goes another try.

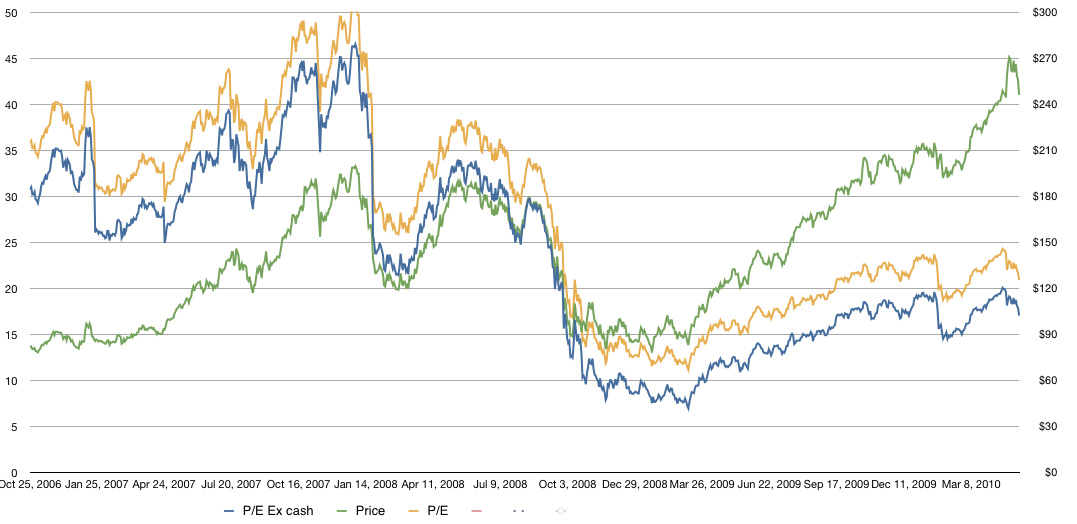
    In the graph below I show Apple's historic share price overlaid Apple's P/E (with and without cash).

    The share price is the line in green with the scale on the right and the P/E (trailing twelve months ex-cash) is shown in blue with the scale on the left.  The P/E including cash (which is what is usually cited) is shown in yellow.

    As the graph shows, while the stock has risen, the P/E has fallen.  This is due to earnings accelerating faster than the stock price. As valuation is usually correlated with growth, it stands to reason that Apple continues to be discounted as a growth stock.

  11. Visualizing iPhone vs Android Shares

    Research · 1 comment

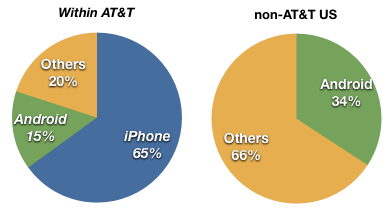
    Following up on my last post on how misleading US-only share comparisons can be, I decided to draw charts to visualize the comparison.

    As Android and iPhone compete in various ways, it's hard to see which is the preferred choice given a direct comparison.  In other words, iPhone and Android devices rarely are placed next to each other with similar terms.

    Take the US market for example.  The overall data from NPD suggests that last quarter Android reached 28% share vs. 21% for iPhone.  Many of those Android devices were new to market or at least newer than the iPhone which in Q1 was coming to the end of its product cycle.  Second, pricing for Android devices seems to have been quite aggressive with buy one get one free sales.  But I won't dwell on tactics now; what I do want to note are the differences in share between AT&T users and non-AT&T.

    Note that within AT&T, iPhone outsells Android over 4 to 1.  iPhone also outsells "others" (mainly RIM) more than 3 to 1.  However, outside AT&T, where the iPhone is not available, Android does not outsell "others".

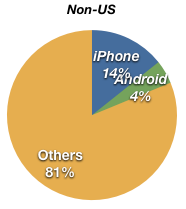
    If we exclude the US altogether, we also see that Android does not have a great distribution.

    Outside the US, the iPhone also outsells Android nearly 4 to 1, but it has a way to go before challenging Symbian which makes up the bulk of "Others".

    So in markets where Android is head-to-head with the iPhone (AT&T and non-US markets), iPhone's lead is quite high (still).  The possibility still exists that Android will overtake iPhone given the broad licensing and distribution, but it's not necessarily a given.  And in any case, iPhone is not the market share leader today and that leadership does not seem to be their objective (note the pricing).

    The bigger question is what will happen to RIM and Symbian as Android grows.