Cash flow is a fact, earnings are an opinion and share price is a dream.
A company's total worth is the number of outstanding shares multiplied by their value. This product is called the market capitalization or Market Cap.
That's a simplification. If you want to be more accurate, you should take the Market Cap and net out cash and debt--these are not part of the future flows of cash that can benefit shareholders.
More precisely, there is another measure called the Enterprise Value (EV) which is the total price tag of a company, representing what it would cost to buy the entire business and pay off its debts. EV = Market Cap + Total Debt + Preferred Stock + Minority Interest - Cash and Cash Equivalents.
This is the precise and complete measure of the firm's value but we use the shortcut of Market Cap since In most cases the Preferred stock and minority interest are negligible and if cash equals debt then the result is EV =~ Market Cap. it's easier to calculate anyways as the shares outstanding and share price are easily available. Not so for EV.
To get a sense of how much you're paying for the company it makes sense to divide the Market Cap by the company's Earnings so you get an idea of how many years it will take to get back your investment. When dividing both Market Cap and Earnings by the number of shares it becomes the famous P/E ratio or Price per share / Earnings per share.
But if you want to be fully precise, instead of using Market Cap you should use Enterprise Value. In that case the denominator should be Free Cash Flow or FCF[1]. The ratio becomes EV/FCF. Free Cash Flow is a better measure than earnings because it takes into consideration depreciation, change in working capital and capital expenditures. It measures the actual cash a company generates after paying for its operating and capital expenditures.
EV/FCF takes into consideration unusual situations such as huge amounts of cash or debt or capital expenditures which removes shareholder access to what the company "earns" on paper. This why the adage of "earnings are an opinion but cash flow is a fact" exists.
I used EV/FCF years ago to value Apple because at a time when it held huge amounts of cash. This was before it began aggressively reducing its cash through its capital return program. The P/E ratio at the time was very low but excluding the cash, it was even lower. It was a huge red flag indicating that the company was being priced for liquidation, or as some analyst put it, priced like a steel mill going out of business. If at that time you did not believe that its demise was imminent you would have surely been richly rewarded.
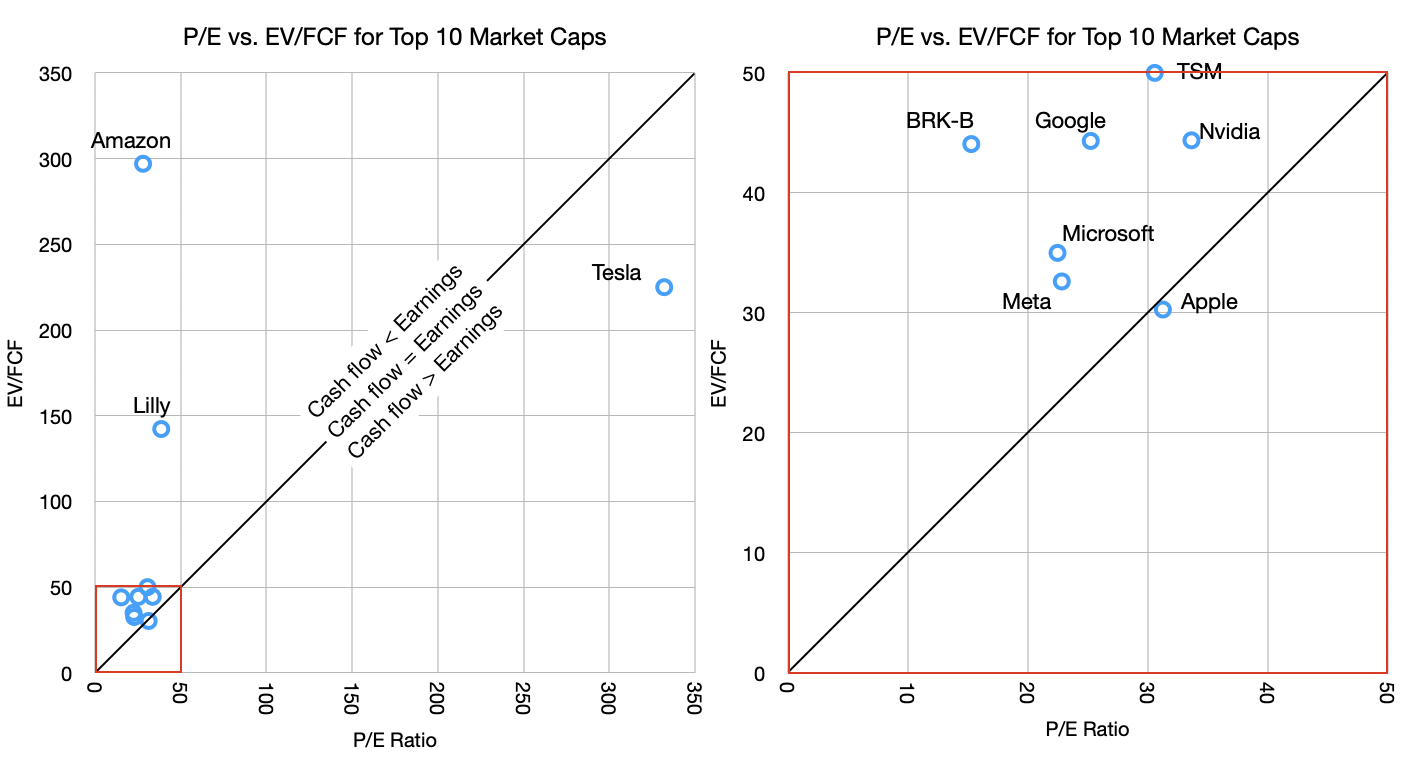
Today the anomaly that throws the P/E off is not Cash but CapEx. And it's not for Apple but for the other mega caps or AI "hyper scalers". Without worrying who is or isn't in the "Magnificent 7" I compiled the largest 10 market capitalization companies and looked at their P/E and EV/FCF ratios. At time of writing:
Company
Market Cap
P/E Ratio
EV/FCF
NVDA
$4,014,456,963,072
33.6
44.4
AAPL
$3,624,949,514,240
31.3
30.3
GOOG
$3,304,174,911,488
25.2
44.3
MSFT
$2,667,926,257,664
22.5
35.0
AMZN
$2,157,182,320,640
28.0
297.0
TSM
$1,641,528,688,640
30.6
50.0
TSLA
$1,333,163,982,848
332.0
225.0
META
$1,356,802,949,120
22.8
32.6
BRK-B
$1,023,780,323,328
15.3
44.1
LLY
$793,550,454,784
38.6
142.3
As recently as six months ago, there was a lot of talk about an AI bubble. Back then I looked at the data then and by looking at the P/E ratios convinced myself that the valuations were not "bubble" level. They were in the mid-thirties. These were not historical high especially when considering the growth these companies were experiencing (over 30%). Since then prices have come down significantly.
This is as the CapEx elephant in the room has been making itself known and there is renewed alarm at the scale of capital spending. This is reflected in the EV/FCF number but not in the P/E number.
The table above shows how much more elevated the EV/FCF ratio is relative to P/E for many of the companies. This "truer" measure of what you are paying as a share buyer is now reflecting in reduced share price and hence reduced P/E.
Of course, this is not true for Apple. Apple's P/E ratio and EV/FCF are nearly identical. To see this more clearly I put together these graphs.
The graph shows the P/E vs. EV/FCF for the companies in the table. The graphs are the same data but the one on the right is zoomed in on the lower left corner (note the red squares).
The reason for the zoom is that there are three outliers. Tesla, Amazon and Lilly. Tesla has absurd valuation on both P/E (300 to 400 range in last 6 months) and EV/FCF while Amazon has an outrageous EV/FCF value due to abnormal capital spending. Basically, Tesla has negligible earnings (and negative growth) while holding astronomical share price and Amazon is spending far above its median on CapEx. Amazon's 10-year EV/FCF is much lower, at approximately 55.
But let's ignore the outliers and concentrate on the other seven in the cluster. These are below 50 P/E and 50 EV/FCF thresholds.
Note that I drew a diagonal line representing the equation of P/E = EV/FCF. This should, under normal circumstances, hold for most stocks. Just like Market Cap should roughly equal Enterprise Value so Earnings should equal Free Cash Flow.
Most companies should not stray too far from this line. But what we are seeing, with the notable exception of Apple, is that most tech companies have cash flow far below earnings. This is again due to the CapEx elephant.
The argument goes that this is a temporary situation with that capital being wisely deployed for returns from AI. Presumably, these companies will swing to the other side of the line, where cash flows will exceed earnings, compensating for the capex that was denied to the shareholders.
This is where the old adage comes into play: Earnings are an opinion but cash flow is a fact. I added to that "and share price is a dream". Take the free cash flow and multiply it by a "dream" and you get the price the market sets. This dream is the multiple.
What makes the AI "bubble" interesting is how it's not fueled by debt[2] but by cash flow. Companies are turning over large portions (almost all and sometimes more) of their cash flows to investing in the dream of AI profits. All but one, of course.
There is something obviously contrarian in Apple's strategy. Perhaps it's not Apple that is odd but rather there is groupthink on behalf of the others. The question of who's right will rest on whether it turns out that AI is going to commoditize quickly or perhaps never, whether AI turns out to be modular or integrated, whether AI exhibits disruptive or sustaining competitive responses, whether it's an infrastructure subject to regulatory corrosion or whether it will migrate to the edge and iterate freely, whether it's a new experience or simply better existing experiences, whether it creates new markets or just makes existing ones more efficient.
These are not new questions. They have been applied to all software and hardware innovations of the last 40 years. We have a lot of history to inform us.
Ben Thompson of the Stratechery interviews Horace on the Stratechery Plus Podcast to discuss Horace's journey to become an influential tech analyst: early career in research, business school under Clayton Christensen, and his time at Nokia during the rise of the iPhone.
The conversation further explores Disruption Theory in the context of both smartphones and AI, why Christensen misjudged Apple, and whether AI could challenge today’s tech giants. It also marks the launch of Dediu’s new paid service Asymco One and reflects his continued conviction in Apple Inc. at its 50-year milestone.
Apple's performance in China is often noted and scrutinized. During the last quarterly earnings call Amit Daryanani asked:
... the other second question I have for you is maybe just touch on the China strength you folks had. I think this is very close to all-time high revenues you have had in China. What is driving the strength over here?
To which Tim Cook gave the following answer:
Greater China was up 38% year on year. It was driven by iPhone, where we set an all-time revenue record. So it was the best iPhone quarter in history in Greater China. It is driven by the customer enthusiasm for the iPhone 17 lineup. And I would tell you that during the quarter, traffic in our stores in China grew by strong double digits year over year. It was a terrific quarter. Our installed base reached an all-time high in both Greater China and Mainland China. And we set an all-time record for the upgraders, and we saw strong double-digit growth on switchers.
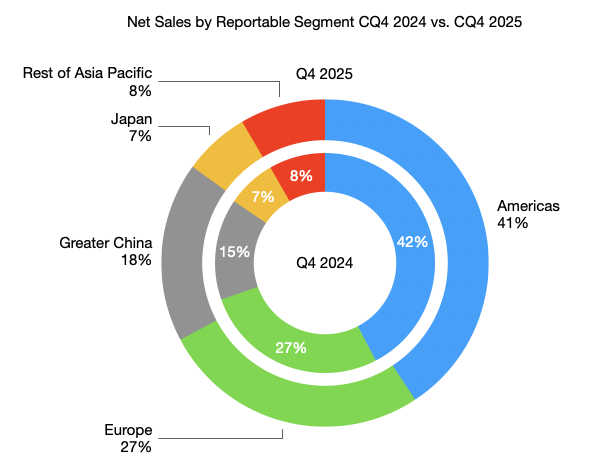
That's remarkable growth and every quarter we get this sort of discussion. But I don't recall ever there being a similar discussion about Europe. This is strange because, and the following graph shows, Europe is a bigger market for Apple than China.
Europe also grew, and at 12.7%, grew faster than the Americas and faster than Japan.
Regional Sales CQ4
2025
2024
Growth
Americas
58,529
52,648
11.2%
Europe
38,146
33,861
12.7%
Greater China
25,526
18,513
37.9%
Japan
9,413
8,987
4.7%
Rest of Asia Pacific
12,142
10,291
18.0%
So why is Europe not discussed. Management does offer some mentions:
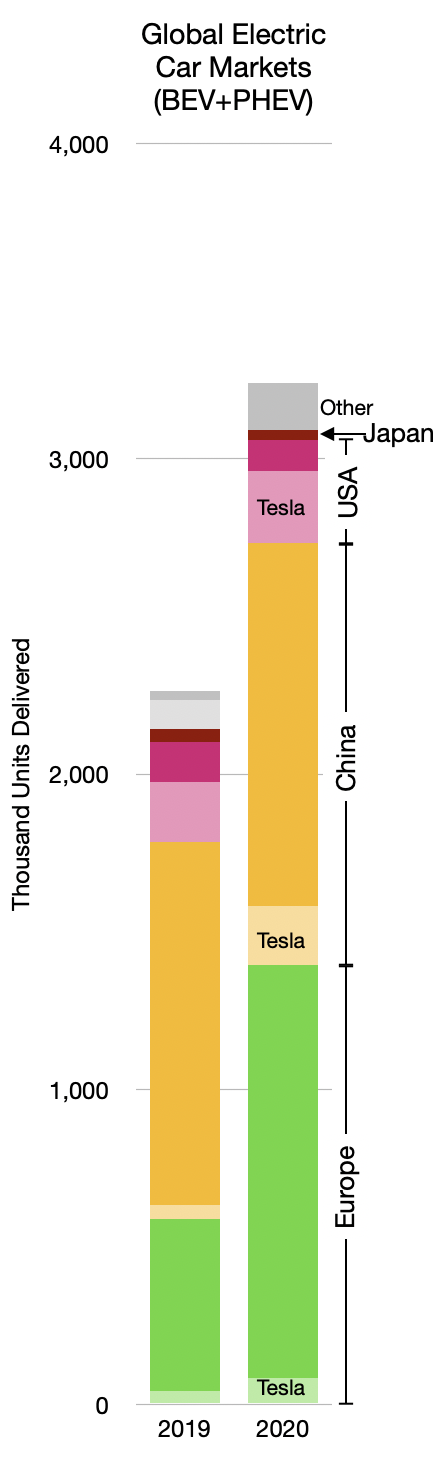
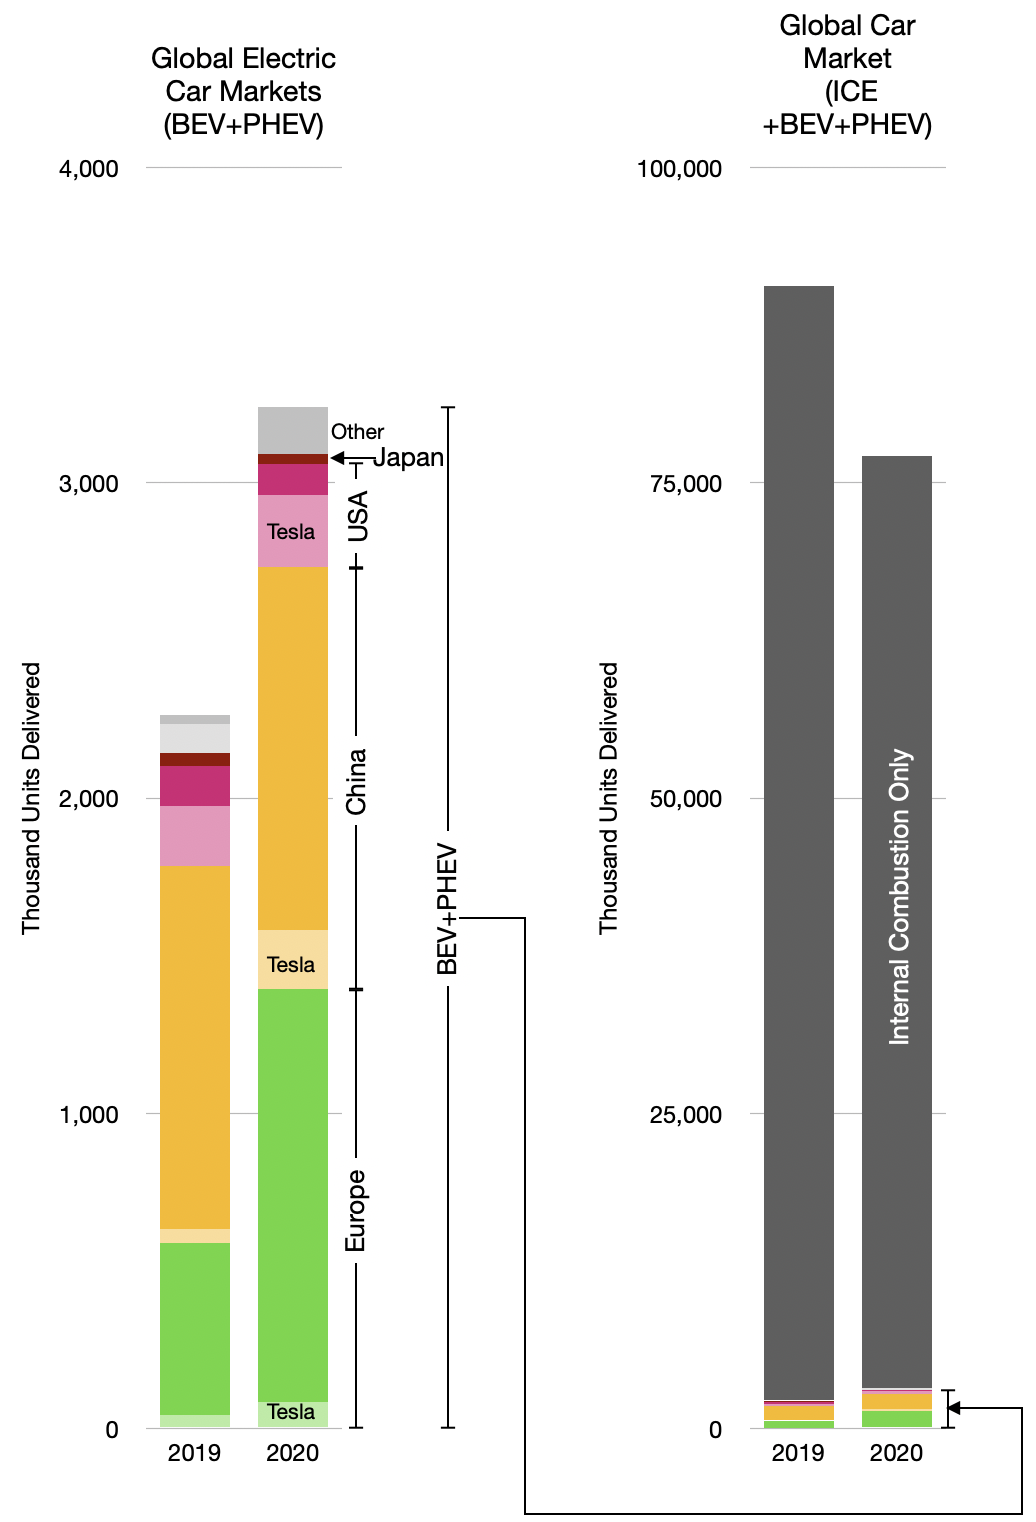
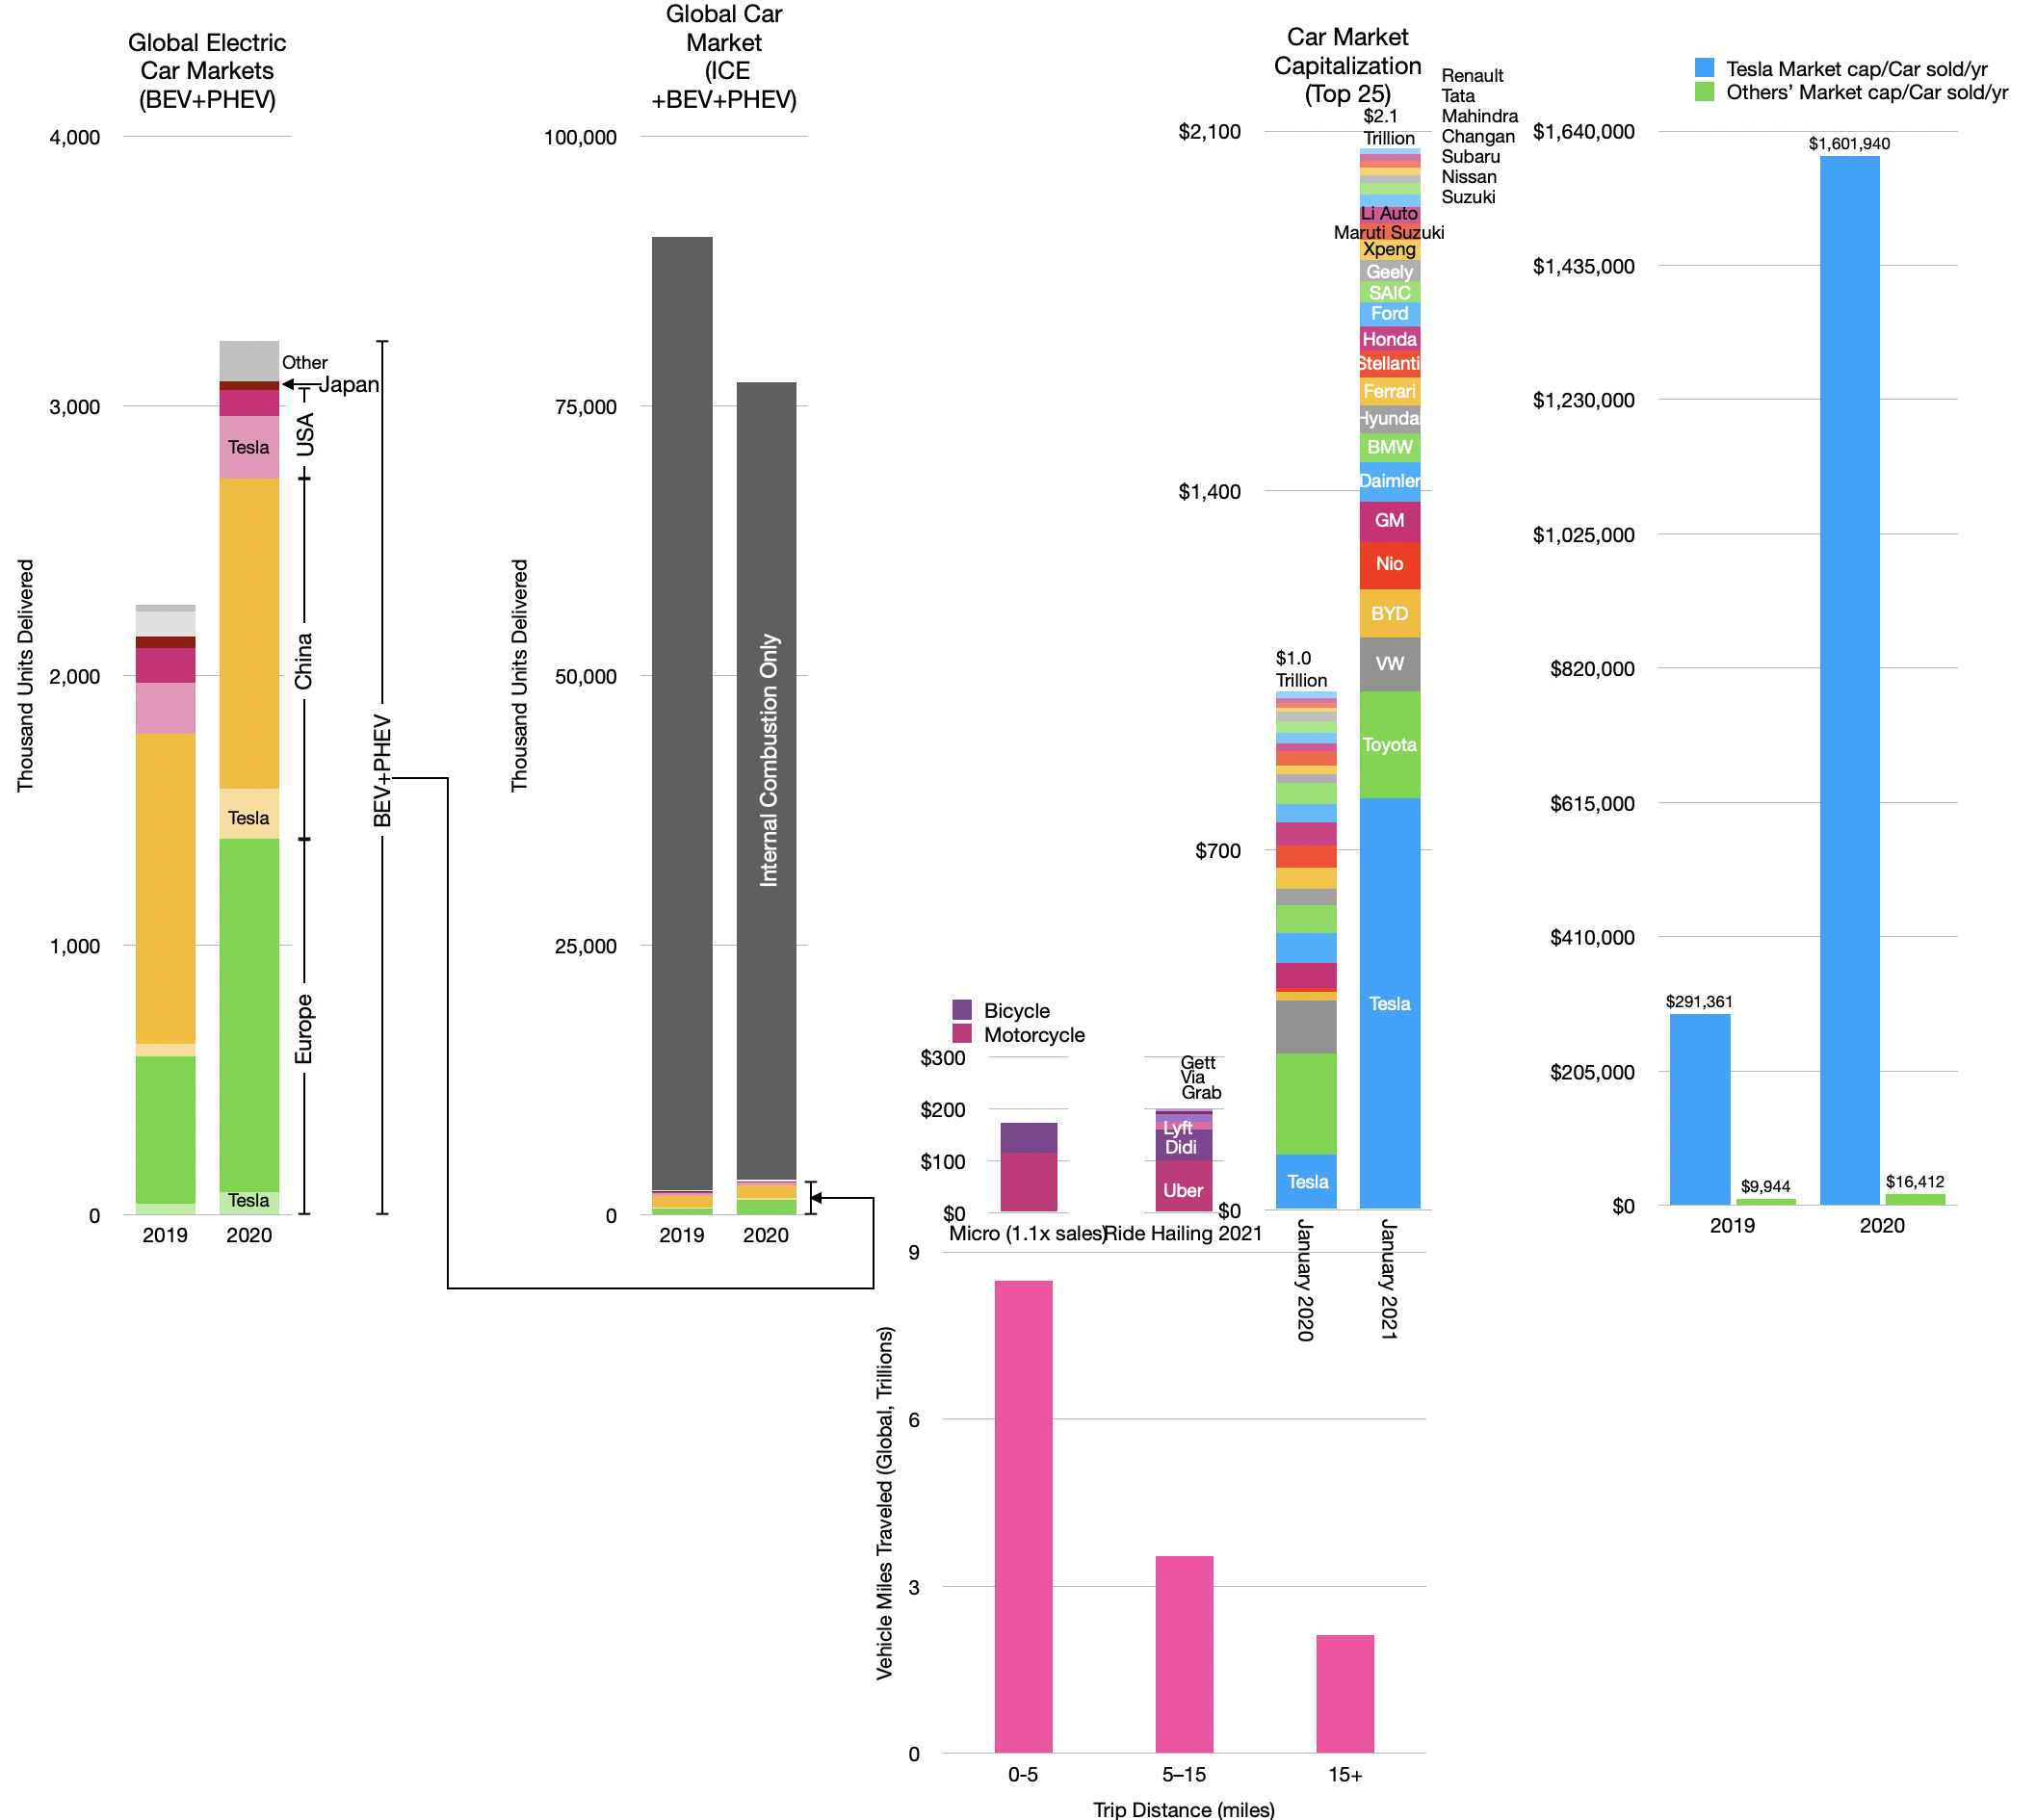
The EV car market is booming. The graph below shows the global market for plug-in electric cars (plug-in hybrid (PHEV) and battery (BEV)--BEV are about 70% of total). The data is split between 2019 and 2020 with further distinction between the main regions.
EV (PHEV+BEV) units sold 2019, 2020 by region.
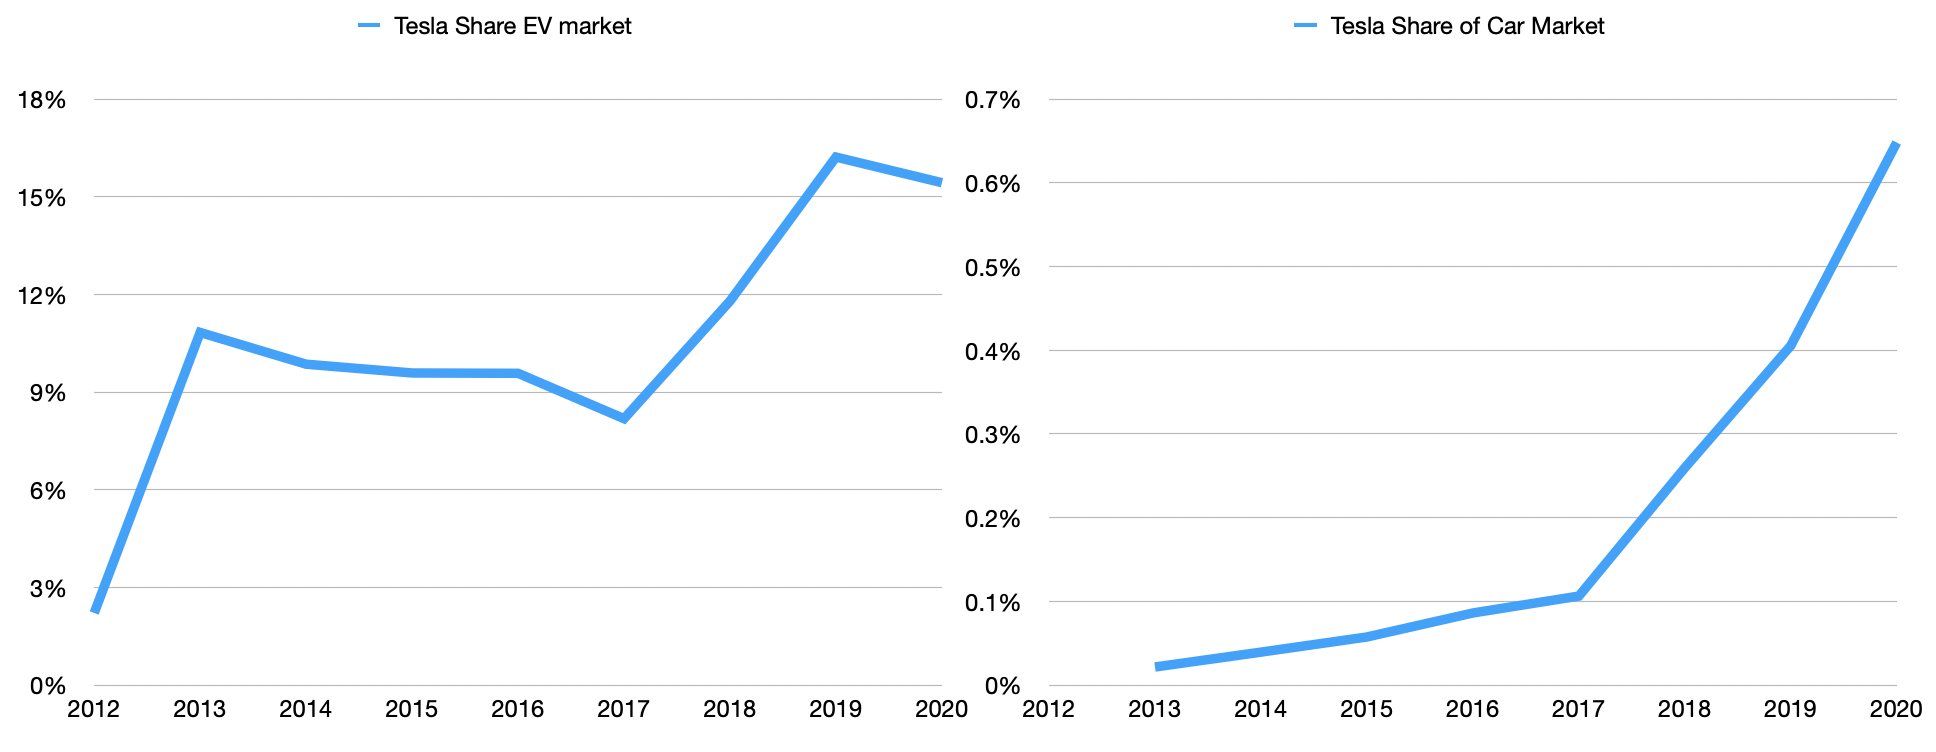
There is an additional detail in the delineation of Tesla's shipments into these regional markets. To that point Tesla's market share of all EV cars has remained roughly equal from 2019 to 2020.
Tesla share of EV car market and share of all cars.
The big story of 2020 was the growth of European EV shipments. Those who follow the market know that new EU penalties for CO2 emissions have come into effect, causing much of this increase. Indeed, previous surges in the US and China have also been driven by new incentives and/or disincentives.
As an aside, it should be noted the absence of Japan from this EV story. It's quite a shock, really. Japan is responsible for a large percent of all cars sold through its national heroes Toyota, Nissan, Honda, Mitsubishi (and Subaru, Suzuki, Mazda, Isuzu) and has been a driving force for innovation. The absence of a local market for EVs is a glaring indicator of lack of industrial policy. Unlike the US, Japan does not even have an oil industry, importing all its supply (while the US is a net exporter.) Yet the US produces and consumes far more EVs than Japan. This should give pause. One wonders what would happen if Japan followed Europe in providing incentives for EVs in the "JDM" market.
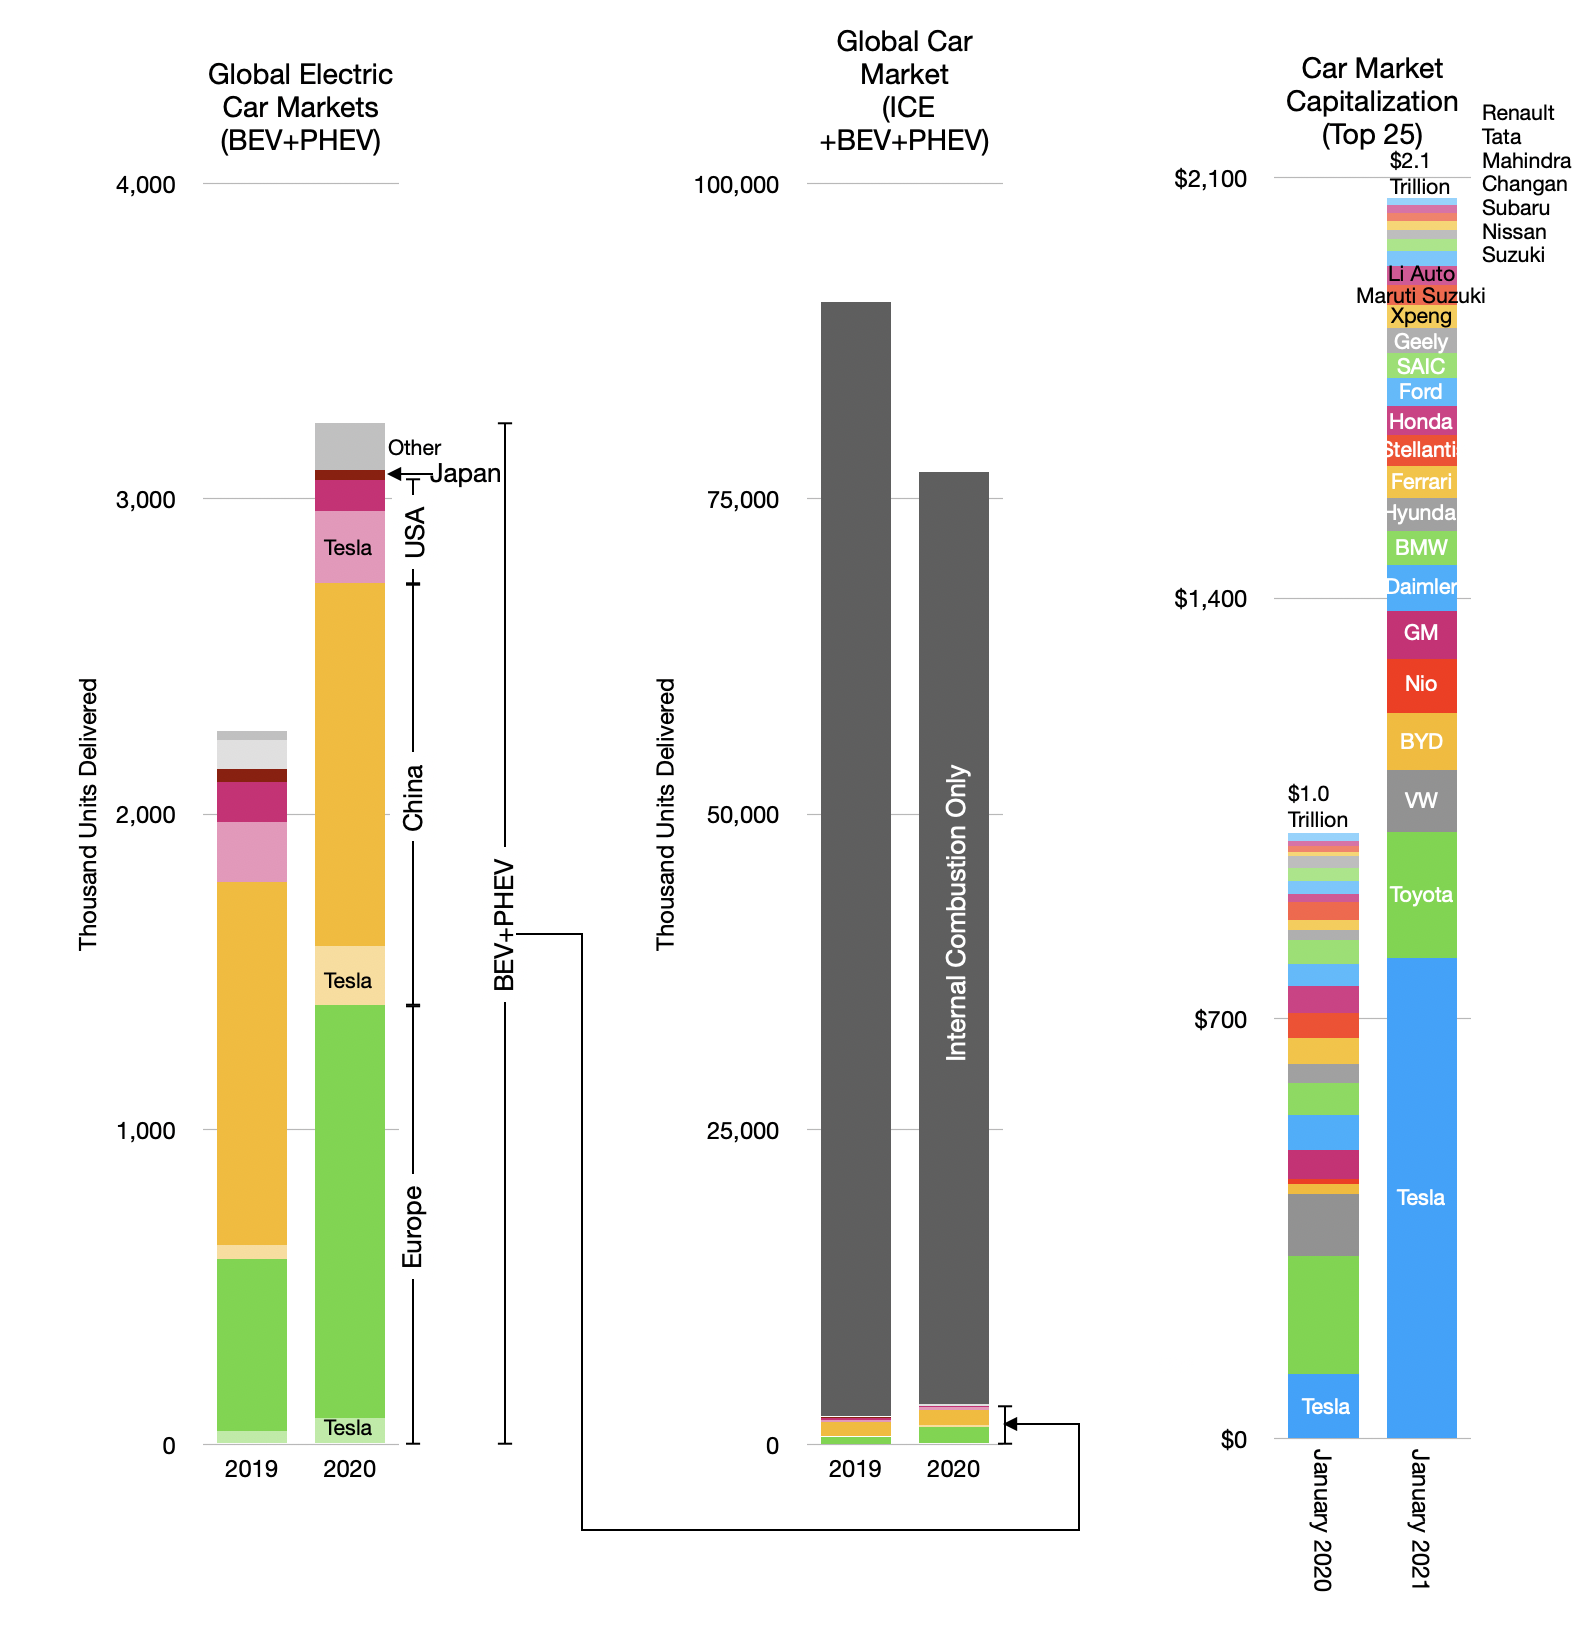
Japan and "Other" countries aside, there was growth. But much remains to be done. The overall industry is far larger, as shown in the following graph.
EV growth and global light vehicles 2019, 2020.
Nevertheless, optimism abounds. With an increase in market capitalization of about 648%, Tesla is now the most valuable automaker in the world.
Tesla, the champion EV maker has taken 17 years to reach 0.65% market share.
Market capitalization of the auto industry (top 25 firms) and the market size (in units delivered).
Actually, as the graph shows above, Tesla is now almost as valuable as the entire auto industry was a year earlier. But the rest of the industry did not collapse. The top 24 companies (i.e. apart from Tesla) increased their market capitalization from $901 billion to $1266 billion during 2020. That's a 40% increase during a year when sales fell by 15%. Quite an achievement.
Overall the market capitalization of the top 25 automakers more than doubled from $1.0 to $2.1 trillion. This begs many questions, mainly, how would such profits ever be generated.
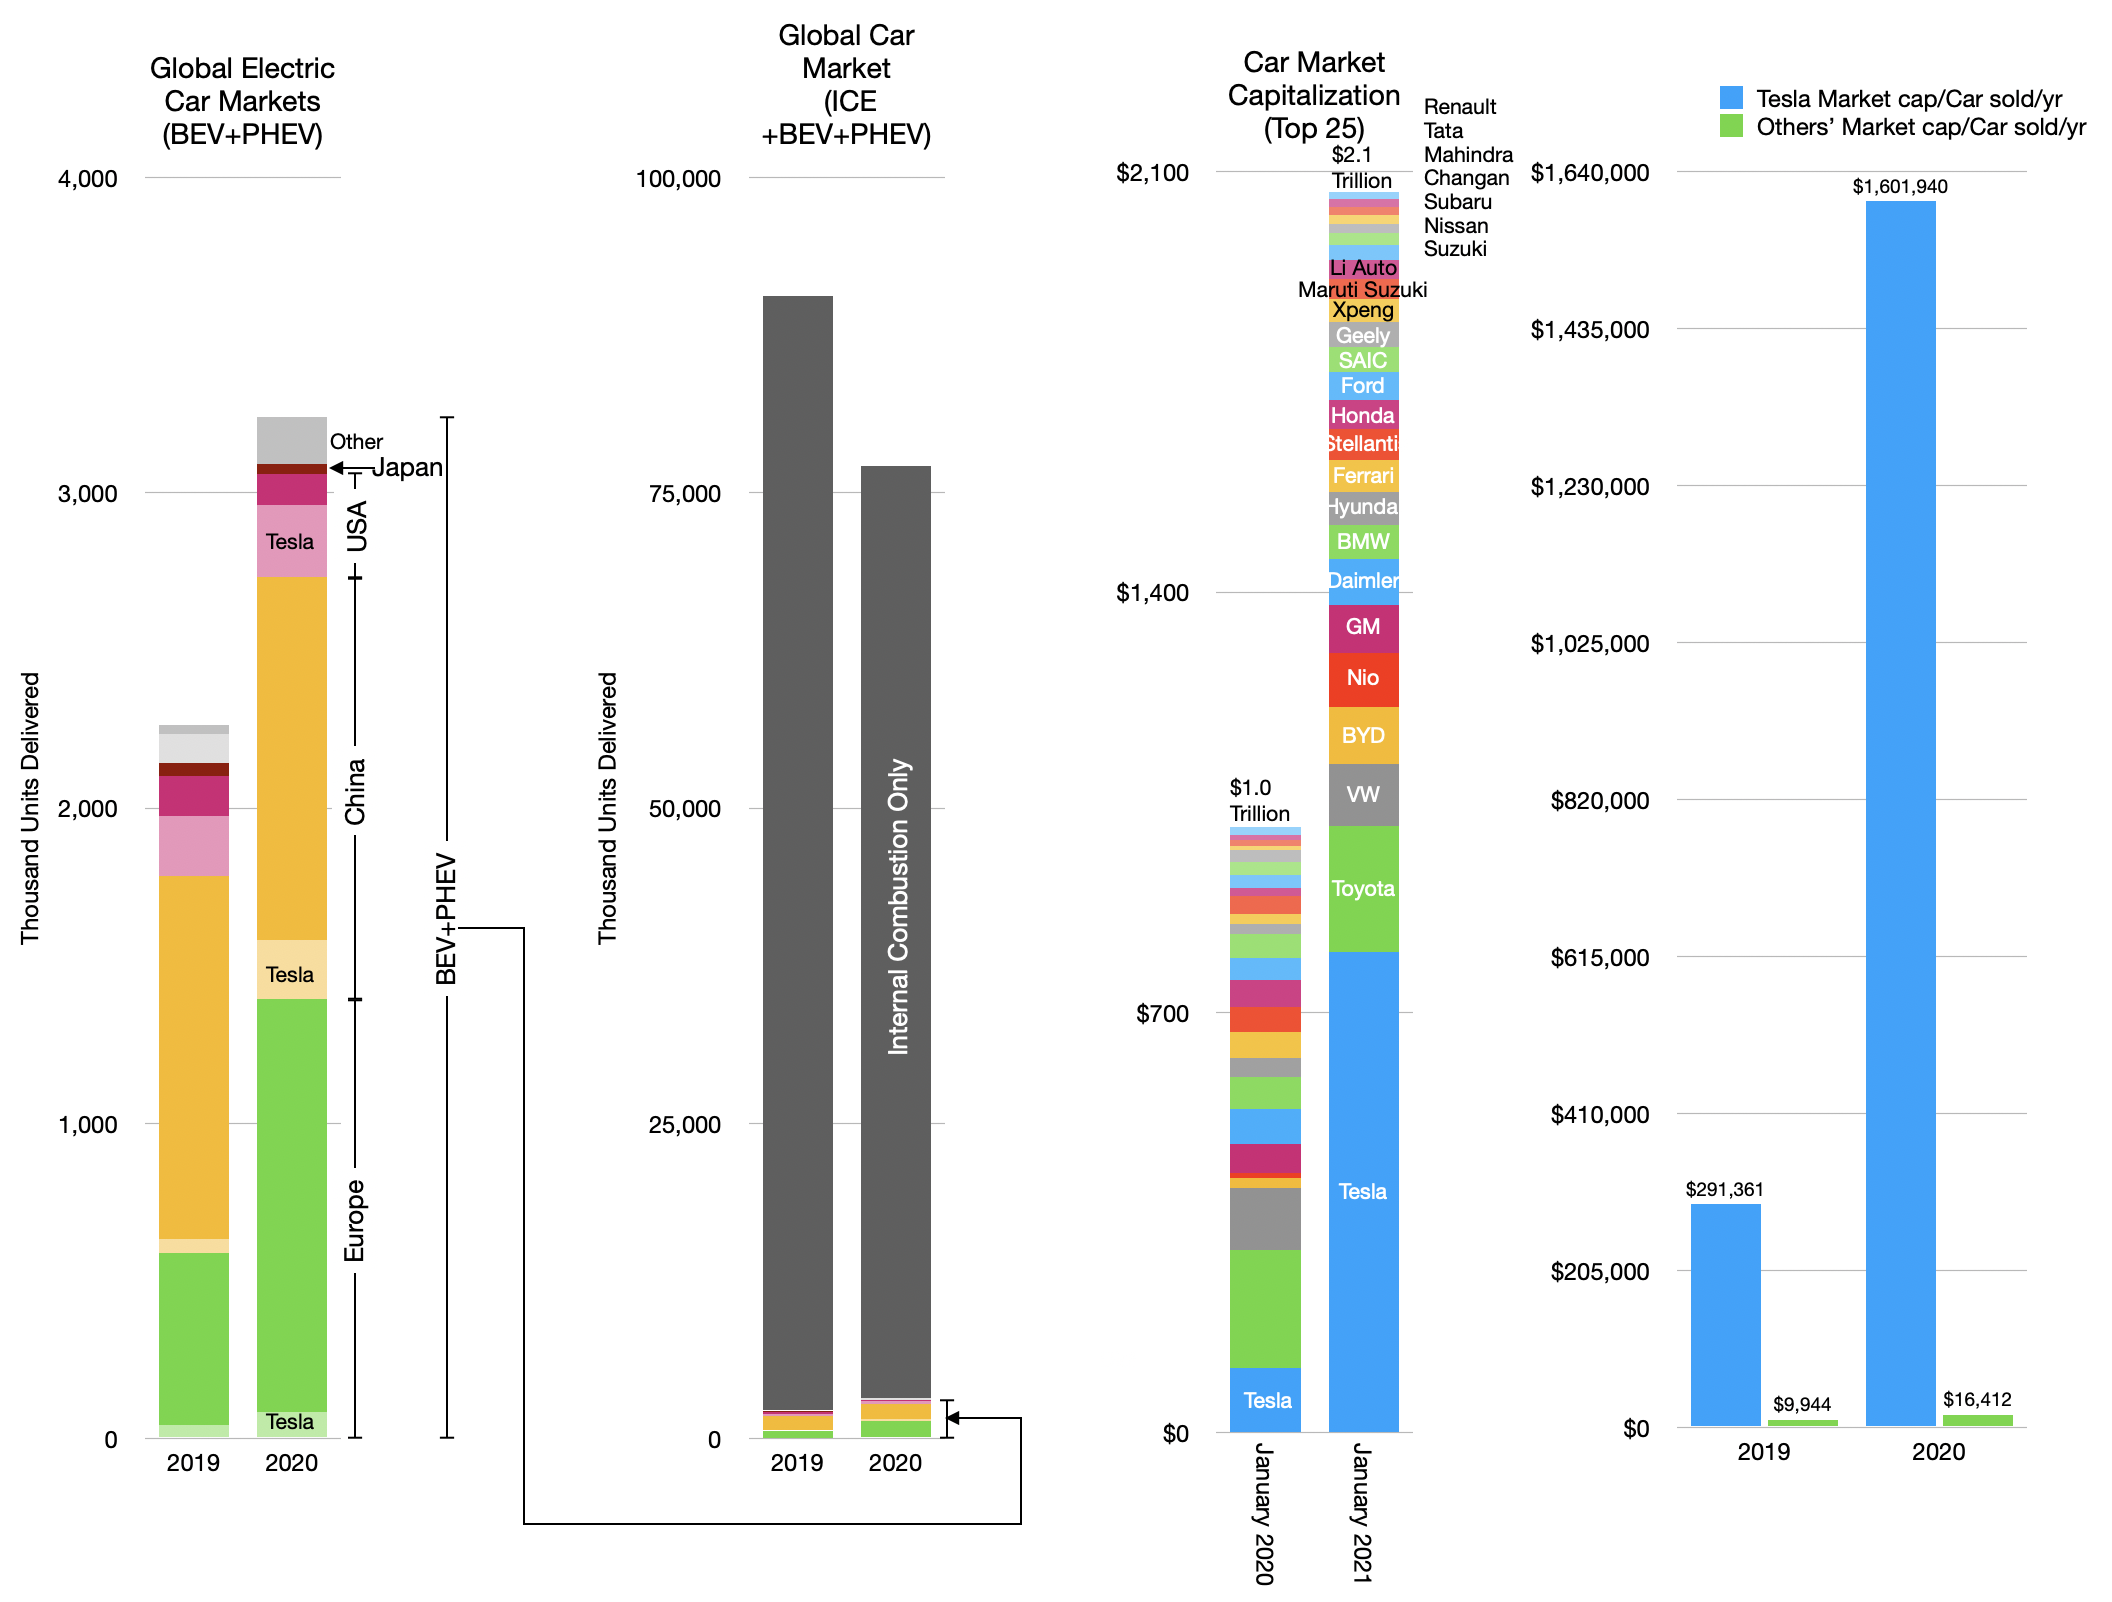
To put a finer point on it, if we divide the market capitalization by units produced we get a figure of value that allows a historic perspective.
A measure of valuation by units of production.
Historically car companies were valued at $8,000/yr. 2019's value was about $10,000 which makes sense given some inflation. But the drop in volumes coupled to increase in valuation brought the ex-Tesla cap/unit to an eye-watering $16,400, a 64% increase in one year.
Tesla's valuation is on a different level. It went from $291,361 to over $1.6 million/car sold. Roughly this is 100x rest of industry.
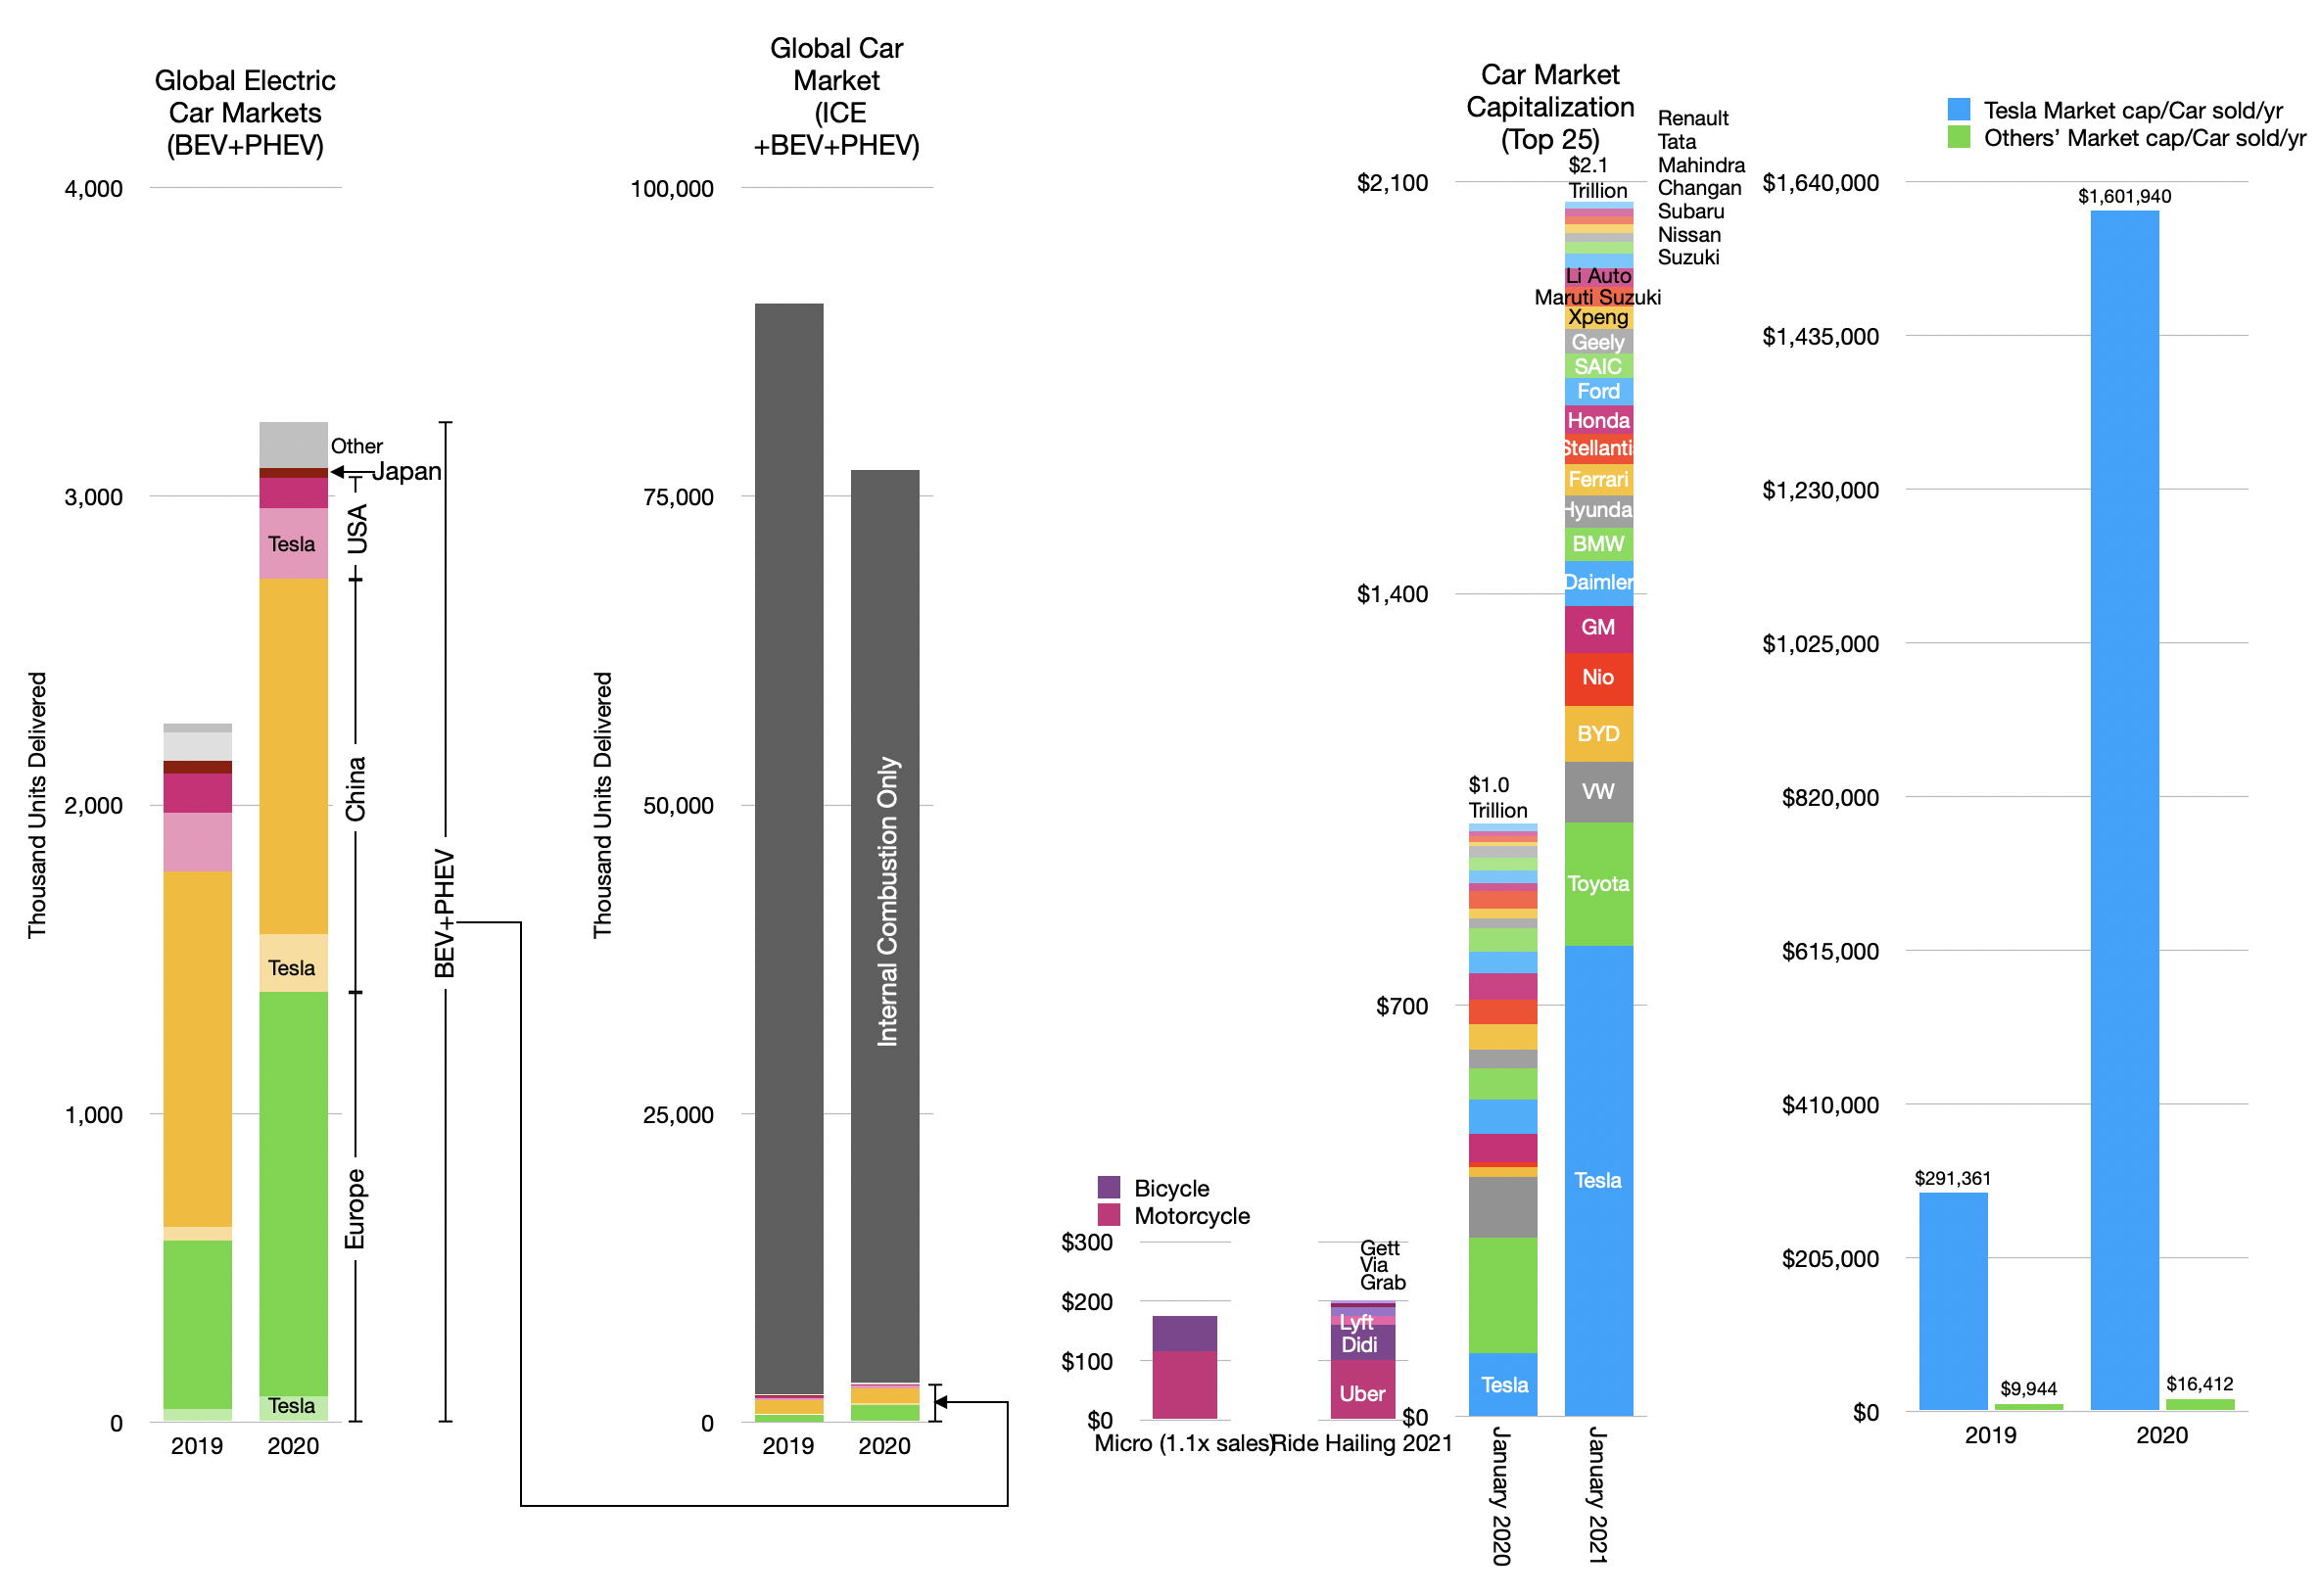
But if we continue to pull the thread there's yet another story to consider. The car industry (i.e. making and selling and servicing cars) is not the only way to deliver "miles" to citizens. There are multiple "modes" and services that deliver transportation.
There are also the ride hailing and micromobility which are positioned on different "jobs-to-be-done" than cars. The market capitalizations of ride hailing and micromobility are shown below
Adding the value of ride hailing and motorcycles and bicycles.
Note that micromobility is only measured by the value of motorcycles and bicycles whose markets are measurable and applying a 1.1 multiple to those sales yield a rough estimate of market cap.
It's hard to get a measure on these jobs but I've taken to heart the idea that what you measure is most important in seeing what's next and have been dividing the "market for miles" into short, medium and long distance trips.
The "Car Bundle Paradox": The demand for travel vs. value of modes for travel by trip distances.
In the view above we get a sense of the scale of perceived value for businesses serving various trips. The inverted nature of valuation positioned on trips is, I believe, worthy of further analysis.
As the car today is a bundle, the design and engineering efforts are directed at serving the longest of long trips (with the largest payloads.) But the demand is for short trips.
If the car is to be unbundled (as the Personal Computer was into laptop, tablet, phone, wearables) then one can imagine that devices designed for short trips would accrue the value of those trips (and their popularity).
The absence of value in short trips is a paradox. Or perhaps it's just an opportunity.
"Our Model 3 program is on track to start limited vehicle production in July and to steadily ramp production to exceed 5,000 vehicles per week at some point in the fourth quarter and 10,000 vehicles per week at some point in 2018.”
Overall 2018 production guidance has been 500,000 units and 1,000,000 units in 2020.
The company shipped 220 Model 3s in the July, August and September months. This is well below the expectation of 75,000 that the 2016 guidance would suggest ((100,000 to 200,000 for the second half of 2017 suggests an average of 150,000 for the six months or 75,000 per quarter)) or the 1,630 that might be suggested by the "production grows exponentially" July proclamation.
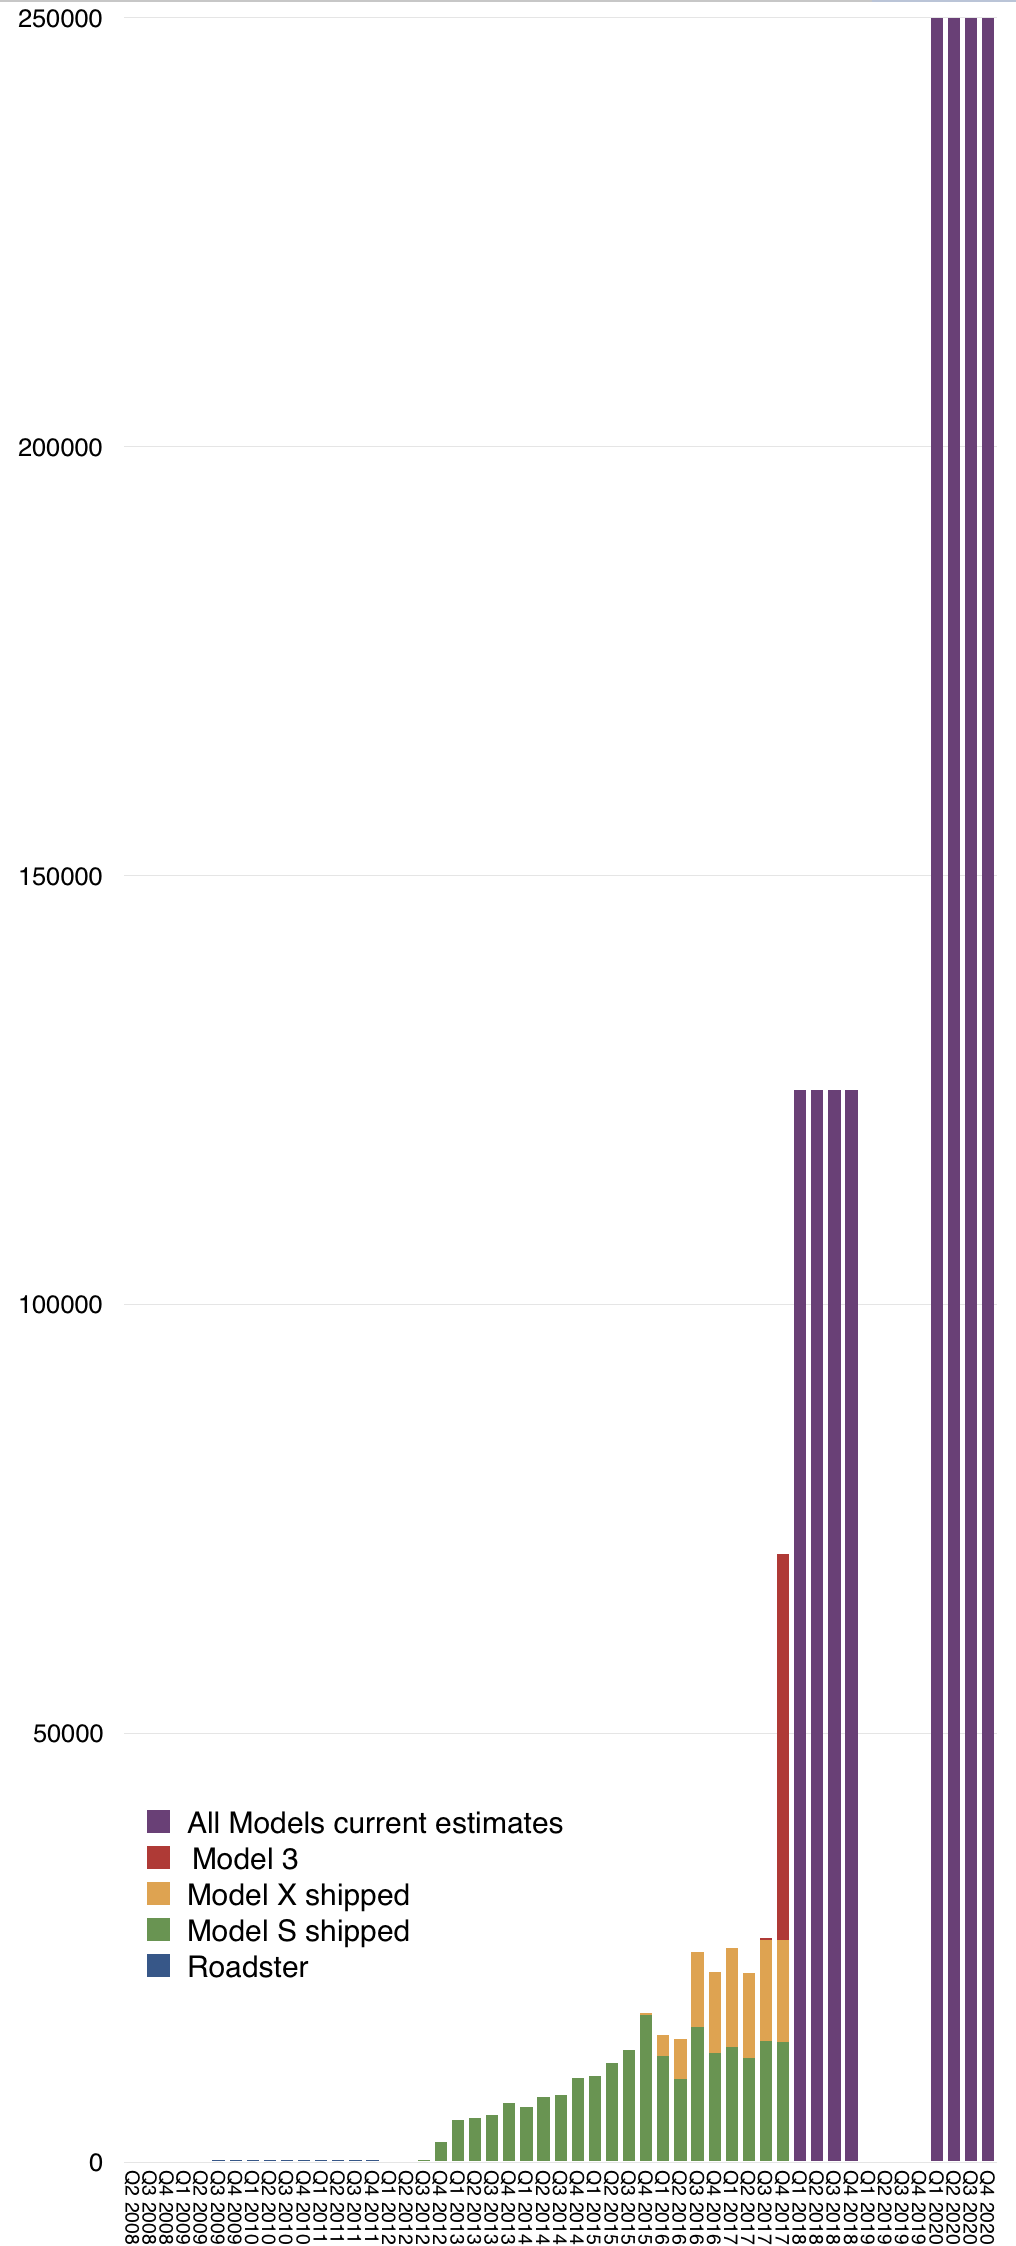
I entered the Q3 production data and kept the previous run rate predictions for Q4 and 2018 and 2020 in the following graph.
Note that the graph includes all previous shipments of Tesla cars throughout its history.
The red bar represents an estimate consisting of the sum of 10,000 Model 3 in October, 15,000 in November and 20,000 in December. This is consistent with reaching the target production of 20,000 in December.
The purple bars are distributing the planned production evenly throughout the 2018 and 2020 calendar years.
Before asking whether these predictions can be relied upon, I'd like to focus on the history of Model S and X production/shipments. Specifically the last five quarters.
Q3 2016: 24,500
Q4 2016: 22,200
Q1 2017: 25,000
Q2 2017: 22,900
Q3 2017: 25,930
Q4 2017: 25,845 ((This is an estimate based on another point of guidance: 100,000 models X and S for the 2017 year.))
Growth in this total figure has been remarkably low. Only about 4% y/y in the last quarter and sequentially the total has bounced in a narrow range.
This level (about 24,000 units/quarter on average) is a distinct plateau but it's also well above the average of the previous 4 quarters of about 15,000 units/quarter. It suggests that there was a “quantum leap” in production at the end of 2016, to a new plateau.
So the question is why, with so much pressure to produce cars to meet presumed unlimited demand, is output so limited?
To see just how limited, consider the rate of output. For the past 15 months and near future, the output is equivalent to 264 cars per day. If the Fremont factory is running three shifts, 11 cars are produced every hour. This is equivalent to a cycle time or takt time of 5.5 minutes.
This would be an tragic cycle time. Most car lines aim for run times between 1 and 2 minutes per station. For example BMW's Spartanburg plant produces 1400 units per day which yields a cycle time of 1 min. ((This assumes one line. The chassis/engine marriage step is clocked at 3 minutes so the worst case is that there are three lines running at 3 min. cycle time each.))
This measure of performance is so important that it drives the depreciation and capitalization schedule for tooling and the very lifeblood of the company: capital expenditures. An underutilized factory is a giant hole in a financial statement and destroys value as much as inventory does. Every manufacturer strives for maximum utilization and is sunk if it does not achieve a minimum threshold.
So why, after a few years of Model S production, is Tesla running at one fifth the speed of a BMW or Toyota plant? One obvious answer is that the company is not running 3 shifts but perhaps 2 or even 1. But why would they shut down the line when demand is infinite? If it is finite, is it really only 25k at most per quarter? That’s a paltry number considering the size of the market they operate in. BMW alone ships 2 million vehicles a year. Tesla X/S topping out at 100k a year suggests a serious limit to their opportunity.
Another possible explanation is that there aren't sufficient battery deliveries for continuous production. We hear about issues with battery throughput as transients that slow production. But the production data we have spans an 18 month period during which the speed has hardly budged. During this time additional battery capacity in the form of a Gigafactory has been announced.
If this giant new factory can’t reliably deliver batteries for 25k cars/quarter then how are we to believe that it can deliver for 125k units in a few months? If it's not batteries, then what? I don't know of other subsystems that are chronically constrained that we can point a finger at. Almost all other parts in a Tesla are sourced from existing supply chains.
The most likely suspect is that Tesla's S/X line is not fully operational. When you study production lines, generally they either work at a decent clip or they don't work at all. They are not designed to be dialed down to be as slow as 5 min for every 10 feet of car. It's much more likely that the line is idle for long periods of time. Perhaps even 2/3 of the time.
This is what is so mystifying about Tesla's exuberant predictions for the Model 3. The X/S line is bogged down and inefficient five years after production start but we are to believe that the Model 3 line will come to operate at >5x speed within weeks, on a new product? Maybe the X/S line is a failed experiment. Maybe the company is moving to "Version 2" and leaving the cruft in Version 1 without fixing it.
Maybe.
Tesla's asymmetric approach to automobile product development and distribution and ownership experience are key advantages but their asymmetry to functioning best practice production systems is a key disadvantage. The big competitive question is will incumbents get good at intelligent EV experiences faster than Tesla gets good at production.
Outsiders might ask "How hard can car building be?" and vote for Tesla winning this race.
There is no data on how fast an incumbent learns the EV experience delivery process, as it's never been tried before, but there is data on how fast a manufacturing company learns lean production. Those times were measured in decades.
[UPDATE]
In the week that followed this post new claims have been made on Tesla's production system by other publications.
Wards Auto published a story on problems with automating the Model 3 production line.
Wall Street Journal published a story on claims that Model 3 production was constrained by hand-building on parts of the line.
Edward Niedermeyer wrote in the Daily Kanban about regulatory documents that show limitations in production of the Model 3.
The most relevant quote to this post is the Wards claim that:
Its current production line in Fremont, CA, can’t build vehicles at [5,000 weekly] rate unless it runs two 10-hour shifts seven days a week, which is not likely for an all-new vehicle, even if everything goes smoothly. The plant presently runs two 8-hour shifts five days a week.
If this is true then the current Model S/X line is limited to about 50% of capacity or about 25 cars/working hour. This is equivalent to a takt time of 2.4 min/station. This is certainly much better than the estimated 5.5 and within a range of reasonableness, but one has to ask why is the line not operating more than half the time?
When I wrote about there being "infinite demand" for the X/S, the logic was that the X/S was still a niche product at 100k/yr and the category into which is sells is assumed to have a lot more headroom for their entry.
The observation that production is topping at 50% capacity for 18 months in a market that is quickly being targeted by competitors remains interesting to me.
A merger is the result of two entities in the same business joining forces. It is usually justified through "synergy", a euphemism for removing redundancies from their unity. Arithmetically, the desired outcome is that the resulting organization should be smaller than the individual parts (which is desired if the available market is shrinking.)
An Integration is the answer to the question of "Why two companies in different businesses are better off together." Arithmetically, it suggests that the proposed sum is greater than the individual parts.
The spin-off is the response to a situation where one company houses two unrelated businesses.
For completeness, we can define an acquisition as the purchase of an unequal entity in order to improve the value of the acquirer.
The logic of any of these is that there is a disequilibrium which offers an opportunity to those who can exploit it. What the analysis fundamentally assumes is that the status quo of firm boundaries is not optimal.
Much of the measurement of the balance in the equations assumes that the overall industry is stable and that the problems (technical or market) are largely understood and that there is no learning that needs to happen. Boundaries need to be re-drawn because they are imperfect. Boundaries may have grown imperfect for many reasons: founders/owners were separate, markets and technologies evolve at different rates, resources are inflexible, processes are entrenched and values are outdated.
However, all this arithmetic can be safely thrown out of the window if there is a new industry in the making. If there is no balance to begin with because there is an entirely new problem being posited. That is, not only do we not know the answers to technical or market questions, we don't even know what the right questions are.
When looking at the history of industry creation, the breakthroughs were always about the discovery of the right questions to ask. The early automobile industry was a scramble for solutions to a huge number of technical and market questions: technology, business model, infrastructure, usability, customer segmentation. From 1886 until 1915 there were many grand experiments with thousands of automobile firms springing up. ((Estimated 3000 world-wide))
Early computing, internet, mobile and consumer durables industries went through similar periods of grand experimentation. But the breakthroughs occurred when someone was able to ask (and subsequently answer) a question that nobody had asked before.
Henry Ford asked, "What would enable everyone to have a car". The result was not a better car but a better production system.
Steve Jobs asked, "What would enable everyone to have a computer". The result was not a faster computer, but a more approachable computer.
Akio Morita asked, "What would enable young people to have their own music". The result was not a better audio quality but a smaller audio player.
Kiichiro Toyoda asked, "How can a car be built without faults". The result was not a bigger factory but many smaller ones.
Jeff Bezos asked, "What would cause people to do their shopping online". The result was not a lot of unique sites but one infinite one coupled to a logistics and computing service.
Having great taste in questions turns out to be the principal quality of the successful industrialist: The creation of economic value and power well beyond the boundary of the firm itself.
When the correct question is asked, resources can be efficiently marshaled to answer it. The wrong or incomplete question leads to inefficient resource allocation. And so the architecture of the solution can be built. If the new problem statement is a technical one then an integrated implementation is required. If the new question identifies non-consumption then a modular implementation is required. Each of these approaches suggests different customer sequencing strategies and different application of resources and processes.
There is no right architecture for industry creation. What matters is asking the right question.
So is Elon Musk, today, asking the right question?
The presumptive question seems to be "What would enable everyone to have an electric car?" This is not a great question if it is seen as a continuation of other such questions: "What would enable everyone to have a safe car" or "an efficient car" or "a reliable car" or "a fast car" or "a second car" or "a fashionable car" or "a bigger car", etc.
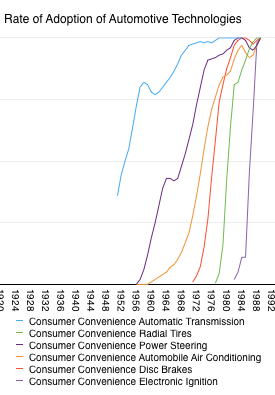
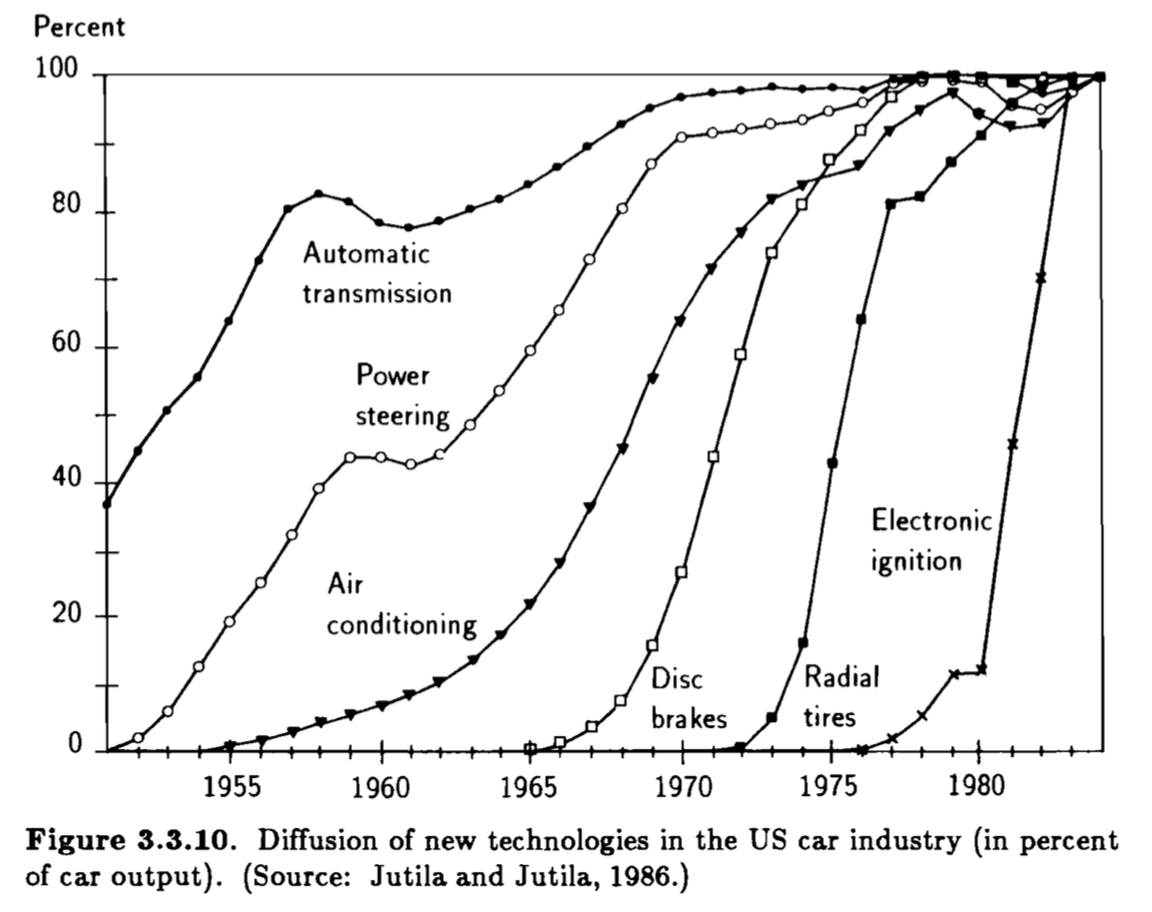
These previous questions were answered by introducing sustaining improvements or modules to the existing production systems. The following graph shows the speed of adoption of various automobile technologies. Hundreds more were introduced and all could be shown to have roughly parallel adoption curves. None of these introductions changed the structure of the industry. ((The industry changed through revolutions in production systems)).
To make electric cars therefore all one has to do is to reduce the cost of electric components for carmakers. They certainly make lots of cars and can make lots more. So why not give them the economic incentives in the form of components to build electric ones? ((Incidentally, hybrid cars are slow to be adopted because the modules are not available as such. Each manufacturer is struggling to match Toyota's solution through internal development—a decade-long process.))
Tesla seems to be an attempt to incentivize carmakers to build electric cars by setting an example. Maybe it will succeed but this is not a reliable or even viable way to build a defensible business. Envy generates the wrong competitive response, usually. If that business cannot be defended then it will perish and so perhaps will the acceleration.
And so we come to the question of whether the defensibility of Tesla relies more on integration. By adding ancillary businesses, can it sustain itself and perhaps eventually pivot away from a commoditizing business (car making)?
Through the addition of a business building batteries and then a business selling home power storage and now adding a business selling home solar power provisioning, the car business becomes a module in a larger system.
So is Musk effectively asking "How to accelerate a global transition away from hydrocarbon energy?"
This gets more interesting as a question. The production, storage and use of energy have been modularized over a century and a half from the wood era through the hydrocarbon era. Perhaps the renewable era will be characterized by integration and de-networking or edge-enabled production. If so the energy problem needs to be solved through a re-integration and a new set of business models. Production and consumption can be coupled and thus production can be decentralized.
But is the answer Tesla+SolarCity? An integrated approach is appropriate if the technical problems are very difficult and cannot be solved through collaboration across firm boundaries and if buyers are eager for great leaps in performance. Join forces if introducing a new measure of performance, solving an unmet job to be done.
A modular approach is appropriate if the problem is one of scale and reach. That is, remain separate if the problems are with finding and building new markets (competing against non-consumption) and if customers are eager for convenience or conformance while being largely satisfied with performance.
This is the crucial dichotomy: The business architecture needs to match the point of time in the evolution of the prevailing measure of performance. Consider this proposed integration an experiment to determine what performance we should measure and thus where we really are.
In my quoting of the "Cook Doctrine" I cited the primary criteria for Apple to enter a new market:
We believe that we need to own and control the primary technologies behind the products we make, and participate only in markets where we can make a significant contribution.
These criteria, often repeated, were certainly in force when Apple chose to enter the watch market. Apple has sought and achieved a significant market share and did so while owning and controlling the primary technologies behind the product.
I now turn to the significant contribution criterion to study the possibility of Apple's entry into the car industry. ((Control of the primary technologies behind the product is a topic for another post.))
The significance test shifts the speculation from whether Apple would build a car, to how many cars is could build. Making a few cars is easy (see first commandment of The Entrant's Guide to the Automotive Industry). Making lots of cars is hard and hence significance in the automotive market (as in watches and phones) means achieving some degree of adoption, a higher degree of usage and a very high degree of profitability.
So what does being significant in the car business mean? Does it mean becoming the next Tesla? The next BYD or the next VW? How quickly?
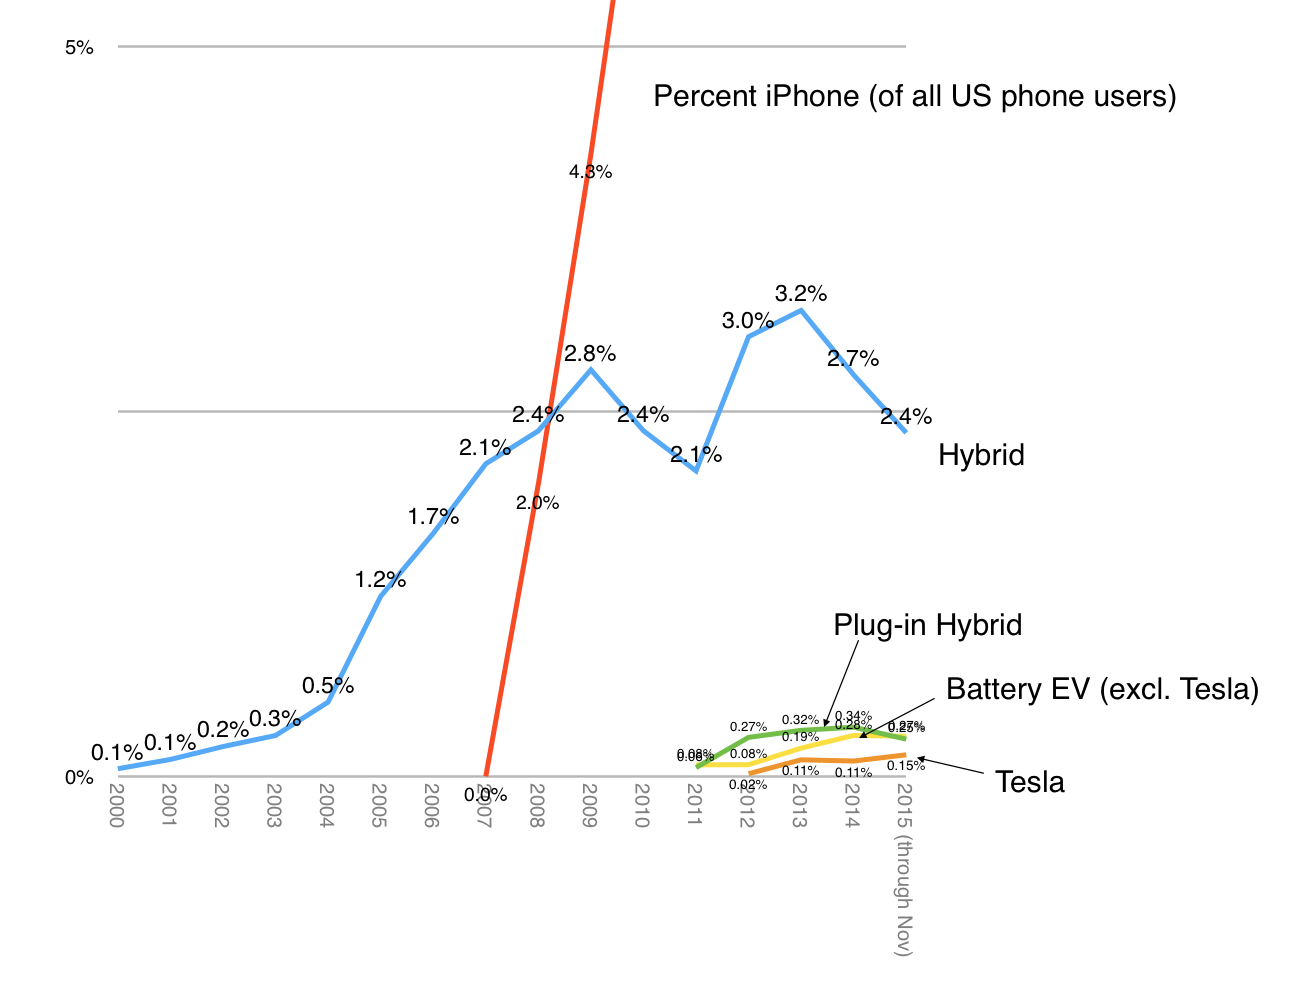
Fortunately, we have something to compare an Apple entry to. Apple has made a "significant" market entry in phones and others have made entries in cars. If we contrast the rate of growth of Tesla, EVs, and Hybrids ((Of which Toyota has 70% to 80% share)) to the rate of growth of iPhones in their respective US markets, we obtain a test of significance:
The graph shows the percent of sales for the alternative car technologies (and Tesla) vs. the percent of US phone users using iPhones (comScore). Here are the conclusions:
Hybrid cars were introduced in 2000 in the US. They managed to gain 2.5% within 8 years but have not increased to a consistently higher level since.
Electric vehicle sales re-sarted in earnest in 2008 and have gained 0.4% share in eight years. They are still growing, partly helped by significant federal and state subsidies.
Between sales start in 2008 and 2015 Tesla achieved 0.15% share.
The iPhone ushered in a new paradigm within the phone market ((Incidentally the number of phones in use and cars in use in the US is comparable.)) in mid 2007. In the time since, Apple achieved the equivalent of about 35% share of unit sales. ((Significantly more in terms of sales value and over 90% of profitability.))
Between 2002 and 2015 the share of smartphones as a percent of all phones reached over 80%.
To summarize, the range for entrant technology share capture spans between 0.4% (EVs between 2008 and 2015), 2.4% (Hybrids between 2000 and 2015) and 80% (Smartphones between 2002 and 2015).
Within a similar time frame, the range for entrant company share capture spanned between 0.15% (Tesla as percent of US car market) and 35% (Apple iPhone percent of US phone market). ((Toyota's capture of 2% of the market with hybrids may or may not be considered entrant--I chose to consider Toyota an incumbent which took share from others with the Prius))
The differences thus span two orders of magnitude (>100x). Put another way, if Tesla's car entry was equivalent to Apple's iPhone entry they would have delivered about 5.5 million cars rather than the 50.5k they delivered in 2015.
This wide gap in the impact of entry in the two markets has much to do with how modular are the systems being engaged by the entrants. An electric automotive system requires new infrastructure, new user behavior, and, in the case of Tesla, new distribution network and new post-sales support network. Offsetting this partially is a government subsidy.
In contrast, the smartphone communications and computing system leveraged existing infrastructure ((And vice-versa)), consistent behavior, at least initially, and the same distribution and support network. In addition, smartphones benefited from significant hardware and software and services ecosystems which encouraged third parties to add value to the system.
The difference in collaborative development and conforming user experiences (i.e. modularity) between the two innovations allowed the speed of change to be two orders of magnitude faster. The result is what I would consider significance for the iPhone vs. insignificance for electric vehicles to date.
Which leads us back to the question of why Apple would enter this market. If the absence of modularity prevents rapid change, that implies Apple cannot achieve any significant impact from entry.
We could ask the question differently: If they do enter, they could achieve significance only if they change the degree of modularity in the system. Think of it as allowing infrastructure leverage, consistent user behavior, wide distribution, wide support network, ecosystems, and component architecture; allowing rapid scale production and lower costs, etc.
Therefore the only way that Apple could justify entry would be if they "rationalized" the system into a sufficiently modular alternative. Only if we assume that change is possible could we then target share above the 0.1% insignificant change that has been demonstrated. They might even perhaps aim at 1% impact within a few years of entry. 1% was the iPhone target within the first full year of sales.
If system-wide change could be brought about and made uniquely (through some form of sustainable asymmetry) then the foreseeable share possibility quickly reaches the 10% range.
The last time that happened was when Toyota changed the way cars are designed and built. ((VW before Toyota and GM before VW. Incidentally Toyota, GM and VW are now nearly tied as the top three automakers globally.))
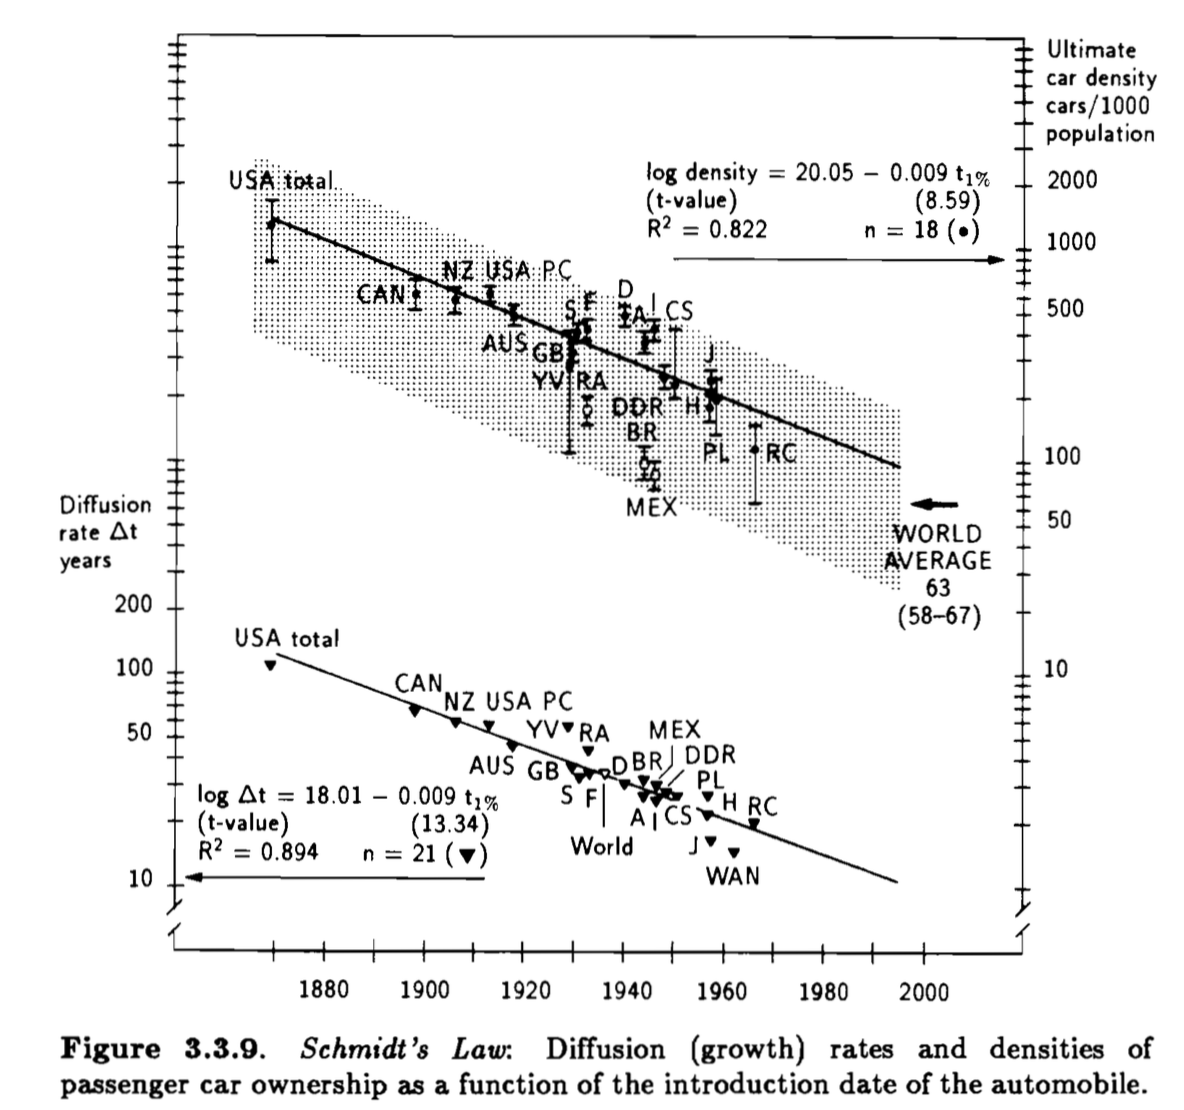
To the analyst, the car industry is a wonderfulstudy. Unlike some other "high technologies," whose market births and deaths are separated by a few changes of the seasons the automobile industry has been around for well over a century. It has been sustained through dozens, perhaps hundreds of innovations. Almost everything about the car of a century ago has been improved.
Not only improvements to the product itself but improvements to the infrastructure that supports it: roads, gas stations, services, insurance, regulation. At the same time, its numbers have increased steadily as the car has spread to all corners of the world through waves of increased production and distribution. Although invented in Europe, the production system that allowed it to reach the mass market took hold in the US. That production system was then exported to Europe then to Japan and then to Korea and now to China.
Figures 3.3.9 and 3.3.10 from Arnulf Grubler's The Rise and Fall of Infrastructures
However, throughout this century of improvement, the business structure—the way money is made—has not changed. Even with the arrival of Volkswagen in the 1960s and Japanese automakers in the 80s, the network of incumbents has not been displaced. Newcomers have taken share, but there have been few exits suggesting that classical disruption has not taken place.
When we look at the reasons for the share displacement that did take place, we see innovation in production systems and distribution as the core causes. We see new manufacturing processes and competition against non-consumption. What we don’t see is new technologies. We don’t see diesel engines or anti-lock braking or crumple zones or fuel injection or radial tires or airbags or automatic transmission or air conditioning or electronic ignition or safety glass, or any of the other hundreds of technologies that have been adopted as causing any change in market share.
Every innovation tends to diffuse rapidly throughout the industry, being widely adopted by all manufacturers. Production systems such as the ones from Ford and Toyota have been much slower to be adopted which has offered those innovators an advantage for a few decades, but they too have eventually been widely copied and created normative behavior. The opening of new markets like Asia, Eastern Europe, Latin America, Africa and China have created opportunities for local manufacturers but eventually those advantages too have or will be diminished with time.
So, given this, we have to ask if the the availability of new power storage technologies would allow an early mover to displace and move aside these established makers. To answer in the positive would imply that the challenger has an asymmetric business model—one which causes the incumbents to flee in the opposite direction. But Tesla is manufacturing cars using the same JIT processes and ramping quite slowly. Toyota-style process-driven innovation does not seem to be even in the works. There is no shortage of manufacturing capacity, indeed there is too much.
Furthermore, Tesla is selling cars in established markets competing against existing consumption. Volkswagen Beetle or Model T style competition against non-consumption does not appear to be on offer.
Tesla's product introduction rate is relatively sedate, so a higher rate of product development which might let them “turn inside” the incumbents, does not seem likely.
Finally Tesla is introducing products priced well above average appealing to the wealthiest of customers, again causing us to ask how this might cause a luxury company to look at their solution and exclaim “Not for us!”.
Looking from every angle I am unable to find the way that Tesla is asymmetric. Disruption theory suggests that whatever causes it to survive or prosper will be embraced and extended by competitors precisely because it will also cause those competitors to survive and prosper.
The auto industry may be a lot slower than the computer industry to respond. But once the industry embraces battery-based power, it will convert a world-wide production and distribution system to sustain itself.
That does not mean Tesla is a bad business. They may carry on with Porsche-like or even BMW volumes for a long time. But that’s not a disruptive outcome, it's a niche strategy.
There is one more point. As Tesla has chosen to share its intellectual property and as Elon Musk has stated publicly, they welcome others to build the same cars they do. So by their own admission the company does not seek to disrupt. Disruption is a competitive stance.
Horace Dediu and Jim Zellmer discuss the odds of disrupting the present automotive club via Tesla. We further dive into the regulatory and cultural environment that sustains the current players, while reflecting a bit on Segway, Toyota’s Winglet, organ donors and the Fiat “multiair” engine. Finally, we preview a larger discussion on apps in and around the car. [24MB 57 minute mp3]