Asymco

Asymmetric Intelligence

Research

  1. Is Apple Pivoting?

    Research · 3 comments

    No.

    After the flurry of new product launches this week, I've read a few comments suggesting that this is a new strategy for Apple, or a pivot of sorts. The premise is that the 17e and the MacBook Neo are new low-end products that are intending to compete in markets that have been either uninteresting or unattractive to Apple in the past. Thus the company is now turning to either addressing affordability, memory costs or competitive pressures.

    The flaw with this argument is that there is an assumption that Apple segments its markets by price. The bigger assumption is that *all* markets are segmented by price. This is naive in the narrow and broad sense. If you ask me, any marketer that segments by price is not very good at their job.

    Remember, when you segment, you are making an explicit causal statement describing a purchase decision. In other words you are specifying the reason people buy a product. Price segmentation suggests that the reason for any purchase is that it reflects what the buyer can afford. Rich people buy expensive versions of a product and poor people buy cheap versions of the same product. The problem is that I've known many poor people who buy expensive things (actually most luxury brands sell to the less affluent) and many rich people buy cheap things (shunning conspicuity). The correlation is poor and the causation is actually nonexistent. Most importantly, you are missing the ability to create any new products because "new" simply implies higher or lower price.

    In the case of technology products, performance is also a factor. Here again, there might or might not be correlation between performance and price and customer income/net worth. Many people of means buy low performance products and many who are constrained financially will pay for performance. For instance, a non-wealthy aspiring YouTube influencer may very well purchase a high performance computer for video editing. And a millionaire pensioner could well opt for a MacBook Neo to communicate with grandchildren.

    So what is causation for technology, or, for that matter, any product or service? The answer that comes closest is the "job-to-be-done". What outcome is desired and circumstances are present when a purchase decision is made? What are the forces pulling and pushing the decider? It might be tempting to generalize and say that the young are poor but it would be wrong to generalize that they don't demand performance.

    So what does this mean for Apple's portfolio?

    First, knowing a bit of history tells us that Apple has always considered all people to be its customers.

    Not the rich or poor, not the old or young and not the demanding and undemanding and not those in one country and not another. Rather than these facile distinctions, what it has insisted on is that it did not want to deliver crummy products. It has insisted that it could not deliver a good MacOS experience with the components that go into a "chromebook" or "netbook" type of terminal computer. As the definition of "quality" of performance shifts, the boundary of what is good enough moves too.

    Second, the experience it insists on can be gated by the cost of the product. A case in point is the Apple Vision Pro. Today, delivering an acceptable spatial computing experience leads to an expensive headset. Does that mean it's a failure if volumes are low? No, it may suggest that it's too early or that emergent applications require more developer attention.

    Third, it insists on profitability and shuns "loss leaders". This insistence came from Jobs but it makes fundamental sense because without profitability you don't have the signal that you are doing the right thing. By accepting a price, customers are signaling that you are doing something worthwhile. By underpricing and getting wide adoption you have no idea if there is value created.

    My observation of the Neo is that it's a watershed product which finally allows a mobile processor and the tight integration of mobile (read: super efficient in cost and power) chipsets and integration to serve as good enough MacOS/laptop foundations. I suspect that the entire logic board of the Neo is barely the size of that of an iPhone, allowing it to almost disappear inside the case. Having that density of power be enough to do 80% or what all laptops are hired to do is astonishing.

    Some say that it's nothing more than an iPad. I'd take that as a compliment. iPads are very clever and sublime. The price of the Neo is below some iPads and even more astonishing is that a Neo is less than half the price of some iPhones. The decoupling of size, price and performance is complete. There is no longer a distinction between mobile and non-mobile computing. Products are now defined strictly by jobs they are hired to do.

    The signal here is that there is an Apple product for many jobs and few jobs exist for which there isn't an Apple product. That is far more profound a situation than a price band extension.

    What has really happened is that, due to its investment in Silicon, Apple has expanded the job space it can be hired for. It will ultimately lead to the ability to serve more than 2 billion customers with at least 3.5 billion devices. And that is not a hard limit. It's just what can be foreseen today.
  2. Stairway Update

    Research · 3 comments

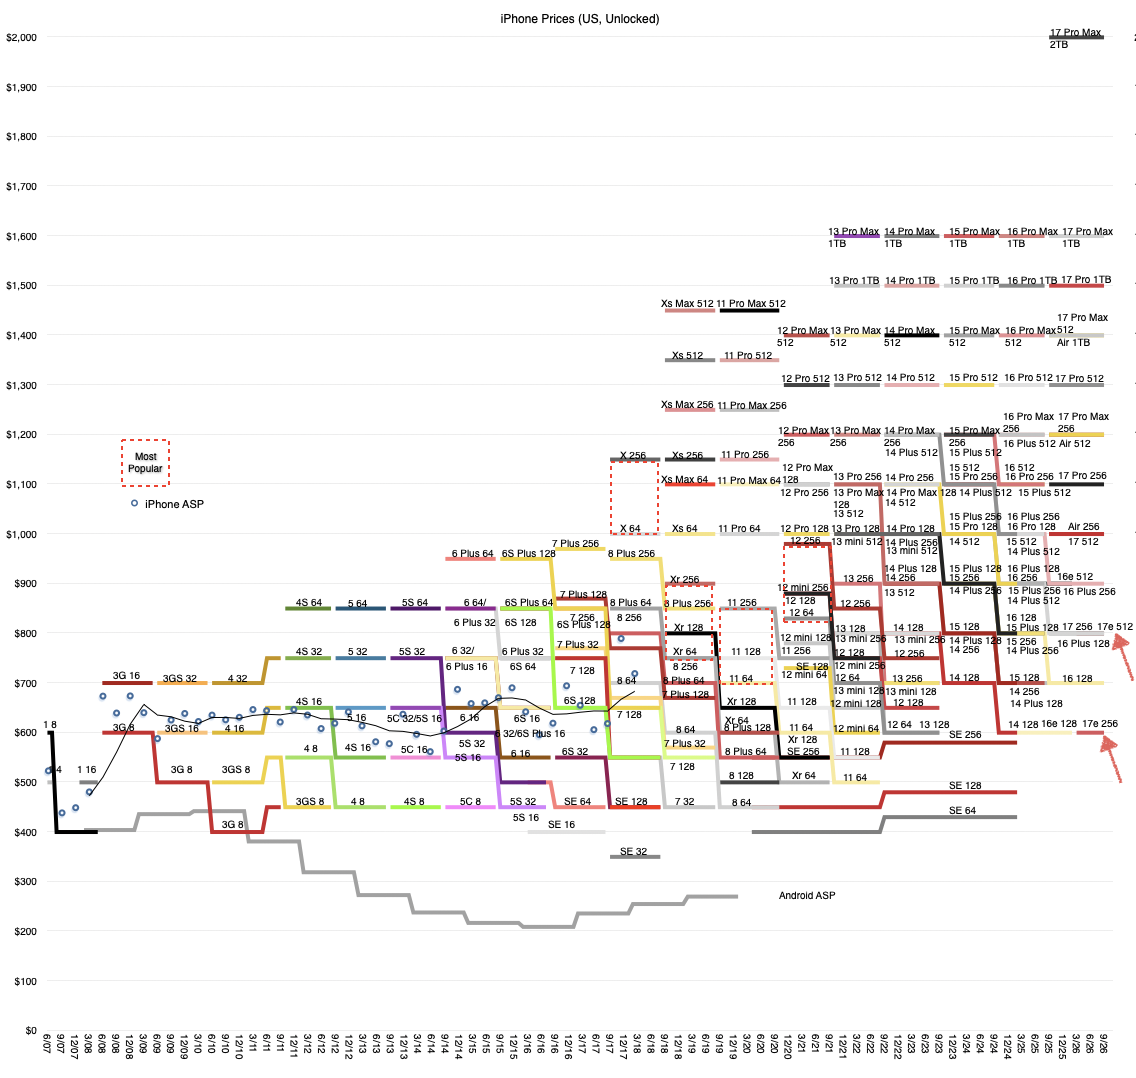
    Meet the new low end, same as the old low end, but better.

    The arrows point out the new 17e price points. They are, of course, a replacement of the 16e but now there are two rather than three. The memory of the base model is double and all the other goodness is included. The 512 17e is $200 higher and the mid-size model is gone.

    The only thing I note is that the doubling of memory is provided at the same price point suggesting more leverage and in contradiction to the assumptions being made by the DRAM catastrophe cult.

  3. Apple Services in Europe: Scale and Growth

    Research · 7 comments

    Apple offers an answer.

    Since October 2023, Apple has been reporting the average monthly users of the App Store in 27 EU Member States. The reports are updated every six months.

    I took three samples spanning 2023 to July 2024 to observe the evolution of the market.

    A few notes:

    • The list is complete including all member countries, with a combined population of 450 million people.
    • The resolution is 1 million users per country which I assume to be rounding down. That is, if a country has 3.8 million users, it's reported at 3 million and .8 million is reported as "under 1 million"
    • For this reason the error is an undercounting error.
    • Some estimates are made to reflect this error when looking at the trajectory over time.

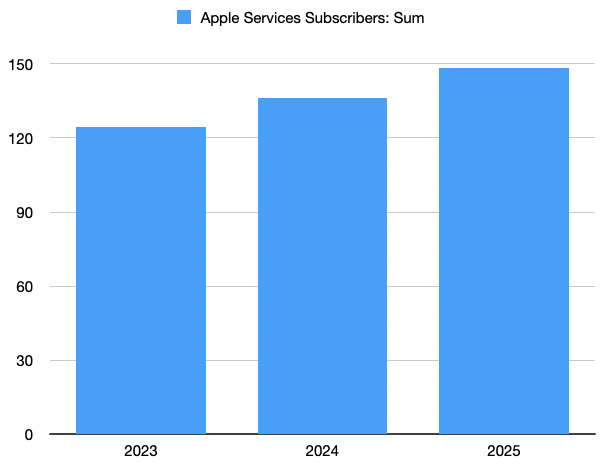
    The samples I used yield the following user totals:

    The totals are in millions.

    Discussion

    The totals are 124.61, 136.27, and 148.23 million for 2023, 2024 and 2025. The growth rate is about 9% for both years. This is significant growth implying a doubling in 8 years. The user population is about 33% of the entire population (year 2025) suggesting a potential doubling is possible though perhaps saturation might be reached before 66% and growth might slow. A 50% saturation point however is certainly possible and that would imply about 225 million users.

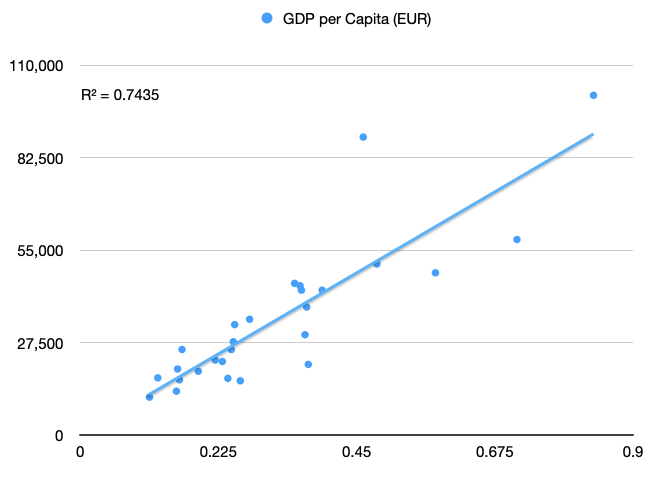
    Adoption is highly correlated with income (r-squared = .75)

    The EU is a diverse region with 27 distinct countries. How they absorb Apple's ecosystem is quite likely to be a good indicator for other regions. The relationship between income and adoption is certainly worth considering.

  4. How many Apple users are in China?

    Research · 2 comments

    Greater China.

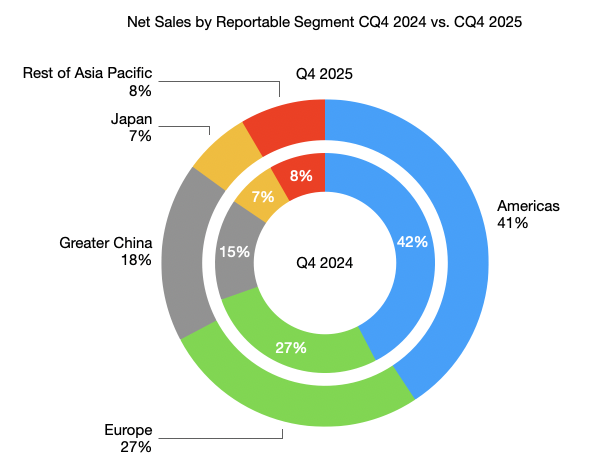
    As previously reported, China represented 18% of net sales for Apple in the fourth quarter of 2025. This was up from 15% the year before and the third largest reporting segment. The segment grew by 37.9% year-on-year.

    It's time to understand precisely how big this market is in terms of users, iPhone install base and device install base, with an eye toward understanding the history and potential for growth.

    First, it's important to note that Apple refers to "Greater China" (GC) not just China. That means within this reporting segment are Mainland China, Taiwan, Hong Kong and Macao. The populations are approximately, 1.4 billion, 23.2 million, 7.5 million and 700k respectively.

    Second, the population of smartphone users has been growing dramatically. In 2016 there were about 690 million (GC) and in 2025 the number is about 997 million. The forecast for 2029 is 1.08 billion.

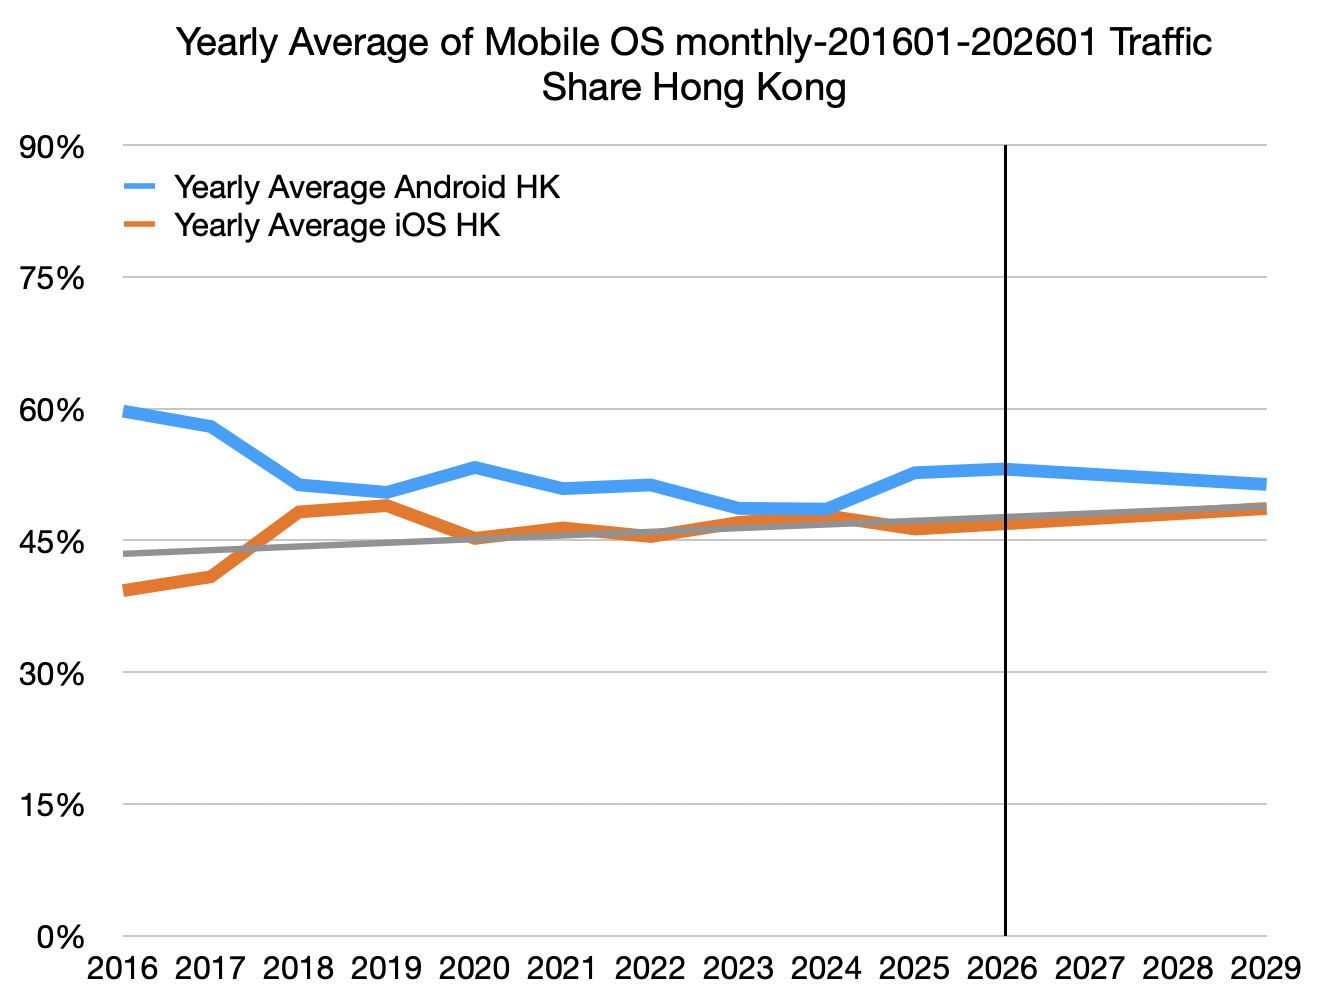
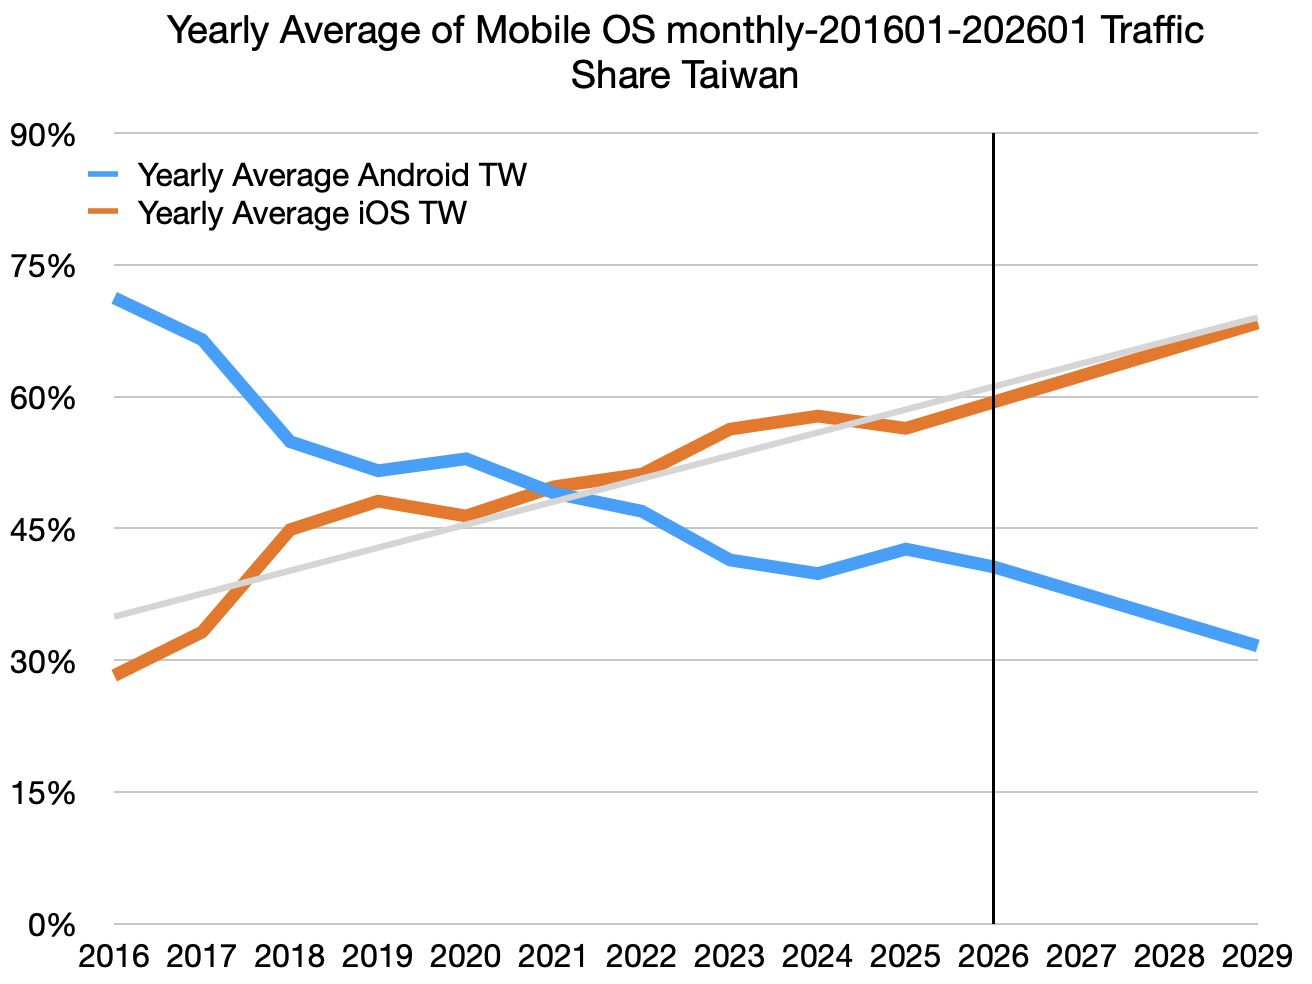
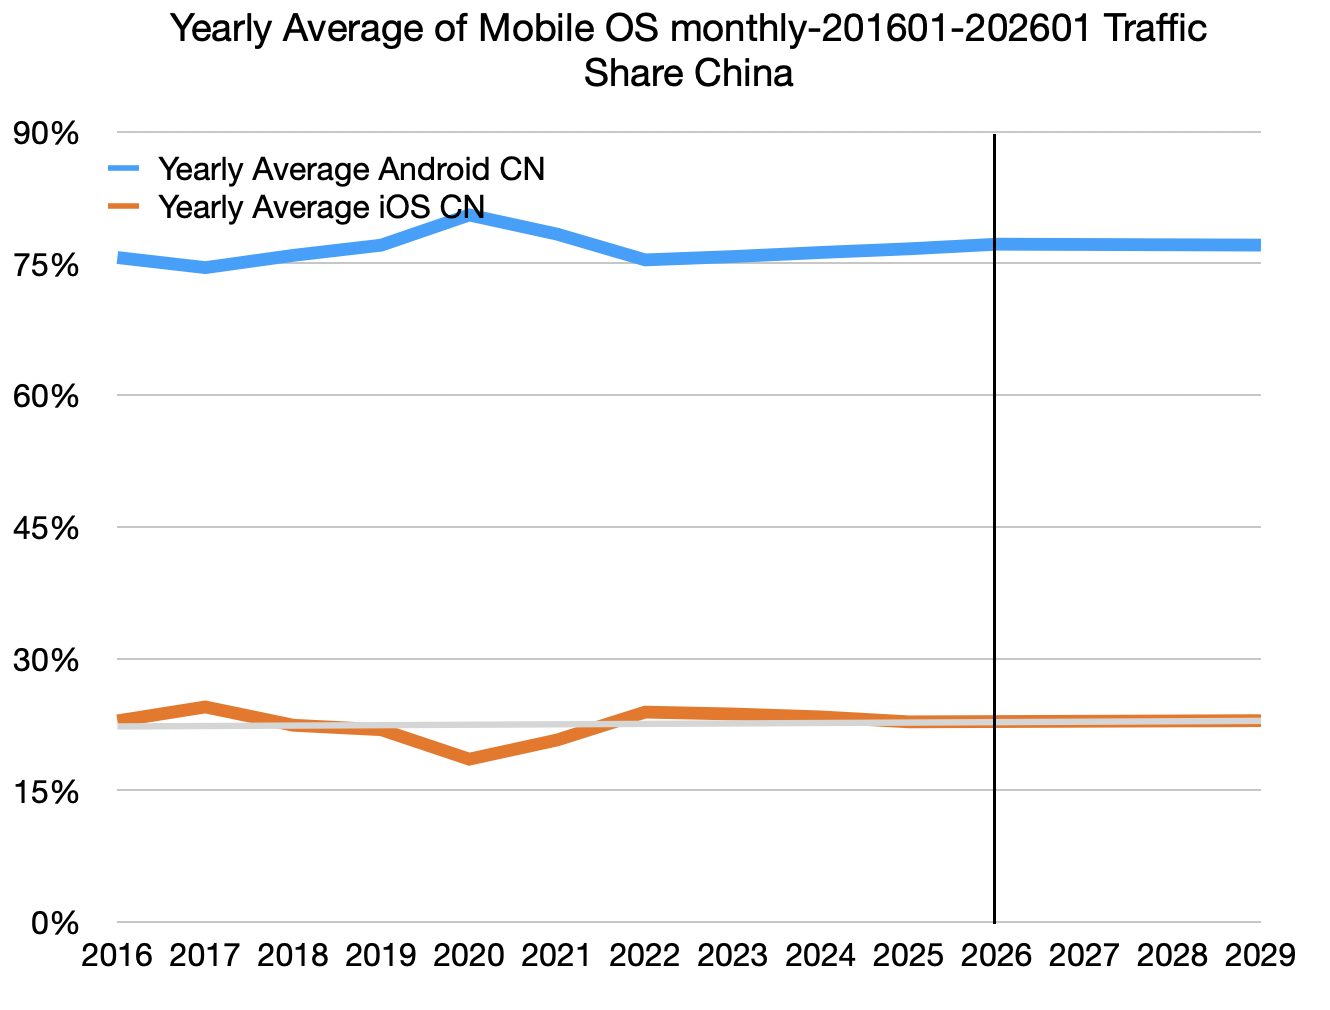
    Third, the share of iOS has been rising but at different rates in the three regions (Macao is excluded because of small relative size, but Apple is holding iOS share steady at about 60%.)

    These graphs represent the trends in Mobile OS share as collected by Statcounter and trendlines for iOS are shown with projections to 2029.

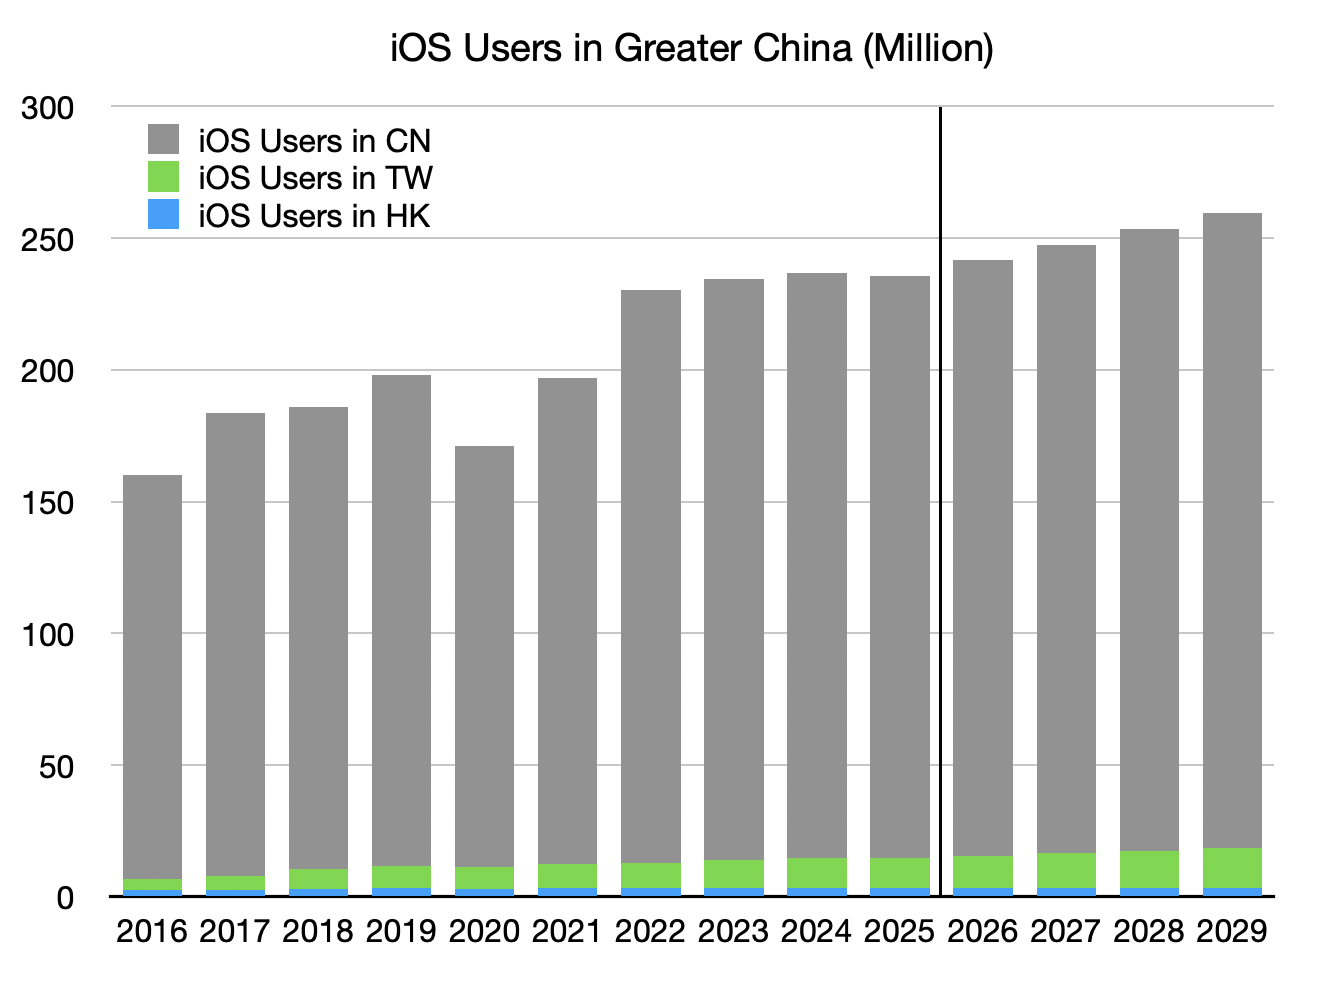
    Multiplying the share numbers by the user numbers, including projections gives the following iOS users summary.

    The 2025 total is about 236 million users. The forecast for 2029 is 260 million, an increase of roughly 24 to 25 million. This forecast however is an extrapolation of the growth in Taiwan and HK with mainland growth being quite flat historically. This is due to relatively low churn. I believe there is room to accelerate mainland growth.

    To understand the logic, here are some share numbers:

    • Apple has about 17% of the installed base of smartphones but 16% of population as users. Both have significant room to grow.
    • December quarter revenues per installed phone is $98.37/installed iPhone/quarter, well above global average of $88/installed iPhone/quarter signaling an opportunity to expand into lower price bands for share gains.
    • A 20% share of population is foreseeable which would result in a gain of 57 million users, 25 million of whom are expected to be gained outside Mainland. This would imply Mainland additional user potential at 32 million, or 8 million new users per year, not a huge feat out of 1 billion addressable users.

    This new projection implies the following GC market size for 2030:

    • 290 million Apple users (57 million new)
    • 320 million iPhones in use (62 million new)
    • 450 million Active Devices (88 million new)

    This is arguably "organic" growth without significant new product development or introductions.

    In future articles I'll expand on this forecast for all other reporting segments building to a regional level view of growth in active devices and users.

  5. Estimating 2035 iPhone Users

    Research

    Surveying multiple sources

    We have a firm hold on the number of active devices as well as the number of iPhones in use. This is due to Apple reporting the data. The latest active device count was 2.5 billion and the estimate for active iPhones is 1.6 billion.

    This patters also allows us to forecast the active base pretty accurately as the growth is predicted by the tight fitting linear approximation.

    For more confidence it would be useful to confirm these predictions with different estimates. For this I turned to two additional sources: the Statcounter GlobalStats measure of Mobile Operating System Market Shares Worldwide coupled with Number of Smartphone Users Worldwide (forecast by Ericsson) and the Number of of iPhone Users from Bankmycell.

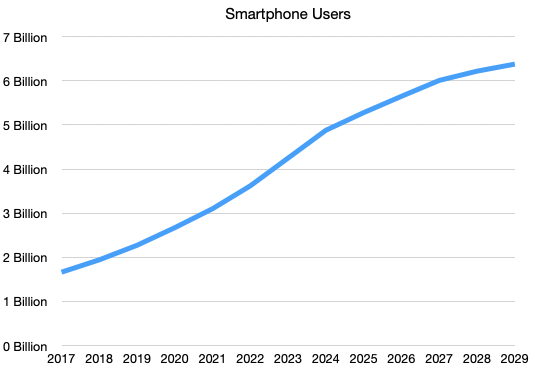
    The total Smartphone Users history and forecast is shown below:

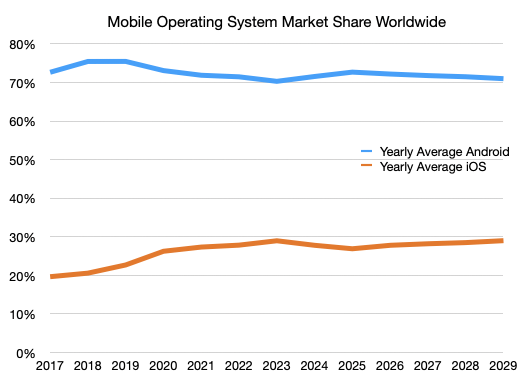
    The Mobile Operating System Market Share Worldwide is shown below:

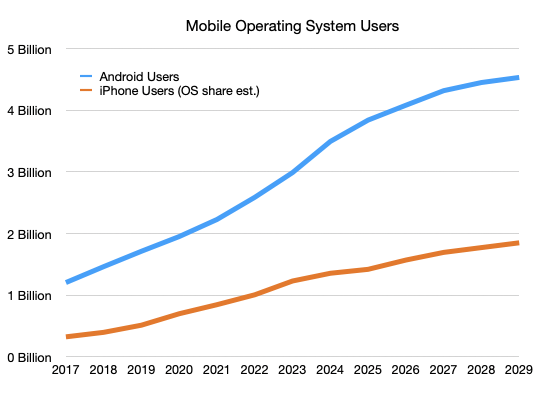
    Multiplying these two yields the Mobile Operating System Users

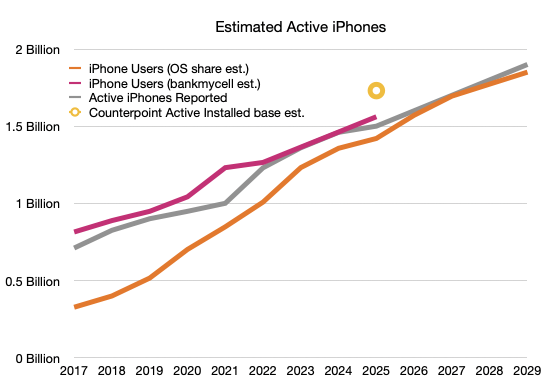
    The iOS users (orange line) can now be compared to Apple's own reported active device total (grey line) and the Bankmycell estimate as well as a derived estimate from Counterpoint (24% share of install base)

    The graph includes forecasts from 2025 to 2029.

    Discussion:

    The data shows fairly well during the 2025 year and the forecasts do seem to converge. The only puzzle is why the OS Share estimate is lower during the 2017 to 2023 period. The OS Share estimate is based on recording page views to 1.5 million member sites.

    For each page view, we analyse the browser/operating system/screen resolution used and we establish if the page view is from a mobile device. For our search engine stats, we analyze every page view referred by a search engine. We summarize all this data to get our Global Stats information.

    There might be more web traffic from Android devices for various reasons, including less app usage, more bot activity or other noise.

    Whatever the reason, the prospect for iOS users is confirmed: about 2 billion active iPhone by 2030 is entirely feasible. The fact that Android users might reach 4.5 billion by then is not necessarily a bad thing. It suggests both a saturation point and an expanded addressable market for iPhone. Given that headroom and the switching rate in mature markets points to a potential iOS audience and hence Apple user base in the 2.5 to 3 billion range by 2035.

    That, coupled with value captured per customer will determine the value of the firm.

  6. Apple in Europe: How many iPhone switchers are addressable in the near term?

    Research · 2 comments

    An update using operating system market share

    Apple's performance in China is often noted and scrutinized. During the last quarterly earnings call Amit Daryanani asked:

    ... the other second question I have for you is maybe just touch on the China strength you folks had. I think this is very close to all-time high revenues you have had in China. What is driving the strength over here?

    To which Tim Cook gave the following answer:

    Greater China was up 38% year on year. It was driven by iPhone, where we set an all-time revenue record. So it was the best iPhone quarter in history in Greater China. It is driven by the customer enthusiasm for the iPhone 17 lineup. And I would tell you that during the quarter, traffic in our stores in China grew by strong double digits year over year. It was a terrific quarter. Our installed base reached an all-time high in both Greater China and Mainland China. And we set an all-time record for the upgraders, and we saw strong double-digit growth on switchers.

    That's remarkable growth and every quarter we get this sort of discussion. But I don't recall ever there being a similar discussion about Europe. This is strange because, and the following graph shows, Europe is a bigger market for Apple than China.

    Europe also grew, and at 12.7%, grew faster than the Americas and faster than Japan.

    Regional Sales CQ420252024Growth 
    Americas58,52952,64811.2%
    Europe38,14633,86112.7%
    Greater China25,52618,51337.9%
    Japan9,4138,9874.7%
    Rest of Asia Pacific12,14210,29118.0%

    So why is Europe not discussed. Management does offer some mentions:

    iPhone saw strength around the world, reaching all-time revenue records in many of the markets we track, including The US, Greater China, Latin America, Western Europe, The Middle East, Australia, and South Asia, as well as a December record in India.

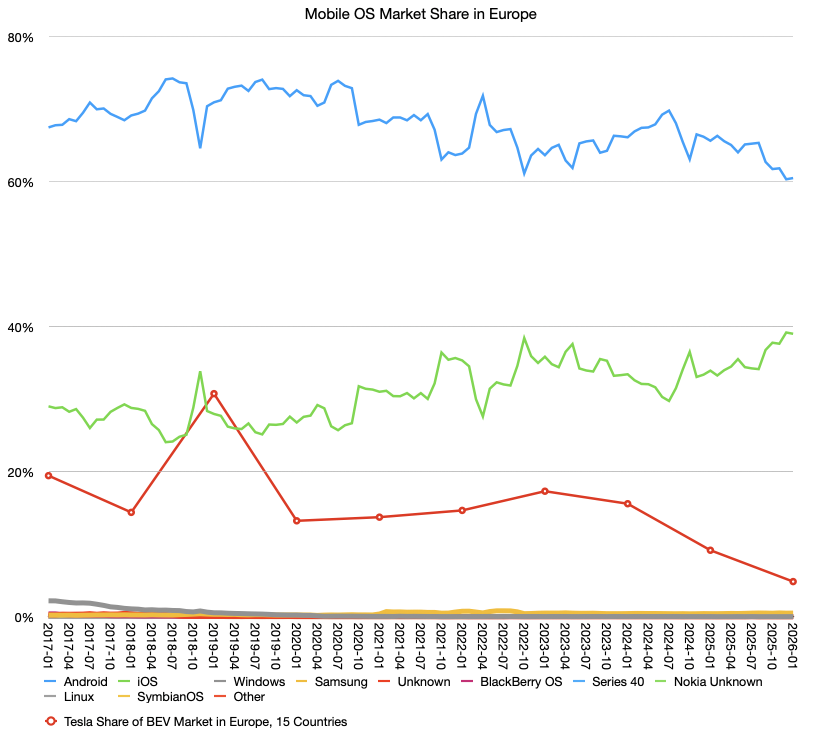
    Perhaps it's because Europe is considered a mature market, though surely China is not exactly emergent, with 114 phone numbers per 100 citizens (vs. 116/100 for the US). Even so, mature markets are still worth looking at. Though we don't have iPhone sales in Europe specifically, we can look at the usage profile of iOS as a proxy of iPhone market share. The following graph (via Statcounter) shows the mobile OS market share in Europe. The green line is iOS and the blue line is Android.

    Apple's share has increased significantly since 2018 when it was at 24%. In January of this year it's was at 39%. Correspondingly, Android fell from 74% to 60%. 15 percentage points is a significant share transfer.

    Europe, I might add, is an even bigger market than the US, with 459 million smartphone users vs. 300 million in the US, 329 million in North America. The opportunity to capture an additional 15% share there is equivalent to almost 70 million new users. The last 15% growth took 7 years so 70 million more in the next 7 would imply 10 million new users per year. That is a significant portion of the global pool

    NB: To contrast this growth, I've also added the market share of Tesla in the battery electric vehicle (BEV) market. Unlike Apple, Tesla is considered a dominant brand in the EV market and yet its market share is dramatically lower, and falling.

  7. Teen Survey Update: What happens when teens grow up?

    Research

    What's the role of fashion in tech choice?

    Apple's iPhone continues to be incredibly popular with U.S. teens, according to Piper Sandler's latest biannual teen survey. 88 percent of teens surveyed said that they own an ‌iPhone‌, and 88 percent said they intend to purchase an ‌iPhone‌ as their next device.

    Teen ‌iPhone‌ ownership numbers have increased three percent since April 2024, and are near record highs. The ‌iPhone‌ has long been the most popular smartphone among teens in the United States, and there has been steady growth in teen ownership. 10 years ago in April 2015, 66 percent of teens surveyed owned an ‌iPhone‌.

    Though teen interest in the ‌iPhone‌ is high, other Apple products and services are not as popular. Apple has not made inroads with Apple TV+, and it continues to trail Spotify as the most popular music service among teenagers.

    45 percent of teens surveyed have a paid Spotify subscription, while Apple Music is the second most popular streaming service with 30 percent of teens reporting an ‌Apple Music‌ subscription. Because Spotify has a free tier, it's still the most popular service overall, with 65 percent of teens using it. ‌Apple TV‌+ is not popular with teens, and less than one percent say they watch ‌Apple TV‌+ shows. Netflix and YouTube were most popular with 31 percent and 26 percent of teens reporting usage, respectively.

    Approximately 31 percent of teens own a virtual reality device, but most of those have an Oculus (25 percent). Just one percent of teens have an Apple Vision Pro, which is not a surprise given the price of Apple's device. Of teens that have a VR device, 60 percent said that they seldom use it, with just four percent reporting being a frequent daily user.

    Piper Sandler surveyed 6,455 teens across 43 states for the spring 2025 report.

    This data was collected in the spring of last year.

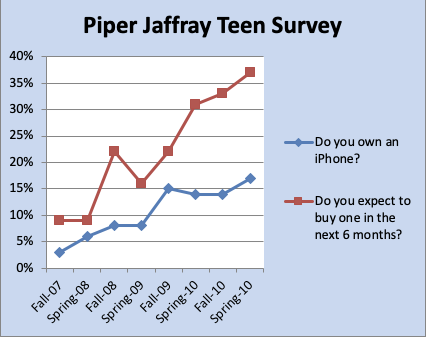
    I found the above in my archives. Ownership in 2010 was about 18%, 2015 it was 66% and 2025 it was 88%. The saturation at 88% (for both ownership and intent) was achieved relatively quickly but most importantly, it remains steady.

    Now consider that the teens of 2007 are having kids of their own. A 15 year old in 2007 is now 34 and a 19 year old is now 38 and some have a teen of their own.

    At 19 years, the iPhone brand has transitioned across one generation with not only resilience but with deeper entrenchment. This cannot be said for other contemporary technologies, e.g. social media. While elders use Facebook the young have moved on. Perhaps to Instagram (25-34, 76% 18-29) or perhaps to TikTok (16-24) which has the strongest position for younger, Gen Z users.

    Here are some additional data points on predisposition for social media:

    Facebook (25-49): Largest group is 25-34 (31.1%), but also high usage among 30-49 year olds.
    LinkedIn (30-49): Professional focus, ideal for B2B and adults 30-49.
    YouTube (18-64+): Broad, with the highest usage (93%) in the 18-29 bracket.
    Pinterest (30-49): Popular with older, female audiences.

    There is quite a lot of divergence and only YouTube seems to be fairly steady across age groups.

    Moreover, as the Piper Sandler survey suggests, Apple Services is not the same as the iPhone. The adoption of Music and TV are not a broad-based and that has a lot to do with disposable income. The mechanism for adoption should be the family plan whereby teens are automatically enrolled through their parents in to Music and TV+. After all, teen iPhones are likely purchased by parents. That services bundling is where Apple must focus its effort.

  8. When Will Apple Halve?

    Research · 1 comment

    So far it's down 44.4%

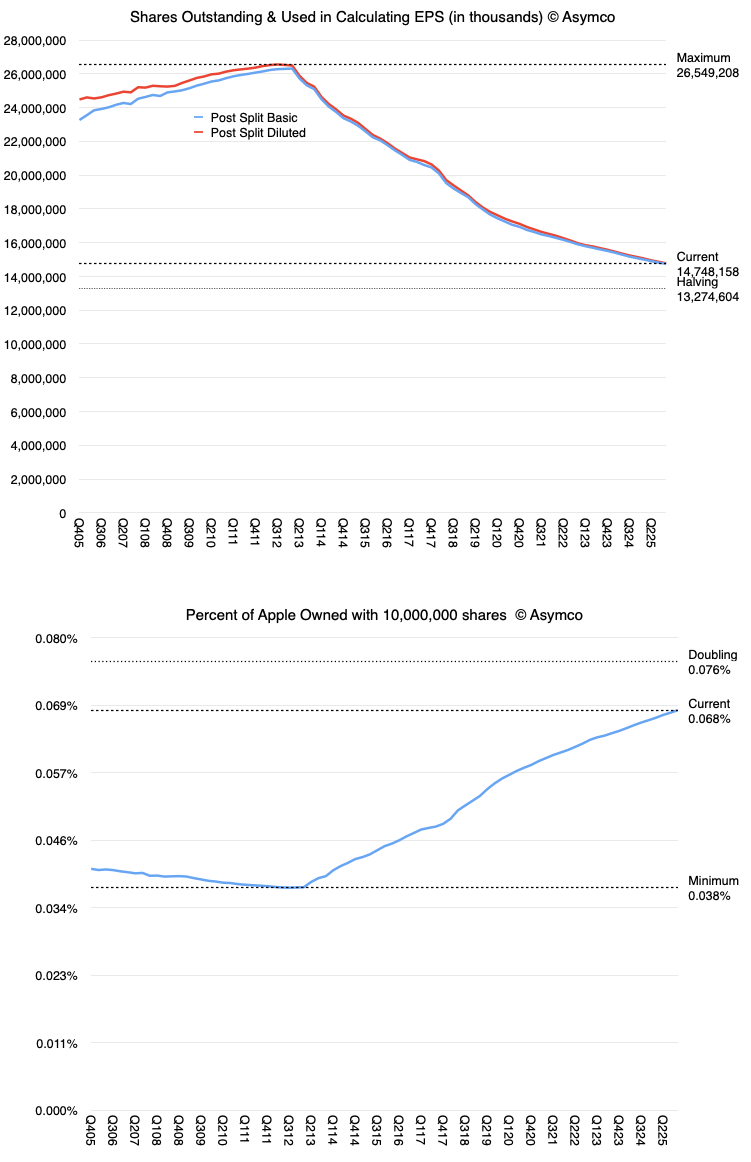
    The Apple share count peaked at 26,549,208,000 shares in the third quarter of 2012. Today there are about 14,748,158,000 shares outstanding. The history of the shares outstanding is shown below:

    Line graph showing shares outstanding and used in calculating EPS over time, with post-split basic and diluted data.

    Also shown in the second graph is the percent of the company owned by 10 million shares.

    I highlighted a point representing the "halving" point, which is what I call the number of shares necessary for a reduction by 50% from peak share count. The halving point is 13,274,604,000 shares. Today's share count represents a reduction of 44.4%, meaning that there is 5.6% to go. The challenge in predicting when this point will be reached is that the rate of retirement is variable.

    For instance during the last year 340,509,000 shares were retired. During 2024 the number was 425,776,000 and in 2023, 379,077,000. This variability is because whereas the company receives a "budget" in terms of capital to be returned via share repurchases every year, the choice of when to buy is up to management and the price at the time of purchase obviously varies greatly.

    Nota bene: By definition, share buybacks are insider trades as the buyer is an insider. But it is not illegal insider trading. The SEC has specific rules about procedures for share buy-backs that establish a safe-harbor for the company. While legal, they are restricted to pre-planned programs, we just don't know what these programs are.

    The rate of retirements therefore is dependent on the nature of the program, which is not public, and the price of the shares, which varies widely. Naturally, if the share price increases, the reduction in shares slows down. This is rather by design. If it did not happen then as the share count drops and price remains the same, then the shareholders don't benefit much from the value of the shares, though they may well benefit by other means.

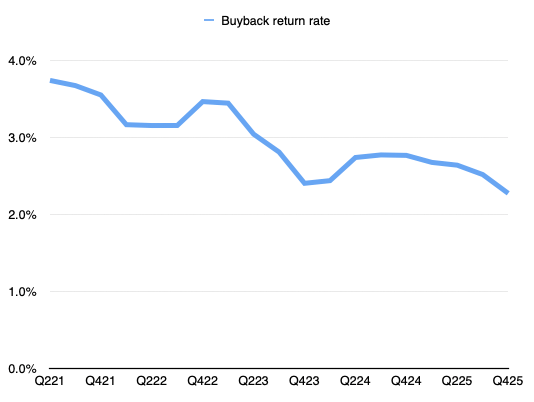
    For instance, from the investor's point of the concentration of shares has a "rate of return" which can be represented as a percent (trailing twelve months retirements as a percent of the total a year earlier). In other words, how quickly is one's position in the company concentrating. The following graph shows that rate.

    Line graph showing the buyback return rate over several quarters from Q221 to Q425, with values ranging from 0% to 4%.

    By this metric, with 5.6% remaining, the point of halving should arrive around the middle of 2029. Of course, if share prices rise rapidly, and Apple does not increase its capital return budget this halving point will need to be delayed.

  9. 1.7 Billion Customers

    Research

    Apple reached a new milestone

    We are proud to report that we have a new record for our installed base with more than 2.5 billion active devices. -Tim Cook

    2.5 billion active devices follows the announcement of 2.35 billion active devices a year ago, a growth of 150 million devices in one year. Let's examine some of the implications.

    By my estimate, Apple sold about 250 million iPhones, 23 million Macs, 40 million Watches, 70 million iPads. Other devices including Apple TVs, Apple Vision Pro, Apple HomePods may add another 10 million units. Therefore the total number of "connected" devices sold is around 400 million/yr.

    Adding 150 million to the active base in one year implies that 250 million devices are replacements, many surely are reused but also at least a third (37.5%) of units sold are expanding the base. This is reflected by management's occasional mention that "nearly (or, alternatively, over) half of customers who purchased a <product> being new to the product".

    In the last quarter and for quite some time, <product> has been the Mac, the iPad and Apple Watch. If we use my estimates of units sold during the full year that means 17 million Macs, 20 million Watches and 35 million iPads were sold to new users. These add up to 72 non-iPhone new devices in use. That suggests about 78 million new iPhone users.

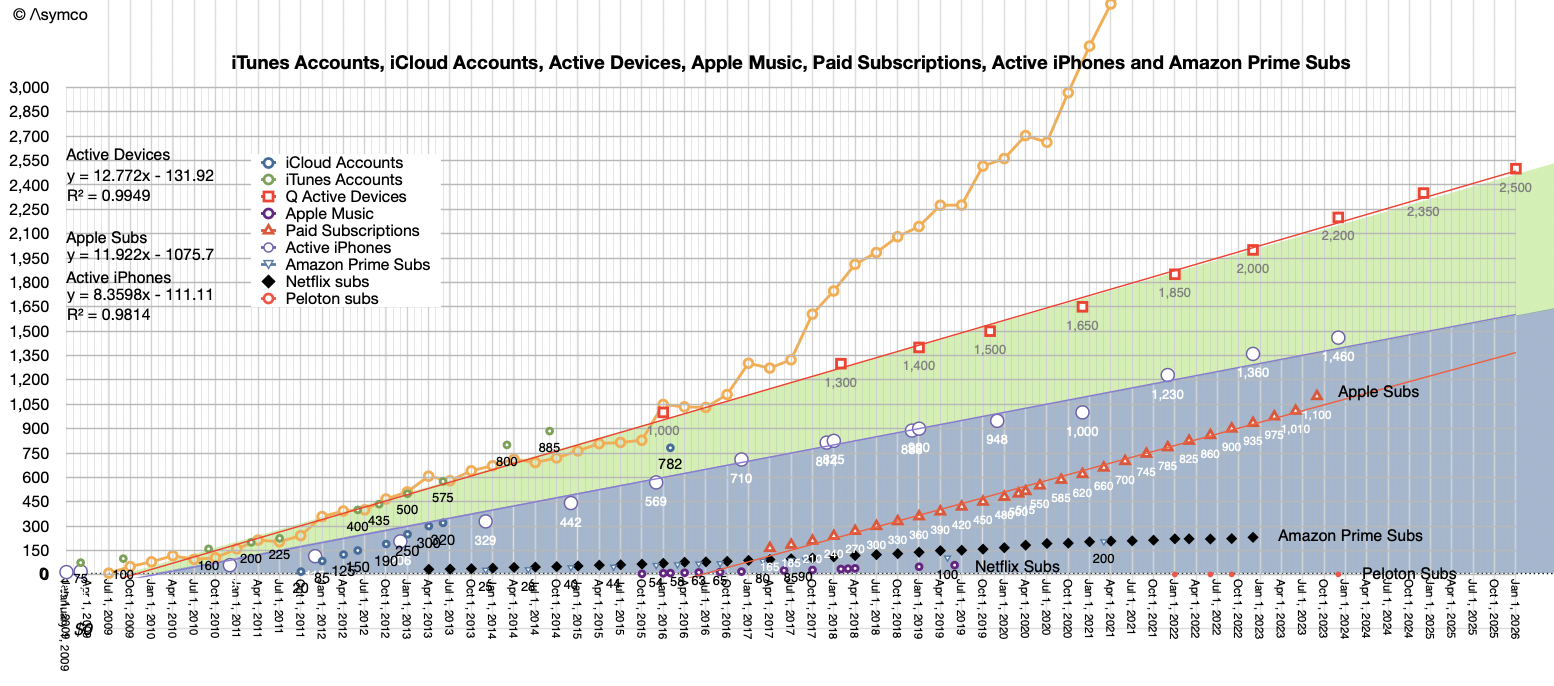
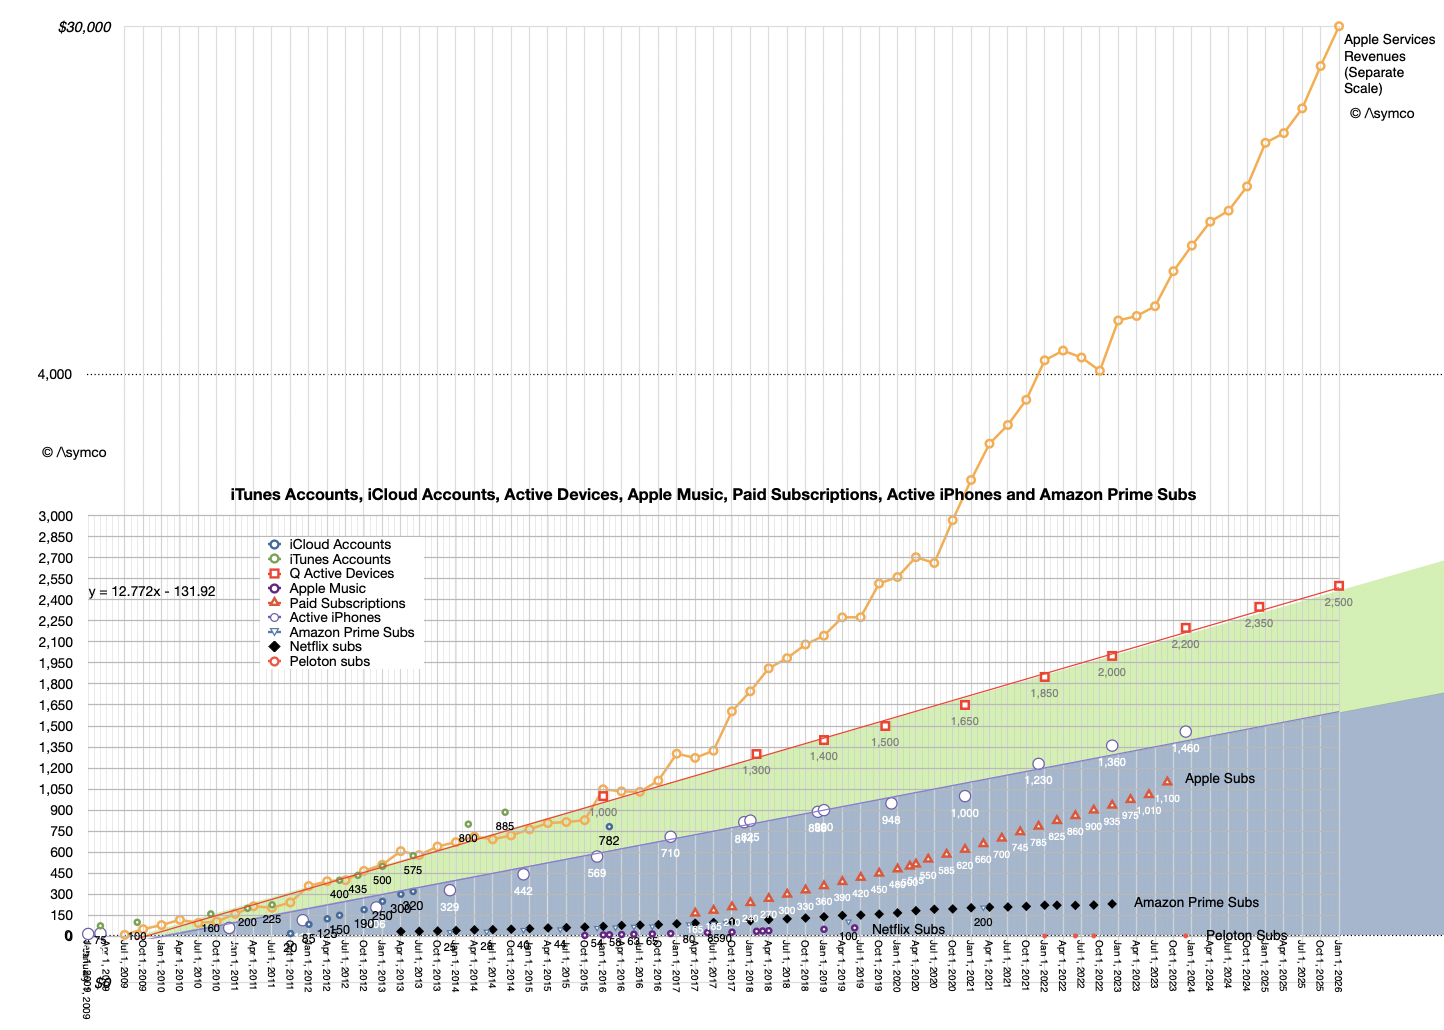
    How does this compare to the following pattern:

    A graph showing the growth of iTunes accounts, iCloud accounts, active devices, Apple Music, paid subscriptions, active iPhones, and Amazon Prime subscriptions over time, with trends highlighted for various services and revenue.

    The line to focus on is the red with square points. "Q Active Devices" is the history of what Apple calls "Quarterly Active" devices or those which ping an Apple server at least once a quarter. The data appears to be linear, or the growth is about 150 million per year at least since 2016. Historic data on the iPhone is also shown with a blue line. That is also consistent with about 100 million new iPhones in use every year. This is a bit higher than the 78 million bottom-up analysis of new users. I'd argue that Watch numbers may be a bit too high and perhaps iPad as well.

    The mix is a matter of debate but overall this consistency allows for some confident forecasting.

    • The iPhone will reach 1.7 billion active users by this time next year.
    • There will be three billion active devices by early 2029.
    • Services, which is shown in the second graph is clearly correlated to active device growth.
    • The consistency in active device growth is far more important than device sales in a particular period and determines the value of the company.

    Knowing this, here are some additional observations:

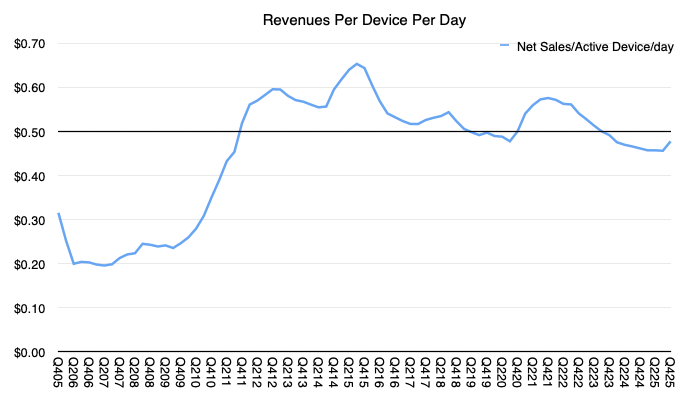
    Yearly revenues per active device are $129, services revenues per active device are $45 for a total revenue per active device at $174/device/yr. That is equivalent to 48c/device/day. Data shows that daily revenues have been an average of 53c/device/day for 59 quarters. My rule of thumb is 50c/day per active device is a good estimate for Apple's revenues, and estimate that I have been holding for over 14 years.

    Line graph showing revenues per device per day over time, with a blue line representing net sales per active device. The y-axis ranges from $0.00 to $0.70, while the x-axis denotes time periods from 09/09 to 04/25, illustrating fluctuations in daily revenues.

    There are additional implications. With a base of 1.65 billion iPhones, and knowledge of replacement vs. new-to-product/switcher growth what is their average lifespan and thus replacement rate and therefore what is the average selling price?

    This will be discussed in a future post.

  10. Margin Call

    Research

    While the commentariat assumes the worst, Apple delivers the best.

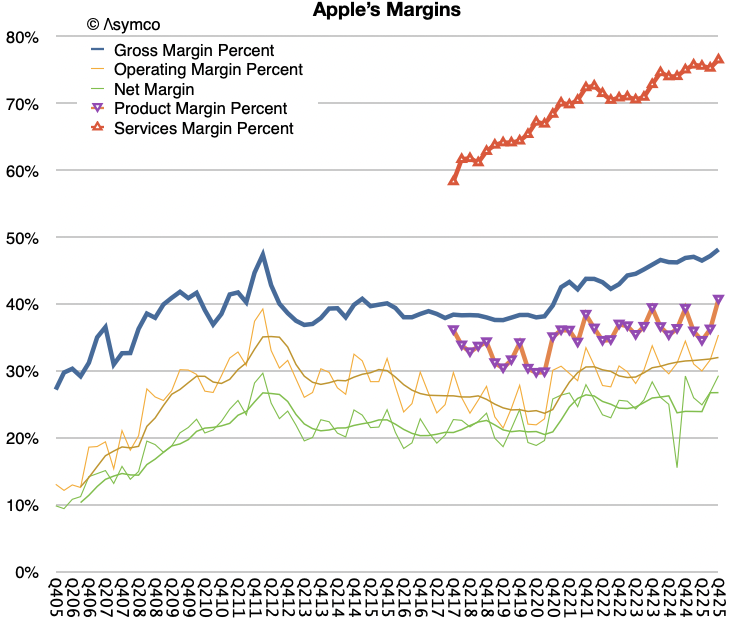
    Last quarter Apple delivered a gross margin of 48.2%. This was above the high end of their guidance range and up 100 basis points sequentially. Management commented that this was "driven by favorable mix and leverage."

    Further, products gross margin was 40.7%, up 450 basis points sequentially, driven by favorable mix and leverage. Services gross margin was 76.5%, up 120 basis points sequentially, driven by mix.

    This performance is even more astonishing considering the history shown below. Apple is quite simply, delivering at the highest gross and net margins in its history.

    Line graph depicting Apple's profit margins over time, including Gross Margin, Operating Margin, Net Margin, Product Margin, and Services Margin percentages, with data spanning from 2010 to 2023.

    Note that the graph actually projects forward one quarter because we have the following guidance: "We expect gross margin to be between 48-49%." The graph reflects the high end of this guidance range.

    So what's going on? Especially as a drumbeat of constant doom is being broadcast by pundits. The conference call itself seemed to be dedicated to margins. It became what I call the Margin Call.

    Amit Daryanani, the first questioning analyst, specifically kicked off with the following:

    "there is a lot of focus on the impact of memory to host the companies, and I would love to kind of get your perspective when you are first guiding gross margins up into March. Talk about, a, your comfort in securing the bit that you need for shipment and b, how do we think about memory inflation flowing through Apple's model over time?"

    Tim Cook answered:

    We are currently constrained, and at this point, it is difficult to predict when supply and demand will balance. The constraints that we have are driven by the availability of the advanced nodes that our SoCs are produced on. And at this time, we are seeing less flexibility in the supply chain than normal, partly because of our increased demand that I just spoke about. From a memory point of view, to answer your question, memory had a minimal impact on Q1. So the December gross margin. We do expect it to be a bit more of an impact on the Q2 gross margin, and that was comprehended in the outlook of 48 to 49% that Kevin gave earlier.

    what Apple is saying is that they are constrained by production of silicon but not of memory. They do see some impact in the future but that is included in a guidance of margin expansion.

    Analysts still could not believe this, the following exchange soon followed:

    Ben Reitzes: So the next question is on gross margin. I am pretty shocked I gotta hand it to you, Tim. I am, you know, that you are able to do 48 to 49. What is really going on there? How are you doing that with this memory, the NAND prices? Is it due to mix that there is a good less hardware and more services? Services and services margins are going up. How are you doing it to keep it at 48 to 49?

    Kevan Parekh: Yeah, Ben. This is Kevin. [] Let me start maybe by just reflecting on the Q1 gross margin. I think we talked about the fact that we landed at 48.2%, so just above the high end of the range we provided, [], on the last call. [] if you look at that performance, [], we were up 100 basis points sequentially. We talked about the fact that we had favorable mix. [], as you know, when we have a good product cycle, strong price cycle we are seeing for iPhone, that does lend itself to a bit more favorable opportunity on the [] leverage side.

    So we are having a strong iPhone cycle as Tim outlined. And so that also translates itself. So we talked about products sequentially went up by 450 basis points. So I think, in general, I think we are just seeing, [], favorable mix dynamics as well. [], service continues to contribute as well. That business is growing, [], double digits, so that also is a contributor. And I think that, [], if you looked at our guidance, [], we are providing a similar range to where we reported in December. There are going to be a few puts and takes. [], we do expect to see favorable mix in the services.

    As you know, when we move from Q1 to Q2, that tends to be the case, and that is partly offset by a seasonal loss leverage. So there will be puts and takes, but again, we feel pretty good about the guide of 48 to 49%, which is similar to the range we reported in December.

    Still not enough. Two more questions followed on margin. I will quote one here.

    Aaron Rakers: Yep. And then as a quick follow-up, you know, kind of tied to memory, maybe not so much, but part of this current generation iPhone cycle is you clearly deepened some of your own internal silicon capabilities on the device. I am curious if that if we should think about that as a lever and maybe a supportive factor to gross margin that might be underappreciated and any thoughts on where we go from here as far as continual opportunities of internalizing your own silicon? Thank you.

    Timothy D. Cook: Yeah. I will let Kevin talk about the gross margin. But in terms of the product, which is at the heart of what we think about in the user, Apple silicon has just been an incredible game changer for us. Starting with iPhone and then on iPad and, of course, the Mac as of a few years ago. And so we believe it is a game changer and a major advantage.

    Kevan Parekh: Yeah. And as far as impact on gross margin, yeah, we have been, as you know, investing in core technologies like our own silicon and our own modem. And certainly, while those do provide opportunities for cost savings and can be plugged in margins, they also importantly provide, [], the differentiation that is really important for our products as well and us more control of our roadmap. So I think there is a lot of strategic value to it, but also we are seeing, [], investments in our core technologies impacting, [], gross margin in a positive way.

    After all this, the financial commentariat continues to assume that Apple will be hit with margin pressure from memory and that has presumably been affecting the share price since the call.

    Well, we've seen all this before. Before the great memory crisis Apple was going to be constrained by tariffs, by China, by developer dissatisfaction, by AI, by regulators, etc.

    The feeling one gets is that Apple is always navigating through a minefield of pitfalls and gotchas. The opposite is true. It's highly likely that Apple has sufficient leverage which increases its access to supply and that everyone is keen to work with the company. Leverage comes from scale, from lead time, from vertical integration and from engineering. Management is saying as much. Indeed, the evidence of leverage across the supply chain and over the entire ecosystem and economy is evident in its margin expansion story told in the graph above.

  11. Review of Predictions for Apple's Biggest Quarter Ever & Estimates for the Next Quarter

    Research

    Shocking over-performance.

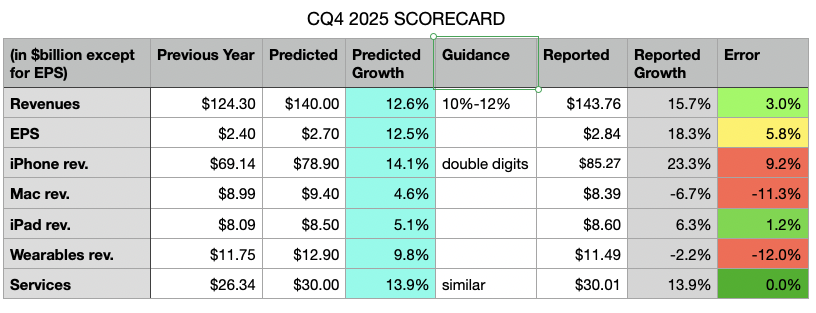
    On January 23rd, I provided the following estimates for the quarter:

    Table showing CQ4 2025 scorecard with financial metrics including revenues, EPS, predicted and reported growth rates across various categories such as iPhone revenue, Mac revenue, iPad revenue, wearables, and services.

    My predicted growth is in the light blue column, the reported growth is in the grey column and my errors are in the last column. Also included is the guidance from the previous quarter's conference call.

    The table shows my errors were primarily in underestimating iPhone, while over-estimating Mac and Wearables. The errors mostly cancelled each other out on the top line (off by 3 percentage points) but, due to an underestimation of the gross margin led to a bottom line error of 5.8 percentage points.

    The Mac overestimation was based on not paying enough attention to the comparable from the year earlier. I was warned: "On Mac, keep in mind, we expect to face a very difficult compare against the M4 MacBook Pro, Mac Mini and iMac launches in the year ago quarter". Wearables are similarly underperforming due to lack of new product launches.

    But the iPhone underestimation is simply because the new products are a massive hit. Nobody predicted this level of performance. Indeed Apple was caught by surprise and has been unable to meet demand. They are still going to be below supply/demand balance going well into the first quarter of 2026.

    Finally, an error on the margin came from Apple's continuing over-performance on supply chain management.

    Apple is providing the following guidance [my emphasis]:

    We expect our March total company revenue to grow by 13% to 16% year over year, which comprehends our best estimates of constrained iPhone supply during the quarter.

    We expect services revenue to grow at a year-over-year rate similar to what we reported in December. We expect gross margin to be between 48-49%. We expect operating expenses to be between $18.4 billion and $18.7 billion, which is at a similar level to what we reported in December and driven by higher R&D on a year-over-year basis. We expect OI&E to be around $100 million, excluding any potential impact from the mark-to-market of minority investments, and our tax rate to be around 17.5%.

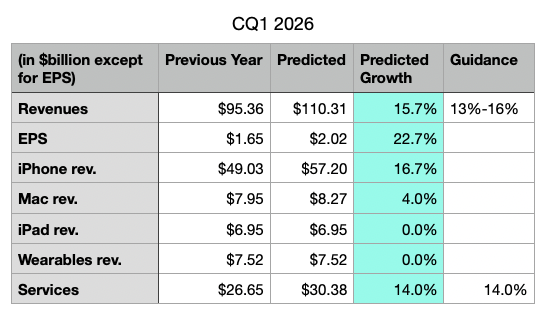
    Based on provided guidance, I'm making the following predictions for the next quarter:

    Table showing financial predictions for CQ1 2026, including revenues, EPS, and product revenue forecasts.

    It's vey important to note that Apple is guiding gross margin to be between 48-49%, a record high and something that we will discuss in the next post. This results in a 22% to 23% EPS growth rate!

    Note also that Apple guided revenue growth between 10% and 12% and delivered 12.6%. They guided grass margins between 47% and 48% and delivered 48.2%. It's highly probable that their top-of-the-range guidance will also be exceeded slightly and that my current estimates are therefore modest. [NB: the guidance is being put forward at the end of the first month of the quarter therefore the company already has booked one third of the quarter and has very clear visibility into the next third.]