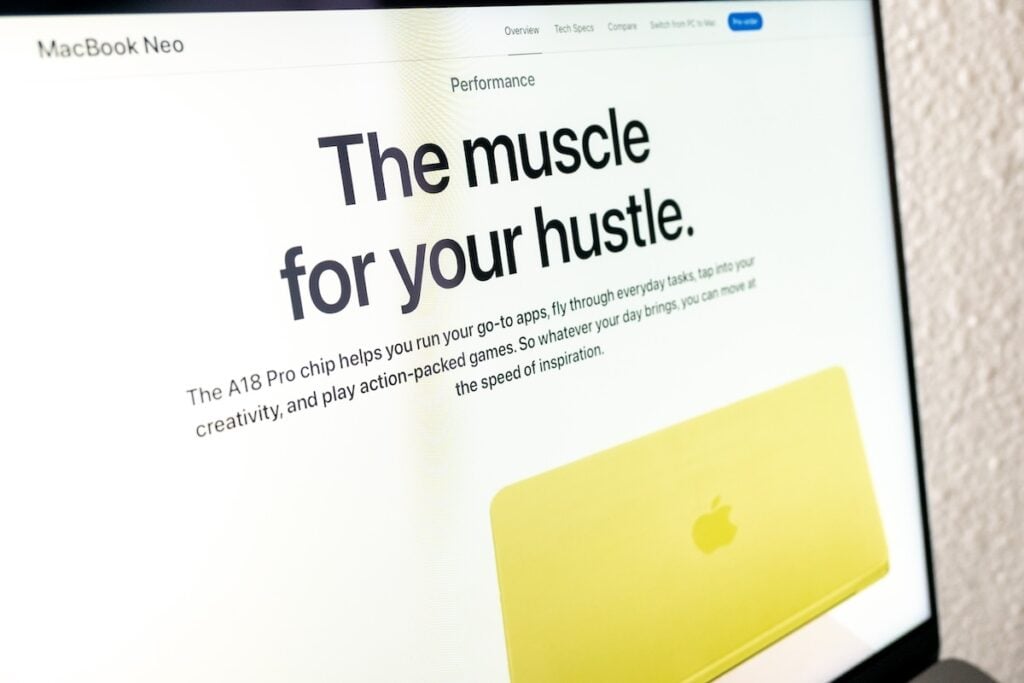
If it wasn't for the MacBook Neo the fall would have been much worse.
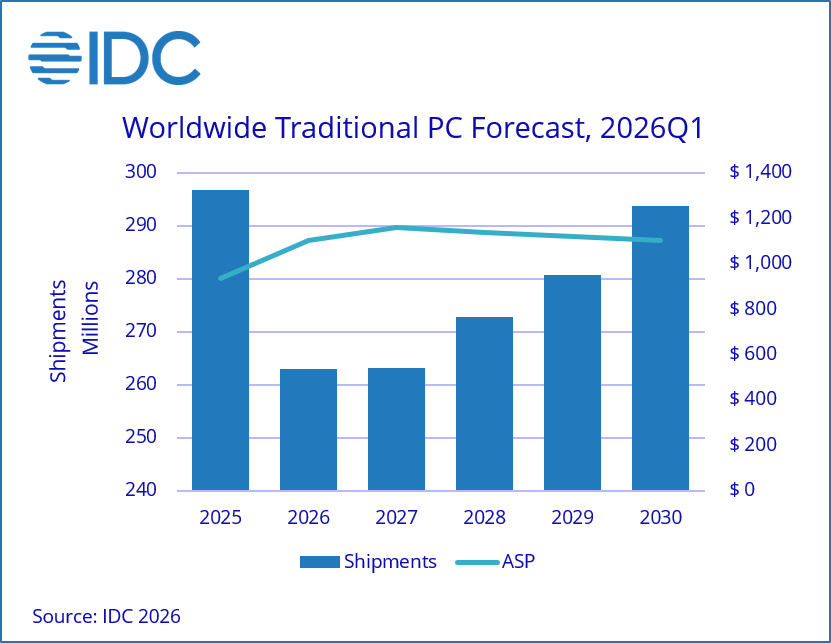
IDC now forecasts global PC shipments will decline 11.3% for the full year, with conditions worsening progressively through Q4, when shipments are expected to fall 20% year-over-year.
Pull-forward demand masked the problem, temporarily
The first quarter of 2026 offered a deceptively encouraging signal, with shipments growing 3% versus the same period last year. But that strength was largely borrowed from the future. Buyers, both consumer and commercial, accelerated purchases ahead of anticipated price hikes and product availability constraints.
Pull-forward demand masked the problem, temporarily
“The anticipation of rising prices and of limited availability of some system configurations due to memory and other component shortages has led some end-users to make purchases earlier than anticipated,” said Jean Philippe Bouchard, Vice President of Devices and Consumers at IDC. “We’re not seeing any relief to the memory shortage situation before the end of 2027, which means prices will continue to rise and PC manufacturers will struggle to maintain full product portfolios for the foreseeable future.”
One notable wildcard is Apple’s MacBook Neo, which has driven stronger-than-expected notebook demand and prompted IDC to revise its notebook forecast upward.
NB: The problem is a memory shortage: PC manufacturers are struggling to maintain product portfolios.
“The introduction of the MacBook Neo is putting real pressure on the entire PC ecosystem,” said Jitesh Ubrani, research manager for IDC’s Consumer Devices Trackers. “We expect vendors to respond with a combination of new silicon, a more efficient OS from Microsoft, and aggressive promotional pricing.”
“The competitive pressure from the Neo is providing a partial offset to broader price increases, keeping some low-cost notebook options alive. But the overall trajectory for average selling prices (ASPs) is firmly upward. IDC forecasts ASP growth of 17% in 2026, and even as memory capacity expands over the next two years, pricing is unlikely to return to 2025 levels,” Ubrani added.
As the graph shows, IDC forecasts no recovery in volumes until after 2030. This is a multi-year opportunity for Apple and may reset market share dynamics permanently.
AI-driven memory shortage continues to hammer sales; Android sales to drop 20%
According to analysis firm IDC, smartphone shipments are headed for a 13.9% decline in 2026, a downward revision from the 12.9% decline IDC had anticipated for the year in February. It would also mark the steepest drop in smartphone history, the company said.
“these pressures are compelling vendors to reduce shipments, raise prices and concentrate on higher price tiers — elevating smartphone [average selling price] to a record $550, up $100 from last year,” IDC senior research director Nabila Popal said in a statement.
“2026 will be a defining year for the industry as [a] new reality of structurally higher costs take hold,” she added. “For consumers, it means the era of ultra-cheap smartphones is over. For vendors, it means only those that can adapt their strategies to this new cost environment and sustain demand at elevated price points will survive.
The broader Android smartphone market is set to take the biggest hit, with IDC projecting a 20% year-over-year drop in shipments. Despite that, Samsung is expected to increase its market share in the space at the expense of smaller smartphone companies thanks to its midrange and premium device lineups.
Apple, the research firm said, is also expected to perform relatively well, with shipments forecast to fall 5.2% on the year, an improvement from a previously anticipated decline of 8.1%.
In its most recent earnings report, Apple announced iPhone revenue growth of 20% for the second consecutive quarter, thanks to its strong iPhone 17 lineup and improved sales out of China.
But CEO Tim Cook also warned of supply constraints due to both the memory shortage and the dearth of iPhone processors.
NB: I would add that Apple also announced that revenues for June quarter would increase at the same rate as they did for March quarter, thus for at least half the year the company will achieve 20% growth in iPhone sales. This is in sharp contrast to both what IDC and Omdia have been reporting.
Market contraction expected for second half of year.
Omdia reports that Europe (ex. Russia) smartphone market grew 2% to 33 million units in 1Q26.
Key vendor highlights from 1Q26 include
Samsung was Europe’s largest vendor as it grew 3% to 12.6 million units. Effective discounting of the Galaxy A16 4G helped Samsung boost volume, offsetting declines related to the delayed launch of the Galaxy S26, A57 and A37.
Apple grew 9% to 8.8 million iPhones, driven by robust iPhone 17 series demand in addition to benefiting from a wider mid-range coverage from the iPhone 15 and iPhone 16e. Noticeably, Apple’s strong results came despite lower and fewer discounts than in previous years.
Xiaomi retained third place despite declining 15% to 4.5 million units, as it was more immediately impacted by supply-side difficulties. However, Xiaomi’s ASP grew 21% compared with 1Q25, boosted by a record-strong Xiaomi 17 and 15T series performance, which drove year-on-year value growth despite the shipment decline. Premium sales were particularly strong in France, Germany, and Spain.
Motorola grew 17% to 1.9 million units, driven by rapid expansion in Spain and Portugal, alongside continued progress in France and Italy.
OPPO grew 9% to 1.3 million units, largely driven by its comeback in France alongside growth in Romania and Poland. With both realme and OnePlus now under its umbrella, OPPO is restructuring to optimize its portfolio and strategy with ambitions to strengthen its European position.
HONOR, ranking sixth, was the fastest-growing vendor among the largest players, with shipments increasing more than 60% compared to 1Q25. HONOR’s growth is underpinned by its portfolio being expanded further down the price-tiers.
"The average-selling-price (ASP) of smartphones in Europe surged to a record-high level of €580 in 1Q26," added Bjorhovde. "This was largely caused by lower availability of devices costing less than €200, which made up an all-time low of just 25% of shipments. Additionally, the high-end remained resilient thanks to Apple’s growth. The focus from both vendors and channel partners has shifted from volume to value to deliver results and operational sustainability. Many vendors who normally focus on the mass market segments are increasingly concentrating on the mid-to-high-end, hoping to benefit from less price-sensitive and upgrade-willing buyers."
[My emphasis]
"The first quarter of 2026 delivered beyond expectations, but the outlook remains bearish as the rapidly escalating memory bottleneck worsens," commented Bjorhovde. "Omdia forecasts shipments into Europe to decline 12% in 2026, but the majority of this will come in the second half of the year.
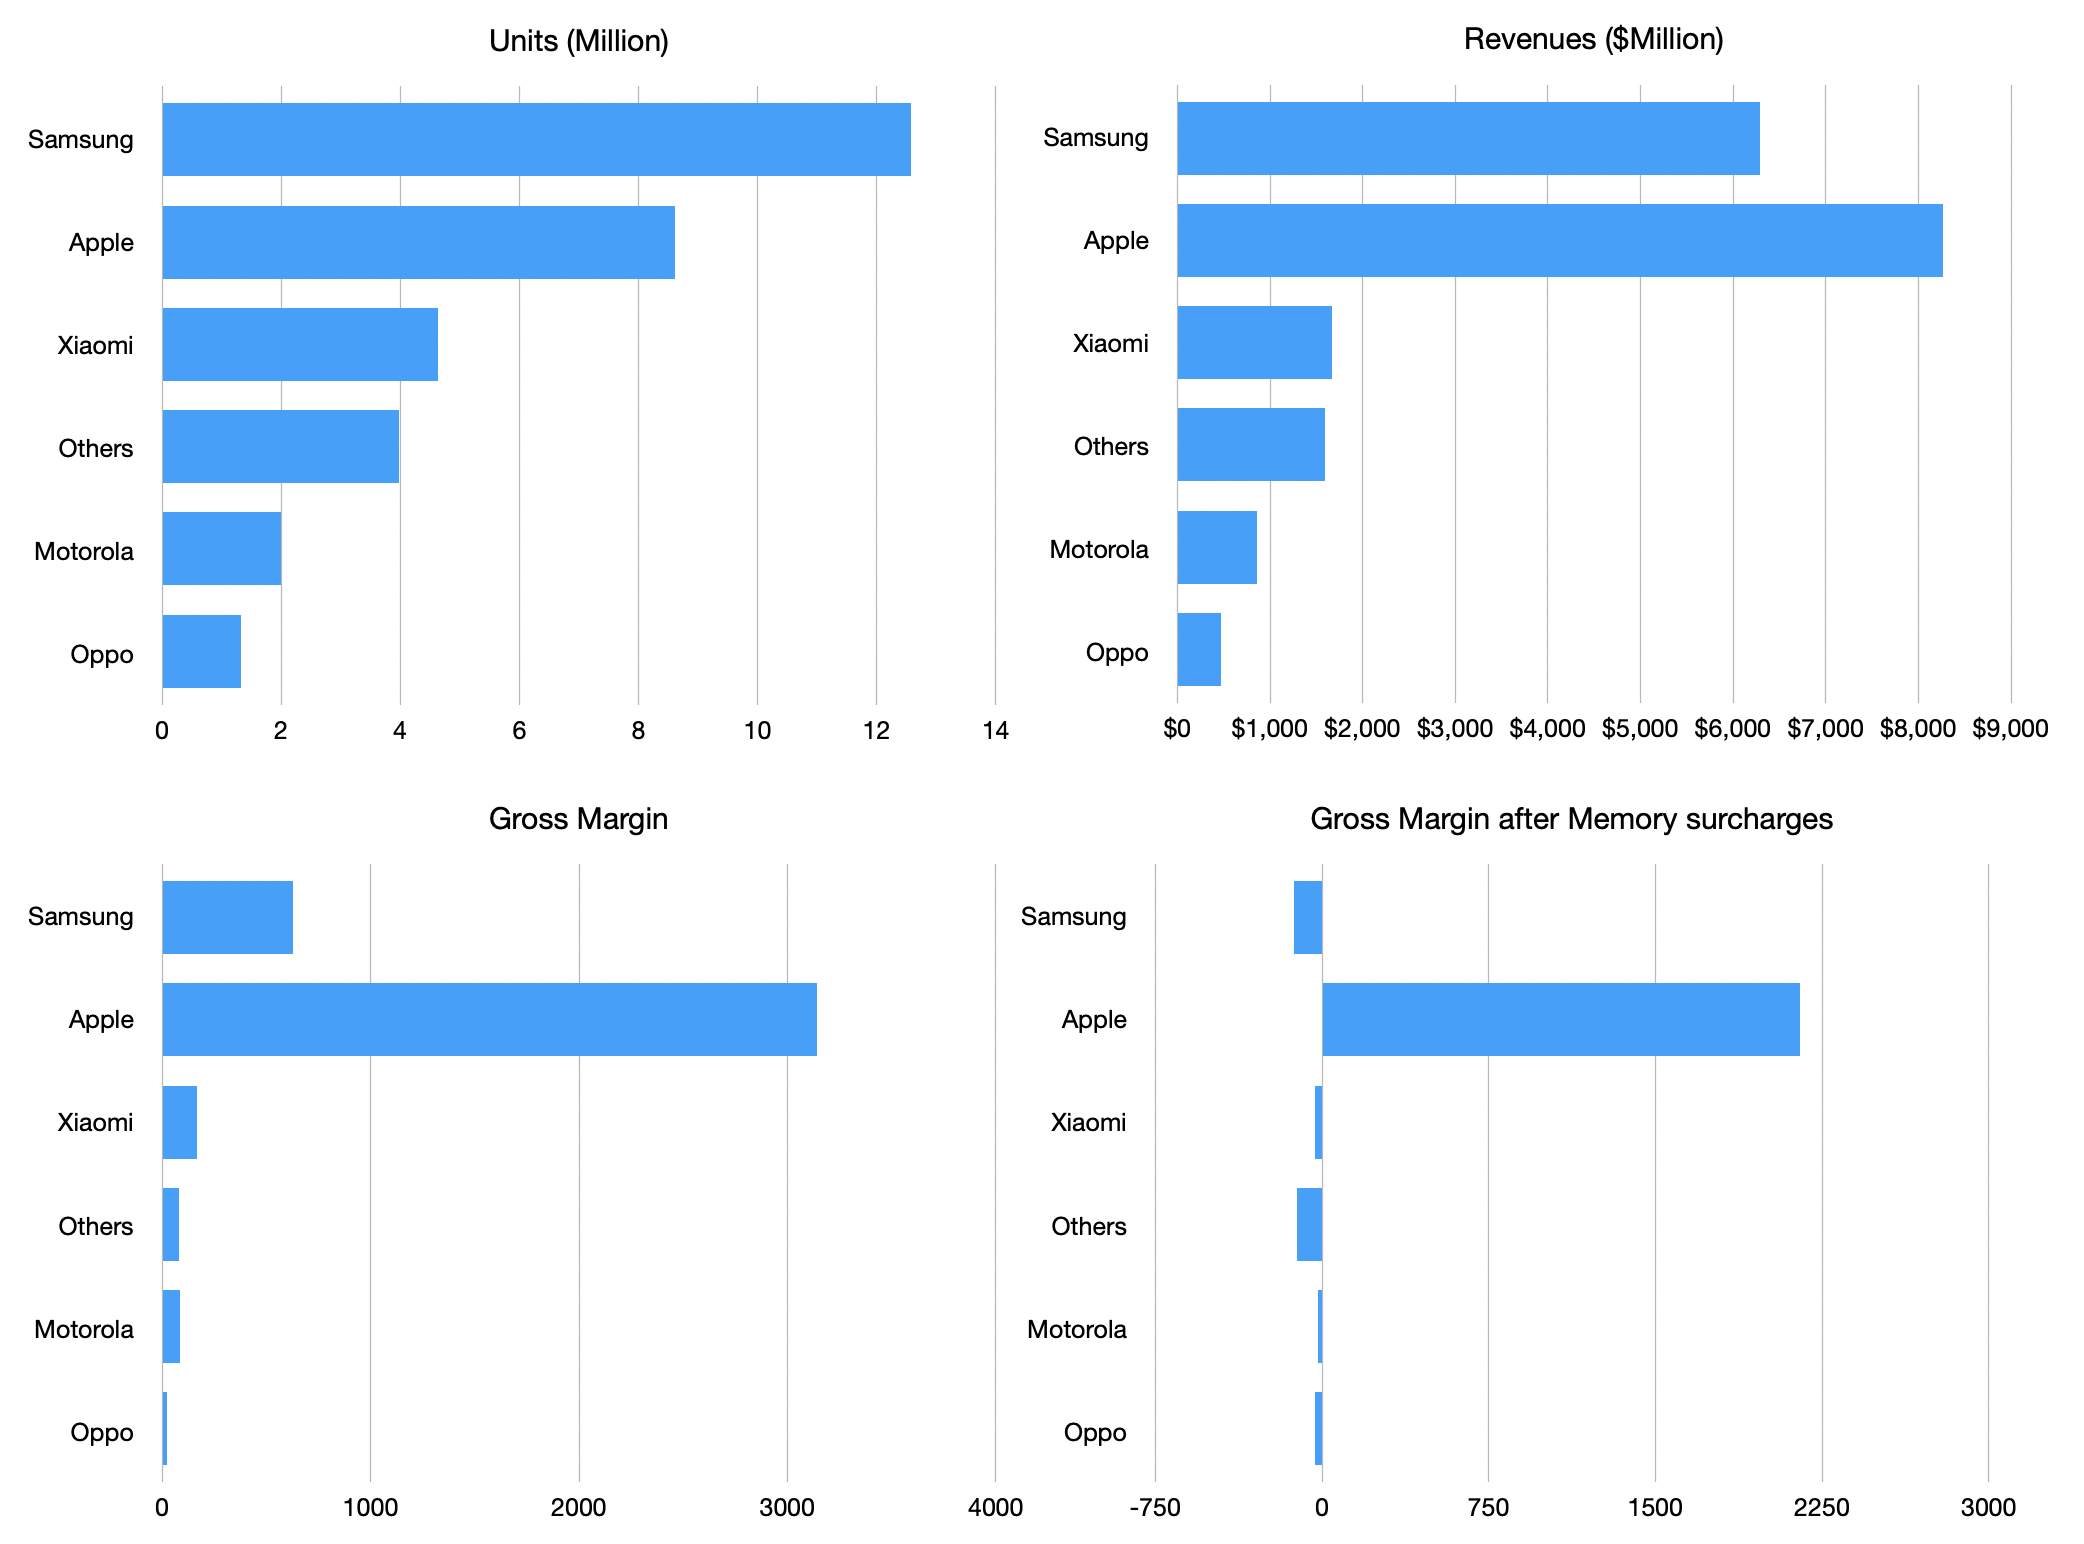
Applying average pricing per vendor and average gross margins gives the following picture of the market:
Apple currently captures 26% of unit volume, 43% of ...
Fundamentals are breaking; Profits evaporate; Competitors flee; Android logic questioned
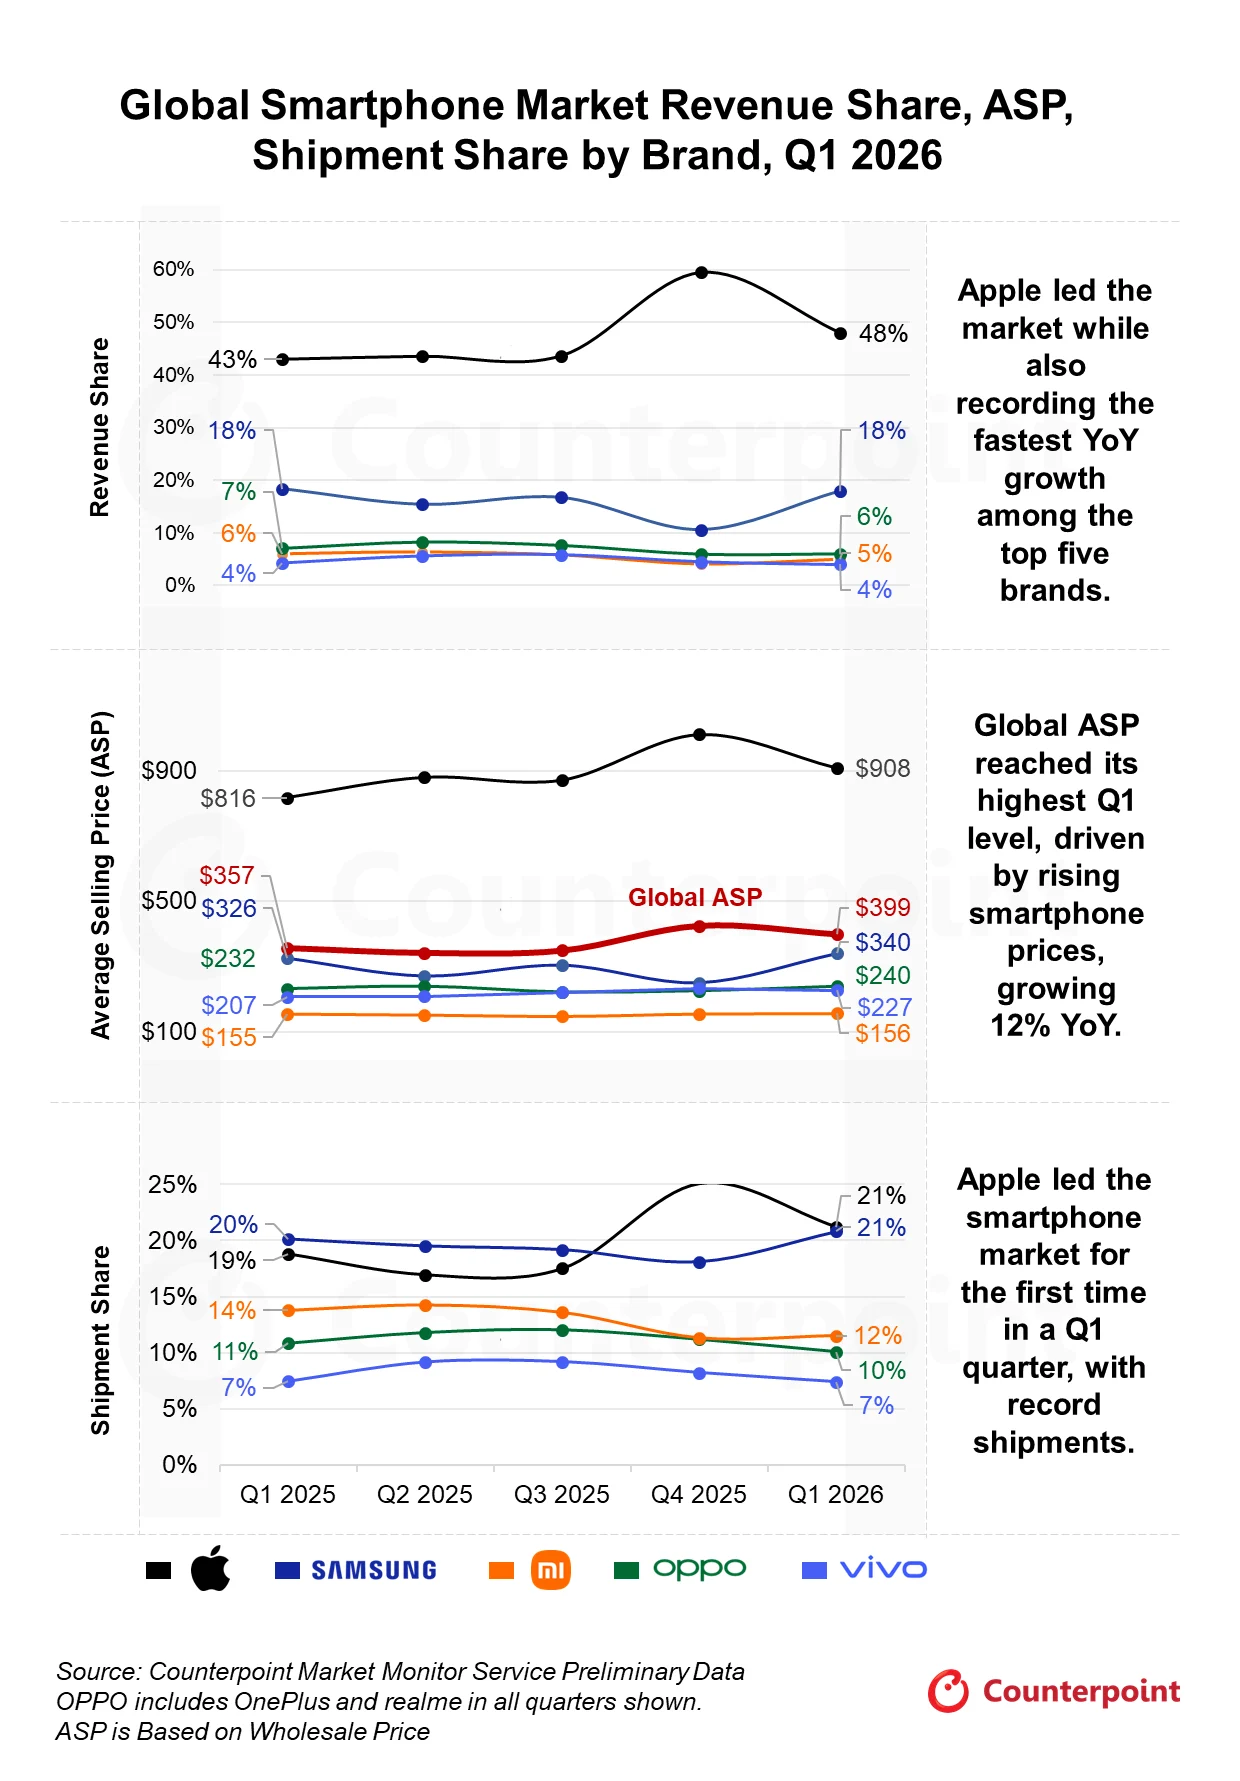
Apple’s revenue climbed 22% YoY in Q1 2026, registering the fastest growth among the top five smartphone brands while also hitting a first-quarter record high. Furthermore, the brand led the global smartphone market in terms of shipments for the first time in a first quarter, capturing a 21% share.
Commenting on Apple’s performance, Research Director Jeff Fieldhack said, “Apple’s growth was driven by sustained demand for the base iPhone 17 and iPhone 17 Pro Max, with a stronger mix of these models lifting Apple’s overall ASP by 11% YoY.
Unlike its peers, Apple mostly maintained stable pricing despite rising BOM costs, reflecting its ability to absorb cost pressures and remain insulated from the memory crisis, which helped strengthen its competitive position during the quarter. Regionally, Apple saw broad-based strength, especially across the Asia-Pacific region, driven by subsidies, promotions, and trade-in offers.”
The global smartphone market’s revenue grew 8% YoY in Q1 2026, driven by strong premium demand and pricing adjustments across major OEM portfolios amid rising Bill of Materials.
The average selling price (ASP) climbed 12% YoY to reach $399, supported by contraction in entry-level segments and price hikes across regions.
Apple led the global smartphone market in terms of value, recording its highest-ever first quarter revenue. Apple was the fastest growing brand with revenue up 22% YoY supported by relatively stable pricing compared to peers, despite broad-based price increases across the industry.
Samsung held an 18% revenue share in Q1 2026, with shipments reaching 21% of the total market, supported by portfolio optimization and strong response for the Galaxy S26 series.
The global smartphone market is expected to remain under pressure through 2026, and a substantial recovery is expected only in late 2027.
NB: The average sales price is up to $399 but Apple, with the largest share and fastest growth, reached $908? There's a lot more that does not make sense.
The global smartphone market is facing structural pressure from rising memory prices. In particular, the spread of AI technology is sharply increasing demand for high-performance memory, tightening supply and pushing prices up quickly. As a result, some Android manufacturers have raised prices on new products, and low-margin budget models could shrink in the market. The industry also sees the trend as potentially leading to a contraction in the overall Android market size.
Against this backdrop, Apple has chosen a strategy of keeping prices for its main models unchanged. Pu’s analysis said the iPhone 18 Pro is likely to start at $1,099 and the Pro Max at $1,199, maintaining the existing price range. That would be the same as the previous model. It is interpreted as a strategy to secure price competitiveness even if Apple accepts some margin decline to defend market share.
Apple is also expected to pursue a two-track strategy that considers both price accessibility and profitability. It would keep base-model prices to lower the barrier to entry, while raising prices for higher-end models with larger storage capacity to offset profits. It has also been suggested that an ultra-premium iPhone 18 Ultra could be added, and the overall average selling price (ASP) is expected to rise.
Ultimately, Apple’s strategy aims to exploit weaknesses in the Android camp, which is under pressure to raise prices. While rivals face demand contraction from higher prices, Apple could keep prices relatively stable and expand user inflows. A recent rise in demand from Android users switching to iPhones has also been detected, raising the likelihood that Apple will strengthen its influence in the premium market through this strategy.
Apple’s iPhone continued strong sales last month, thanks to the popularity of the iPhone 17 line, Bernstein analysts wrote in an investor note on Monday.
According to the report, global iPhone sell-through increased 26% year over year in February. Overall, the analysts say iPhone 17 unit sales are up 20% versus last year’s iPhone 16 through September and January.
The base model iPhone 17 accounted for 39% of that growth, while the iPhone 17 Pro Max made up 21% of the increase.
Average selling price, or ASP, also climbed in February, growing 6.9% year over year. So far, ASP has improved each month since the iPhone 17 launched in September, with the exception of October, Bernstein said.
The analysts said China provided the biggest boost to ASP, with growth of 20.2% year over year.
Francisco Jeronimo, Vice President of Client Devices at IDC, told Benzinga, "The MacBook Neo will have a significant impact on the low-end PC segment, particularly in education, which accounts for 6.7% of global PC shipments, or 13.4 million units in 2025."
He said that the market is currently dominated by Windows notebooks, with an average selling price of $682 and Chromebooks, which average at $362.
"Apple's ASP in Education was $1,425 in 2025 and accounted for only 5% of the segment," he said.
He echoed the statements by the above analysts while adding that MacBook Neo will allow Apple to acquire users early in their digital lives.
"Omdia’s February 2026 forecast shows Windows OEMs facing component cost increases of $90 to $165 per unit, pushing average notebook selling prices from approximately $850 toward $915," the research firm stated.
It went on to say that to maintain margins after these cost increases, many Windows laptops would need to be priced above $1,000 to "stay profitable."
On the other hand, Apple benefits from higher margins, making it easier for the iPhone-maker to sell the product at low-cost while still maintaining profitability.
In the education segment, the $499 price for students removes the cost barrier. However, the firm noted that the price isn't the only hurdle.
"Displacing Chrome in K-12 would require Apple to match Google’s admin tooling and institutional relationships, not just its price point," Canalys stated.
David Naranjo, associate director at Counterpoint, told Benzinga that Apple's real opportunity lies in higher education.
It is because the launch comes when Google continues to dominate the K-12 sector through Chromebooks, Google Workspace and school-managed devices.
"The MacBook Neo is unlikely to displace Chromebooks at scale in the K-12 market in the near term. Schools remain highly price-sensitive and deeply integrated into the Google ecosystem," Naranjo stated.
Almost 10 years ago I said "Managing the Mac product line must be one of the most challenging problems at Apple. That may not be obvious given the product’s success." I pointed out that although the company grew the Mac into a redeemed and prosperous platform, "The big change in computing has not been a growing Mac vs. declining PC. It has been a huge surge in mobile device use vs. a decline in PC use overall."
It's time to revisit this observation.
First, a status update:
The Mac is in its 32 42nd year of market presence. A longevity that is (still) unmatched by any other PC maker.
Apple reached a top five four position in the ranking of PC vendors. This was achieved far along in the evolution of the market.
With about $23 $33 billion in revenues per year, Apple places among the top four three PC vendors in terms of revenue.
With an estimated $5.5 $13.8 billion in operating margin Apple is the most profitable PC vendor, capturing over 60% of the available PC hardware profits.
The product has retained an average selling price of over $1200 ($1400 last year) for at least a decade. At the same time the average pricing of Personal Computers has more than halved.
Volumes increased by about 20% over a decade.
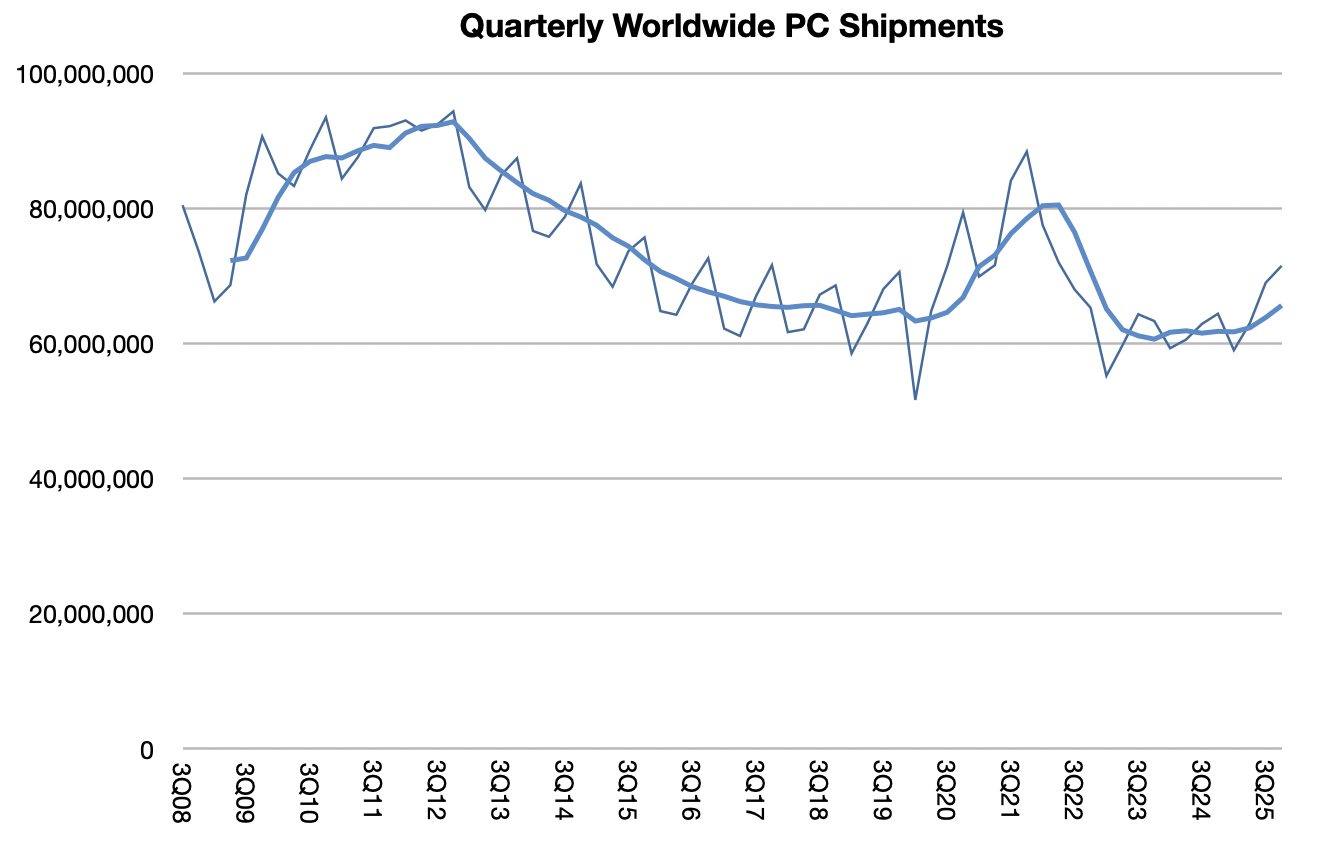
The overall picture of the market is shown the following graphs. First, the overall quarterly shipments.
Note the Covid-era surge during 2020 and 2021 but overall decline from peak in 2012. Yearly shipments were 262 million in 2025 vs. 371 million in 2012. The install base of users is largely unchanged. Microsoft has cited "over 1 billion" to 1.4 billion monthly active devices, with figures varying between official statements. My estimate has been 1.2 billion PC users with an additional 250 million Mac users, more about this later.
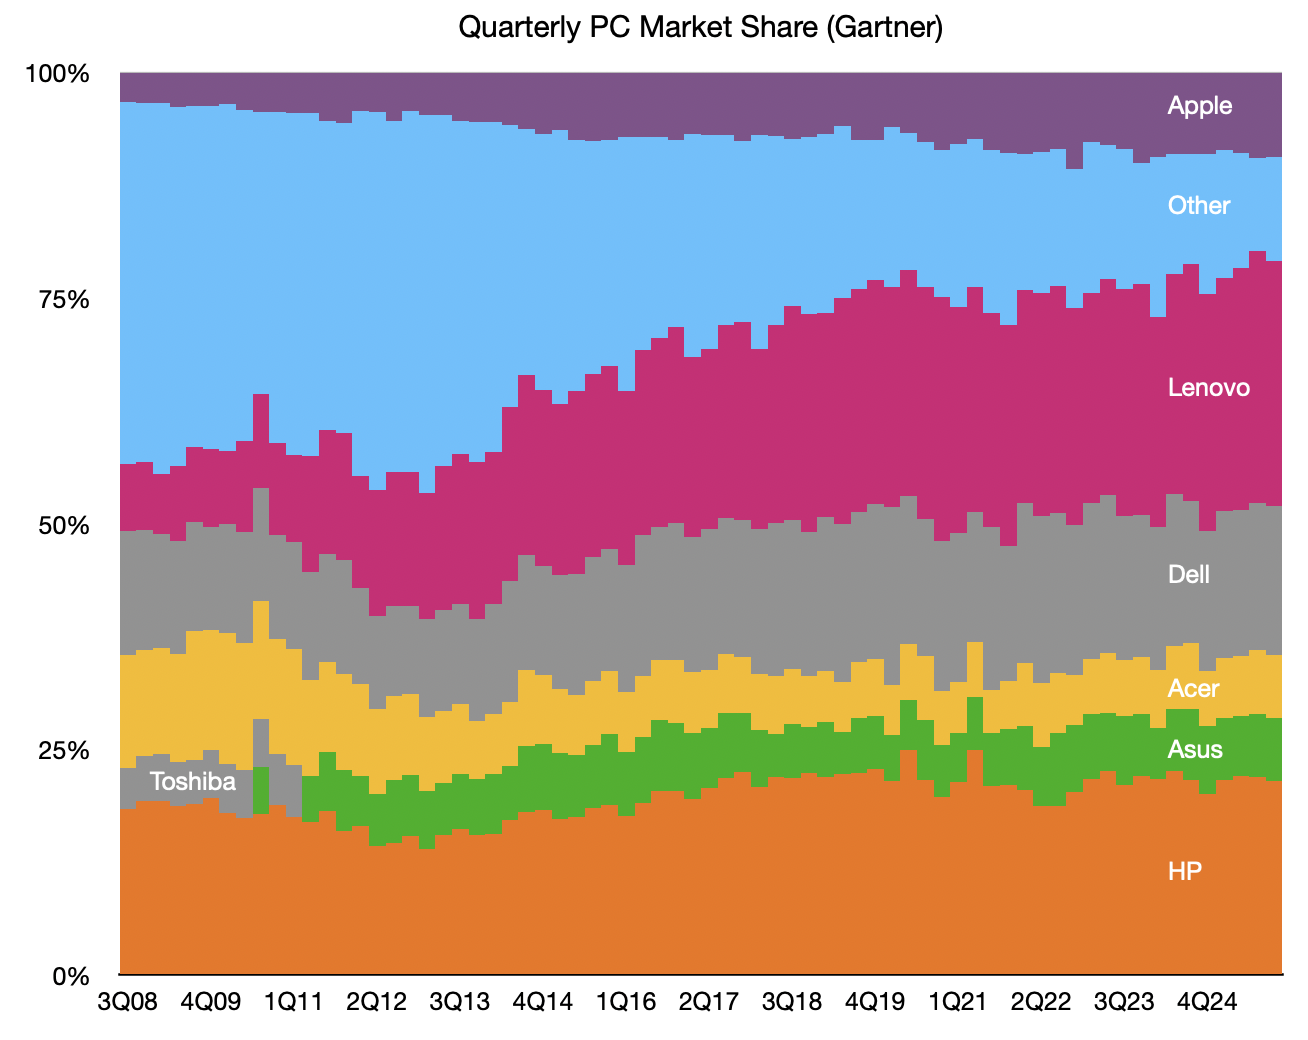
The shipments data provided by Gartner over the last 17 years is shown below:
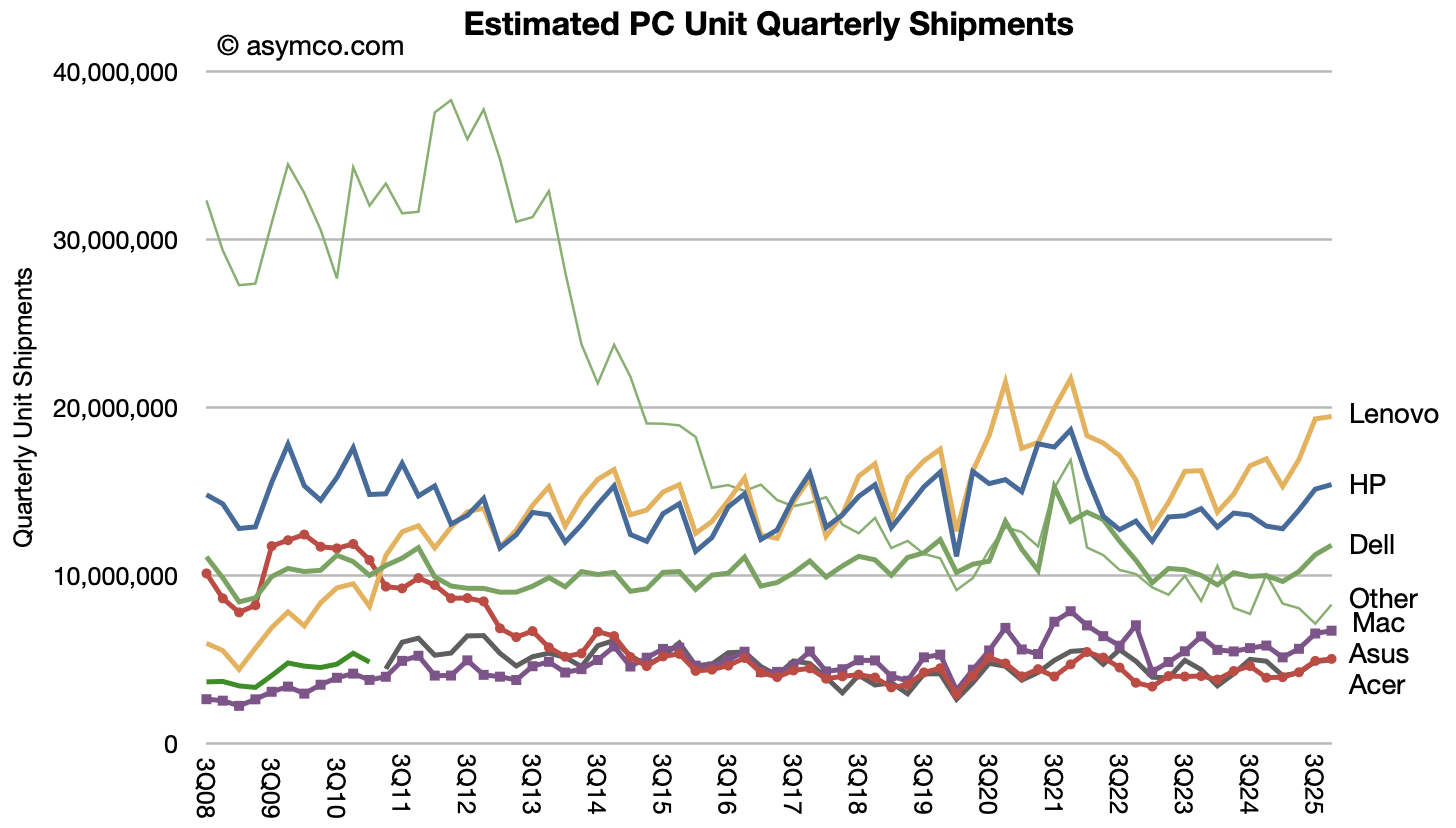
Notable are the declines in "other" vendors and the gains from Lenovo and Apple. Broadly speaking, "other" are assumed to be mostly consumer markets and that has either declined or been captured by Mac with consolidation around Lenovo. Lenovo, HP, Dell are likely to maintain enterprise accounts serving large customers and that has been a steady but low margin business for decades.
Mac has grown to fourth place but still a way to go to third place Dell. Apple may overtake "other" combined in a year or two.
The market share data shows how "other" has been squeezed between Lenovo and Apple while the other players have largely held steady. Acer and Asus somehow managed to survive.
So what does this mean for the future? What is Apple's strategy with the MacBook Neo. Or for that matter, for Studio and iMac and Mac Mini and MacBook Air and MacBook Pro?
The Neo was such a surprise for many given its incredible price/performance ratio and the overall quality and affordability (and distribution potential). I've read many reviews suggesting it will "disrupt" the market and that Windows PCs are just no longer competitive.
Will the MacBook Neo move the needle? Will it take share from the Windows world (or for that matter from the Chromebook and even iPad?)
One more thing: Apple's sales of about 24 million Macs for a base of 260 million users implies a life span for Macs of nearly 11 years. However, all the other PCs sold add up to 238 million for a user base of 1.2 billion. That means the life span for the non-Mac PC is only 5 years.
This is, of course, reflected in the price difference but with the MacBook Neo, the potential for a 10 year old life for a $500 laptop puts the Neo price at $50/yr or 14c/day. Based on data for 2025, the average selling price of a new Windows PC is estimated to be $600 to $900 for consumer models. At $700 for a life span of 5 years makes the PC cost $140/yr or 38c/day.
This means that the average PC is more than twice the cost of the MacBook Neo. Now that is a surprise.
In the latest, (Fiscal Q3, Calendar Q2 2025) conference call, Tim Cook made a welcome announcement: "We also recently marked a significant milestone. We shipped the 3 billionth iPhone since its launch in 2007."
This was welcome because the company has not been providing iPhone unit shipment numbers since Q4 2018. What it has meant is that the number of iPhones sold and their average selling price had to be estimated. Active iPhones were occasionally provided but quite rarely.
With this update, the veil has been party lifted. I, as well as you I'm sure, rushed to assess how well we have been estimating the iPhone economy over the last seven years. Prior to Tim's data dump, my own estimate for total iPhone shipments was 3.104 billion, including the last quarter. [Keep in mind that the 3 billionth iPhone may have shipped in the beginning of the quarter which amounts to more than 50 million units prior to announcement so my error of 104 million is minus perhaps 50 million.]
In the worst case, my error amounts to about 3.4% over the entire lifespan and perhaps 5% over the estimate period. That is perhaps not criminal since, after all, what's 100 million iPhones between friends?
I adjusted the estimated average selling price to reflect this error and shaved essentially one quarter's worth of shipments from the data set. In other words, my estimate would have been that 3 billion was reached in March rather than June. Mea culpa.
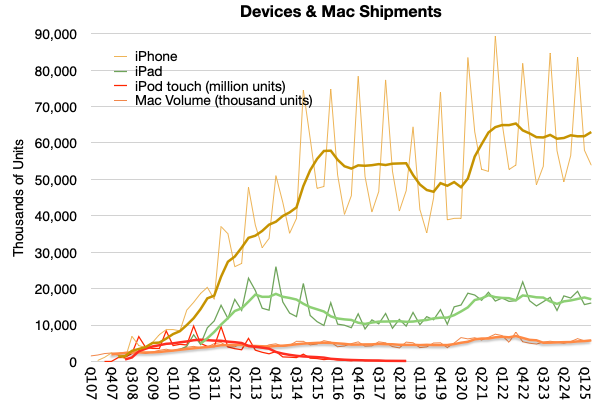
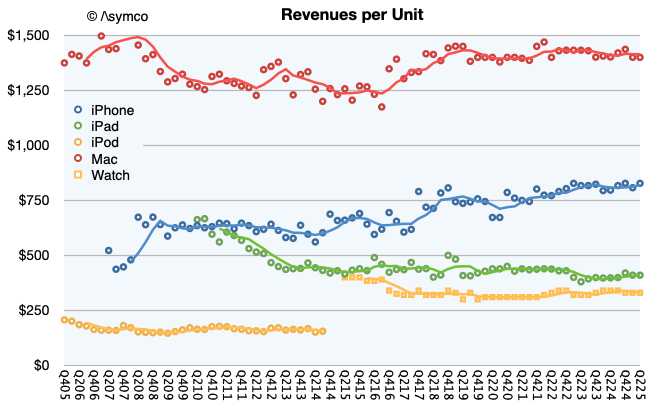
The new view into the entire iPhone shipment history is shown below. Also below is the impact of adjustment in the revenue per unit (i.e. average selling price.)
Note that I used trend lines to show the four-period (12 months) running average to remove the seasonality. Perhaps there is something to be read in the pattern. I would say that there are some notable surges as during the initial uptake, during the first "supercycle" in 2014, the surge during Covid and perhaps the "China recession" of 2018.
Clearly we are not at the highest sales levels today, as the Covid surge will take some time to grow into but at the same time the volumes are not decreasing. You can see the contrast to the iPod touch when an alternative was available, namely the iPad. The demise of the iPhone has been greatly exaggerated.
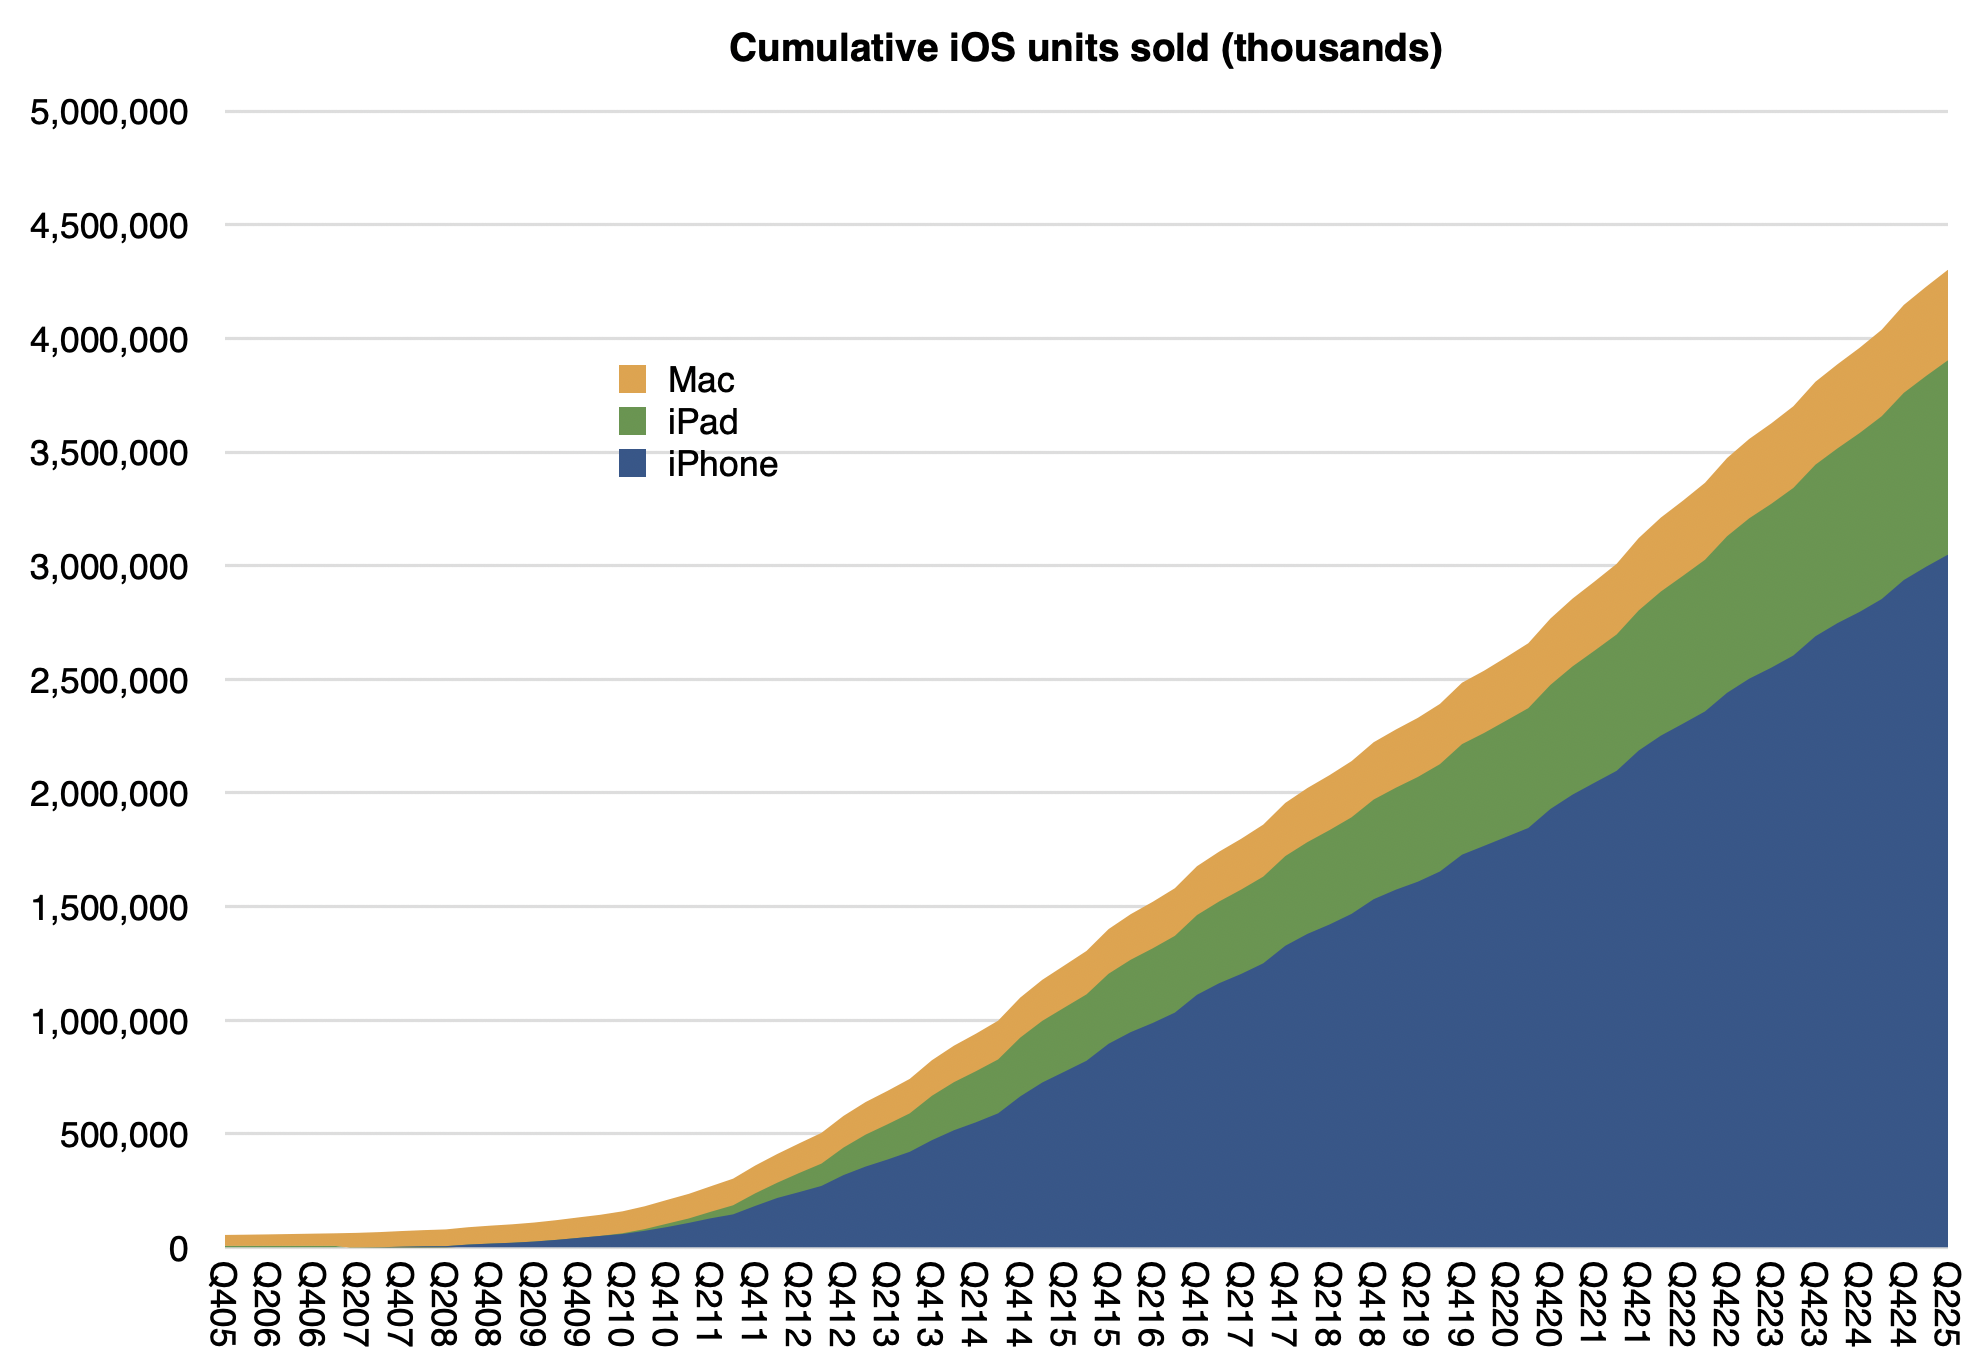
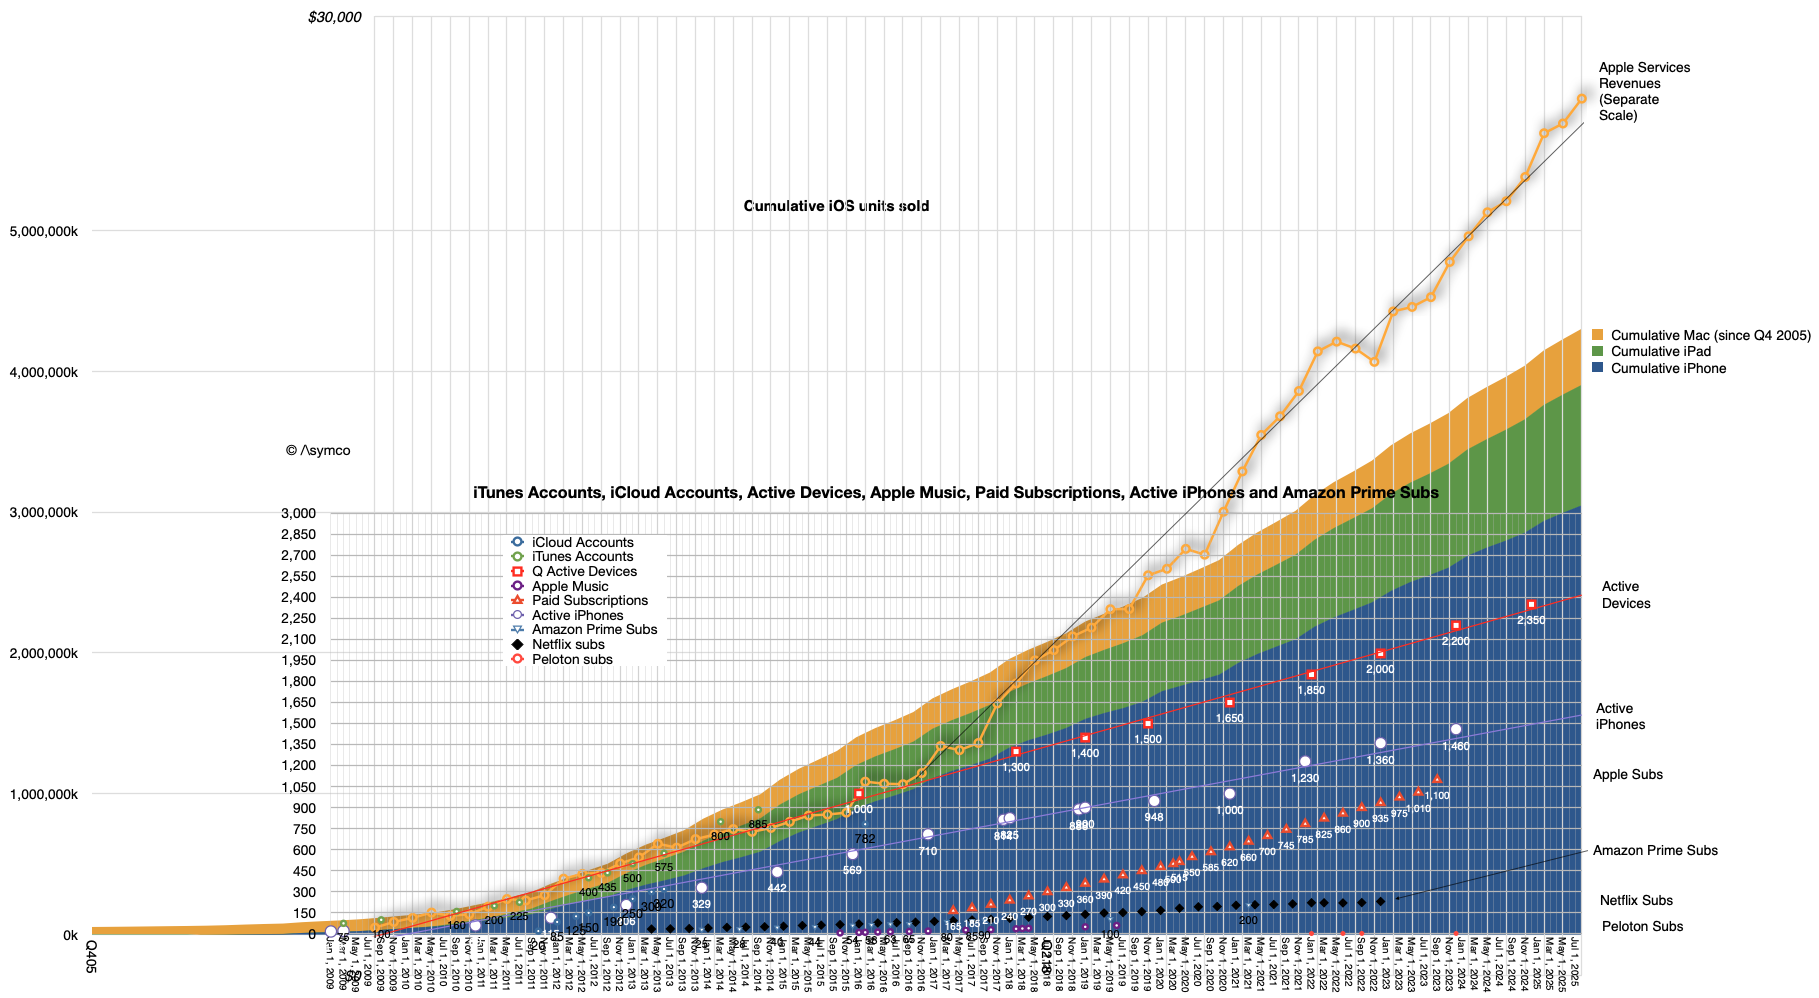
Note also that I also included the iPad, Mac and the iPod touch for comparison. You can try your hand at reading the patterns there. For the record, my cumulative Mac estimate (since Q4 2005) is 398 million[1] and the cumulative iPad is 855 million. Here are the iPhone, iPad and Mac cumulatively with a current total of about 4.3 billion:
Not shown are iPods (touch alone is about 114 million), Watches (probably at least 250 million) and Vision Pro (single digit millions) or wearables and home. If we did include those, it's a safe bet that Apple has shipped over 5 billion devices.
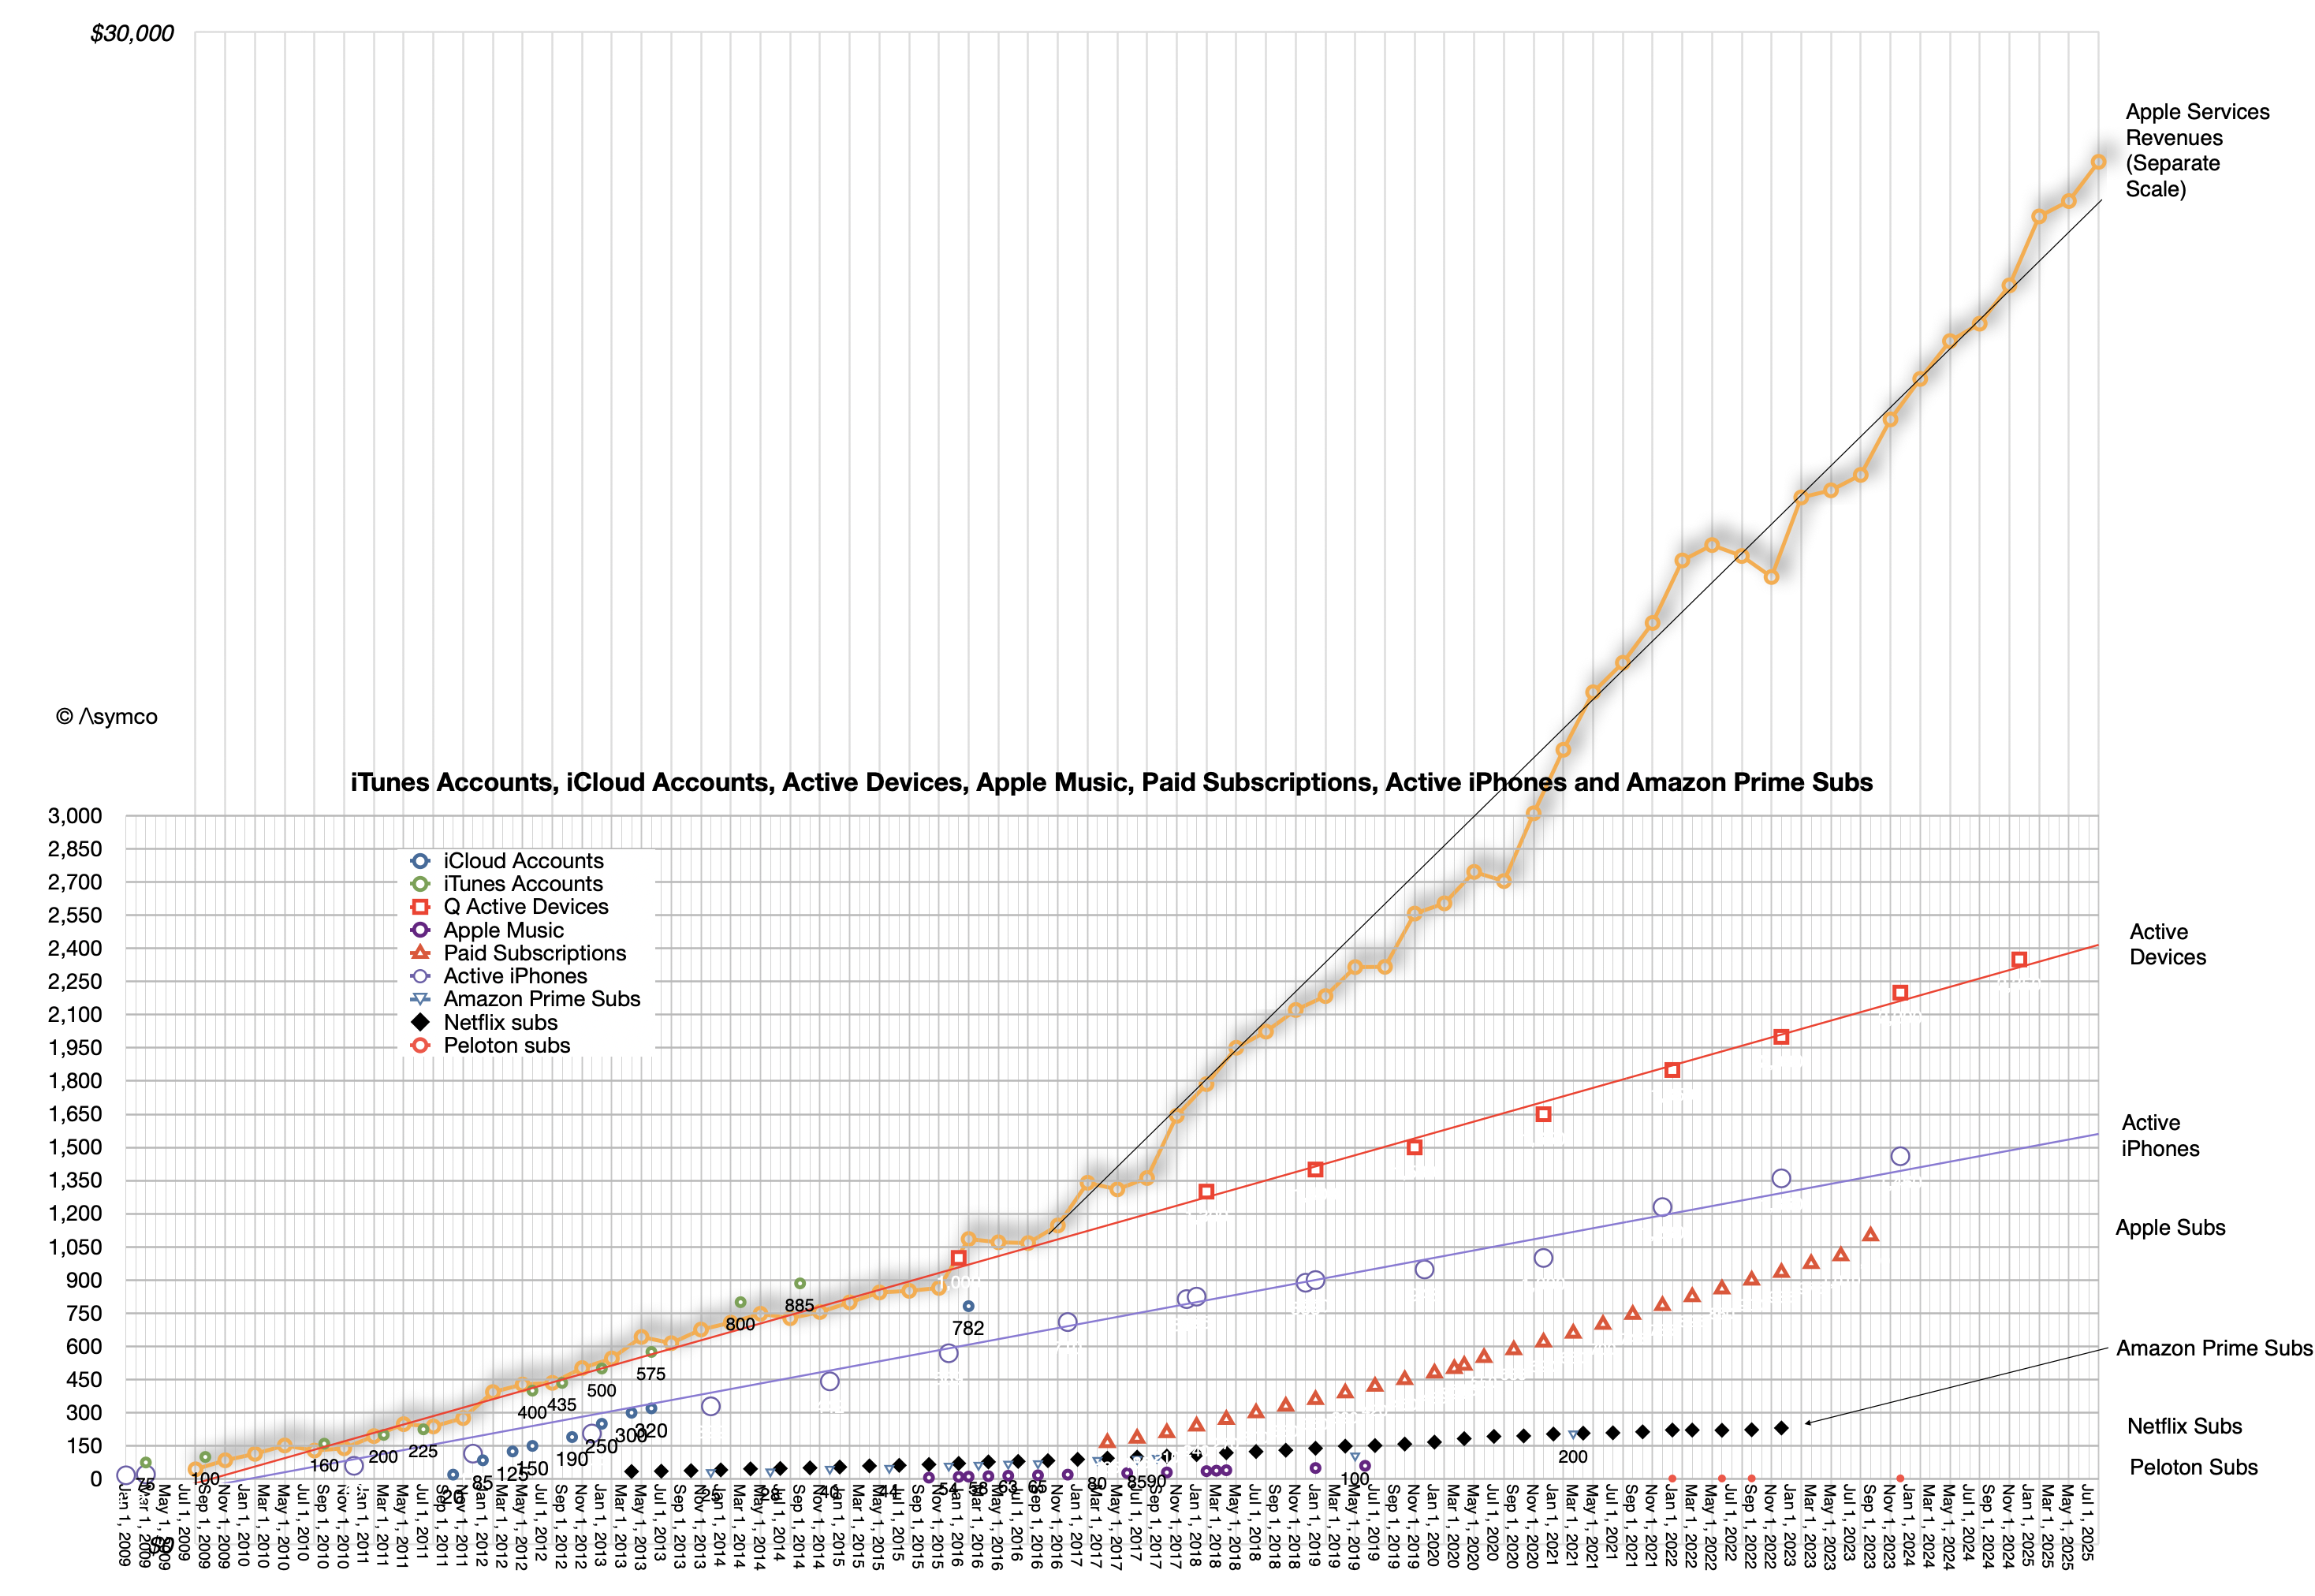
Interesting, but not as interesting as how many are active (in use at least once a month.) For that estimate we have another set of data:
The linear extrapolations for active devices, active iPhone and, on a separate scale, actual Apple Services revenues can be seen. Also subscriptions, as long as they were available, plus other data sets for comparison such as Amazon Prime subscriptions, Netfilx and old Apple Music and iCloud account data.
At the risk of overloading an already busy graph, it might be interesting to show cumulative devices vs. active devices:
The top of the area graph seems to be not too different than the top of the red dotted device line. What might be instructive is to calculate the ratio between these two: the active devices and the cumulative devices during the period from 2016 (when 1 billion active were reported) and the beginning of this year when the last figure was reported (2.35 billion active devices on Jan. 30 2025).
Again, excluding wearables, iPod touch, Apple TV and Apple Vision Pro we have these ratios:
Date
Ratio of Active devices to Cumulative iPhone, iPad and Mac sold
Q417
0.66
Q418
0.63
Q419
0.60
Q420
0.60
Q421
0.59
Q422
0.58
Q423
0.58
Q424
0.57
What this suggests therefore is yet another way to forecast the value of Apple as an enterprise. We already know that the prediction of active devices, revenue per device and margin is sufficient to forecast the company's earnings. These all seem to be quite linear and thus predictable. Now we can add the relationship to devices sold as yet another way to calibrate or test assumptions.
After diligently doing so, simply multiplying the results by a random number called the P/E ratio (aka "sentiment") allows you to predict the share price at any point in the future.
Have fun.
It would be interesting to consider that if, as it's been often claimed by Apple, half of Mac users and half of iPad users are new to the products, then there would be 200 million new Mac users and perhaps 400 million iPad users.
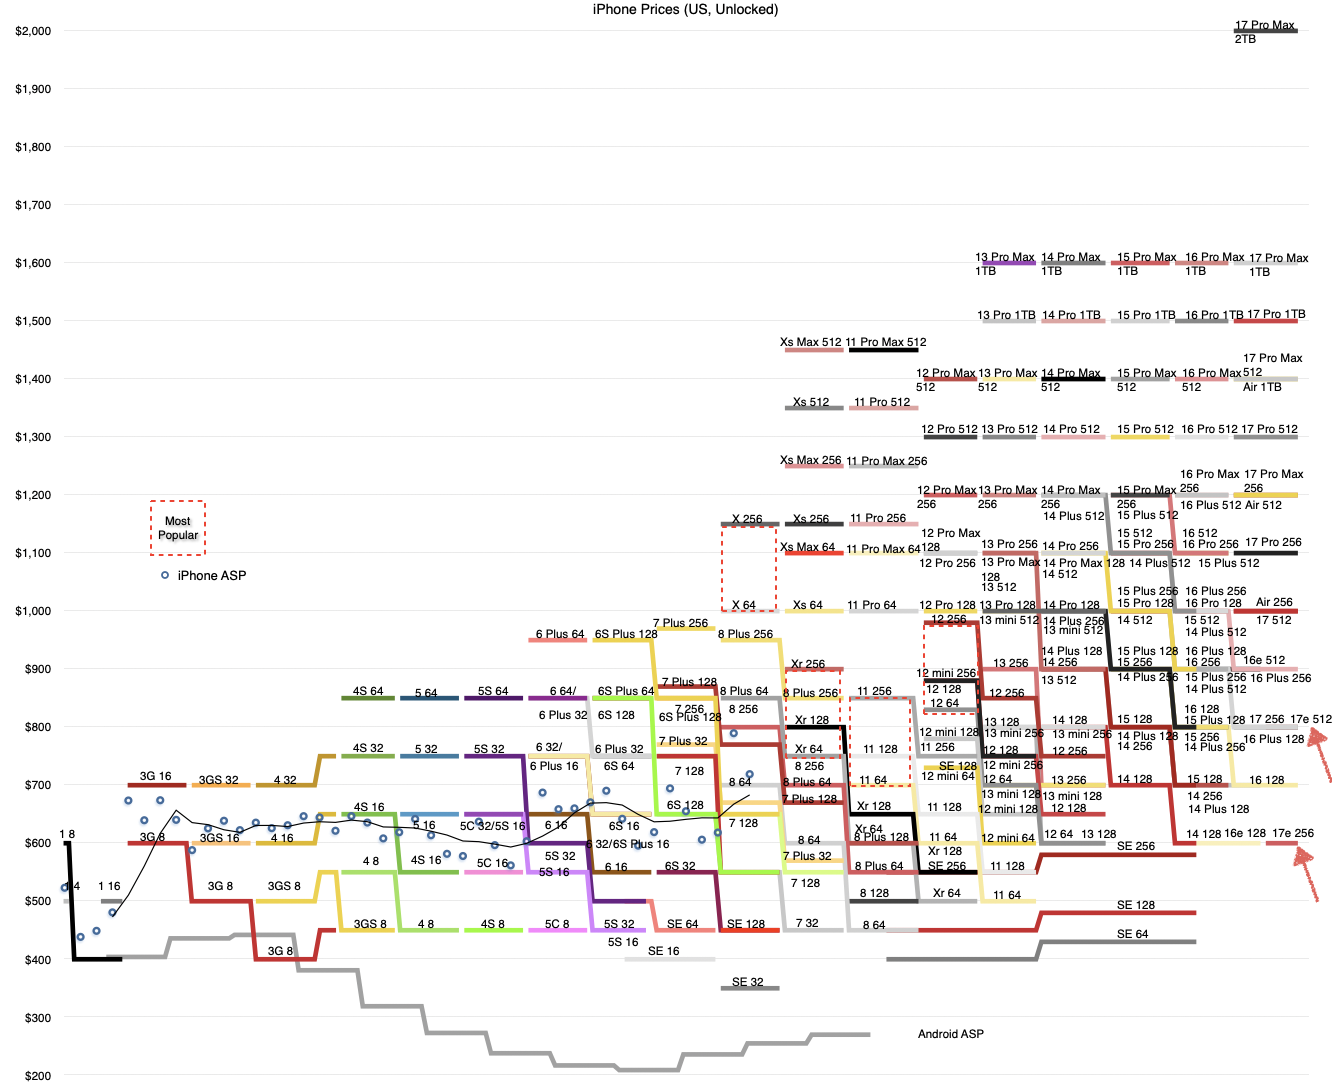
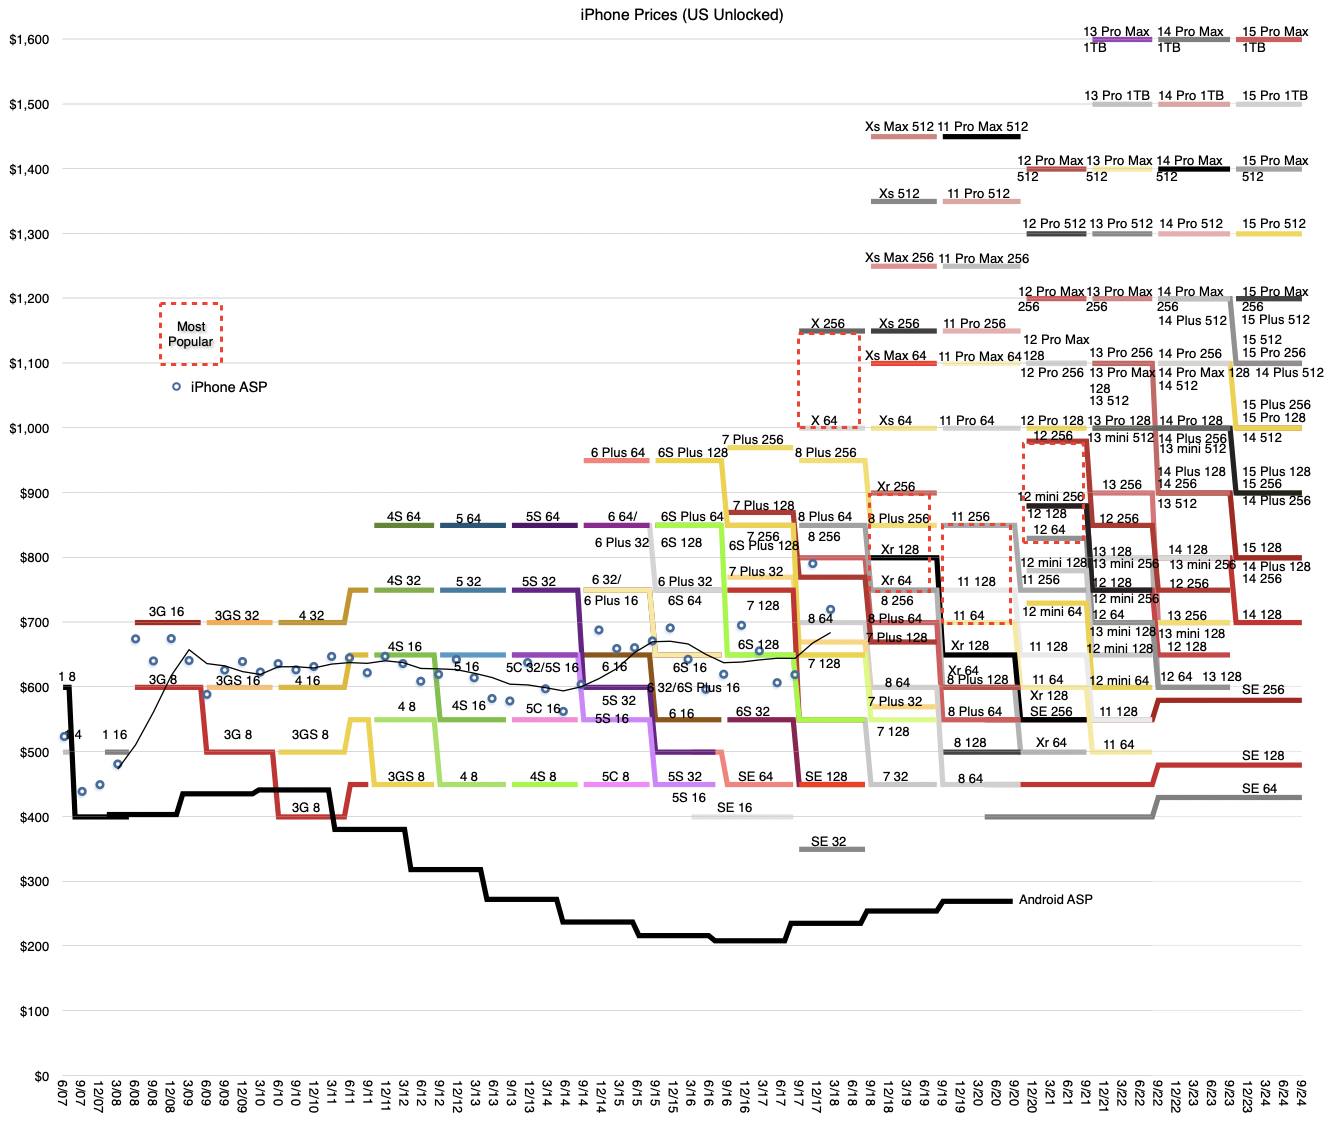
iPhone 15 has just been released and, as usual, all the products in the iPhone line-up have received new prices. The following graph shows the current product line-up (US prices before tax) and the historic price points for all the previous versions of iPhones since inception.
It was amusing before the launch to see reports that the iPhone 15 would see a price increase. If I were a betting man I would have bet against it. The reason is that, as the graph shows, pricing changes are regularly made every three years and the last one was in 2021, two years ago. It would be an extraordinary claim to expect a price increase this year.
Also, as you can see, price increases only occur when there is a new "top-of-the-line" model introduced. This new highest spec, usually, but not only, in memory, justifies the new top of the range. For instance, the top of the range in 2015 was the 6S Plus with 128GB of storage. Three years later is was the Xs Max 512GB. Three years later it was 14 Pro Max 1 TB. In nine years the top memory increased by an order of magnitude but the top size also increased as did the number of cameras. Naturally, the price increased by about $650.
Therefore we can predict with some comfort that the next "highest price" point will be $1699 for the iPhone 16 Pro Max 2TB, or equivalent. The possibility exists that the iPhone 16 Pro will also include a leap higher in optics and have more technological tie-ins with Spatial Computing.
But this highest price point is not necessarily the most common price point. Indeed, we can guess that the most common point is visible in our graph above. The density of product choices increases toward the middle of the range. The highest and lowest price points are populated with one product. The middle price points from $800 to $1,100 are populated with\ three products each. Therefore a good guess is that the $900 is likely most popular and that the average selling price is also very near there.
Note that the average sales price (ASP) has not been available from Apple since 2018. At that time the ASP was $790 (holiday quarter of 2017). A gradual increase to $900 over five years is not unreasonable. In fact, it probably should be higher given inflationary pressures. We can only guess.
We have to understand that Apple does not set pricing in response to competitive pressures, commodity pricing, inflation, currency exchange rates or internal sales or margin targets.
Pricing is sacred and is a decision made based on consumer understanding.
The anecdotes of Steve Jobs preferring certain price points because of their poetic value are legendary. 99c for a song sounds right and looks good. The iPod was priced in lovely, alliterative $100 increments. Same logic applies to services.
Pricing is an art and when you see the spectrum above you also see how the increments nudge the decision process. Pricing is a signal. It's a conversation between seller and buyer containing information that both parties will exchange. On the part of the seller it suggests both the cost of the offering and the value it provides. Buyers are inclined to see if they can stretch to the next higher increment given the increased value proposition. Once their decisions in the collective are tallied, the seller knows well what buyers prefer.
Apple has been having this conversation for decades and it shows.
For the last two years I've been studying the transportation economy and introducing the idea of Micromobility. Simply, Micromobility promises to have the same effect on mobility as microcomputing had on computing. Bringing transportation to many more and allowing them to travel further and faster. I use the term micromobility precisely because of the connotation with computing and the expansion of consumption but also because it focuses on the vehicle rather than the service. The vehicle is small, the service is vast. ((If you want to learn about the real future of transportation sooner rather than later, do consider coming to the Micromobility California conference.))
One of the elements of analysis for Micromobility is the notion of Unit Economics. The idea is that each vehicle can be seen as an independent business. It requires an investment, has a revenue attached, requires operating costs and fixed costs and finally, hopefully, generates earnings. A fleet's economics is therefore a multiplication of the unit economics by the fleet size. A similar partial construct exists for mobile network operators where the network revenue is defined by ARPU (average revenue per user). In consumer hardware we also have the idea of ASP (average sales price) and BOM (bill of materials) which describe the revenue and variable cost of each device.
In the case of Micromobility the unit economics is more broadly applied in being an entire P/L statement for each vehicle. One example for the e-scooter sharing company Bird is here. If the unit economics of Bird is consistent across geography and time then the entire business can be valued based on one "average unit". Measuring the health of the business can thus be summarized in BOM, Utilization, Lifespan, Attrition and Cost structure or one unit.
For some time now I've advocated a similar approach for Apple.
The idea is to look at each Apple device sold as a black box that requires investment, generates revenue and, given a certain cost rate, produces a profit. Indeed the company has suggested that this is how it measures itself and has now encouraged us to do the same by withholding measurements that misdirect us away from this method.
Unit sales for Apple are like unit production rate for micromobility. It's certainly important to know how many e-scooters or e-bikes can be manufactured and deployed but it's far more important to know how long each one lasts (lifespan) and how frequently it's used (utilization) and what pricing can be obtained for that use or a per-mile basis.
A restriction on unit production could slow the network's growth but it may not affect the demand measured in miles of distance that users need to cover. A lack of vehicles means users will hire cars or walk or transit or perhaps won't take the trip at all. But once supply is provided the choice of micromodes should compel users to use them.
In this view, the Apple business can be seen as a base of devices multiplied by the revenue per device subtracting the cost.
In the latest letter to investors Tim Cook wrote that the total number of active devices has increased by more than 100 million in the last twelve months. Given that the figure a year ago was 1.3 billion, the current total must be 1.4 billion. We can also estimate that Apple sold about 303 million devices in 2018. This implies 2 out of 3 were replacements and 1 out of 3 increased the base.
Services revenues were about $40 billion in 2018 (up 28%). Total revenues were $261.5 billion.
Thus for the whole of 2018:
$194 per active device of which...
$30 in service revenues per active device
We can repeat the process for costs and earnings.
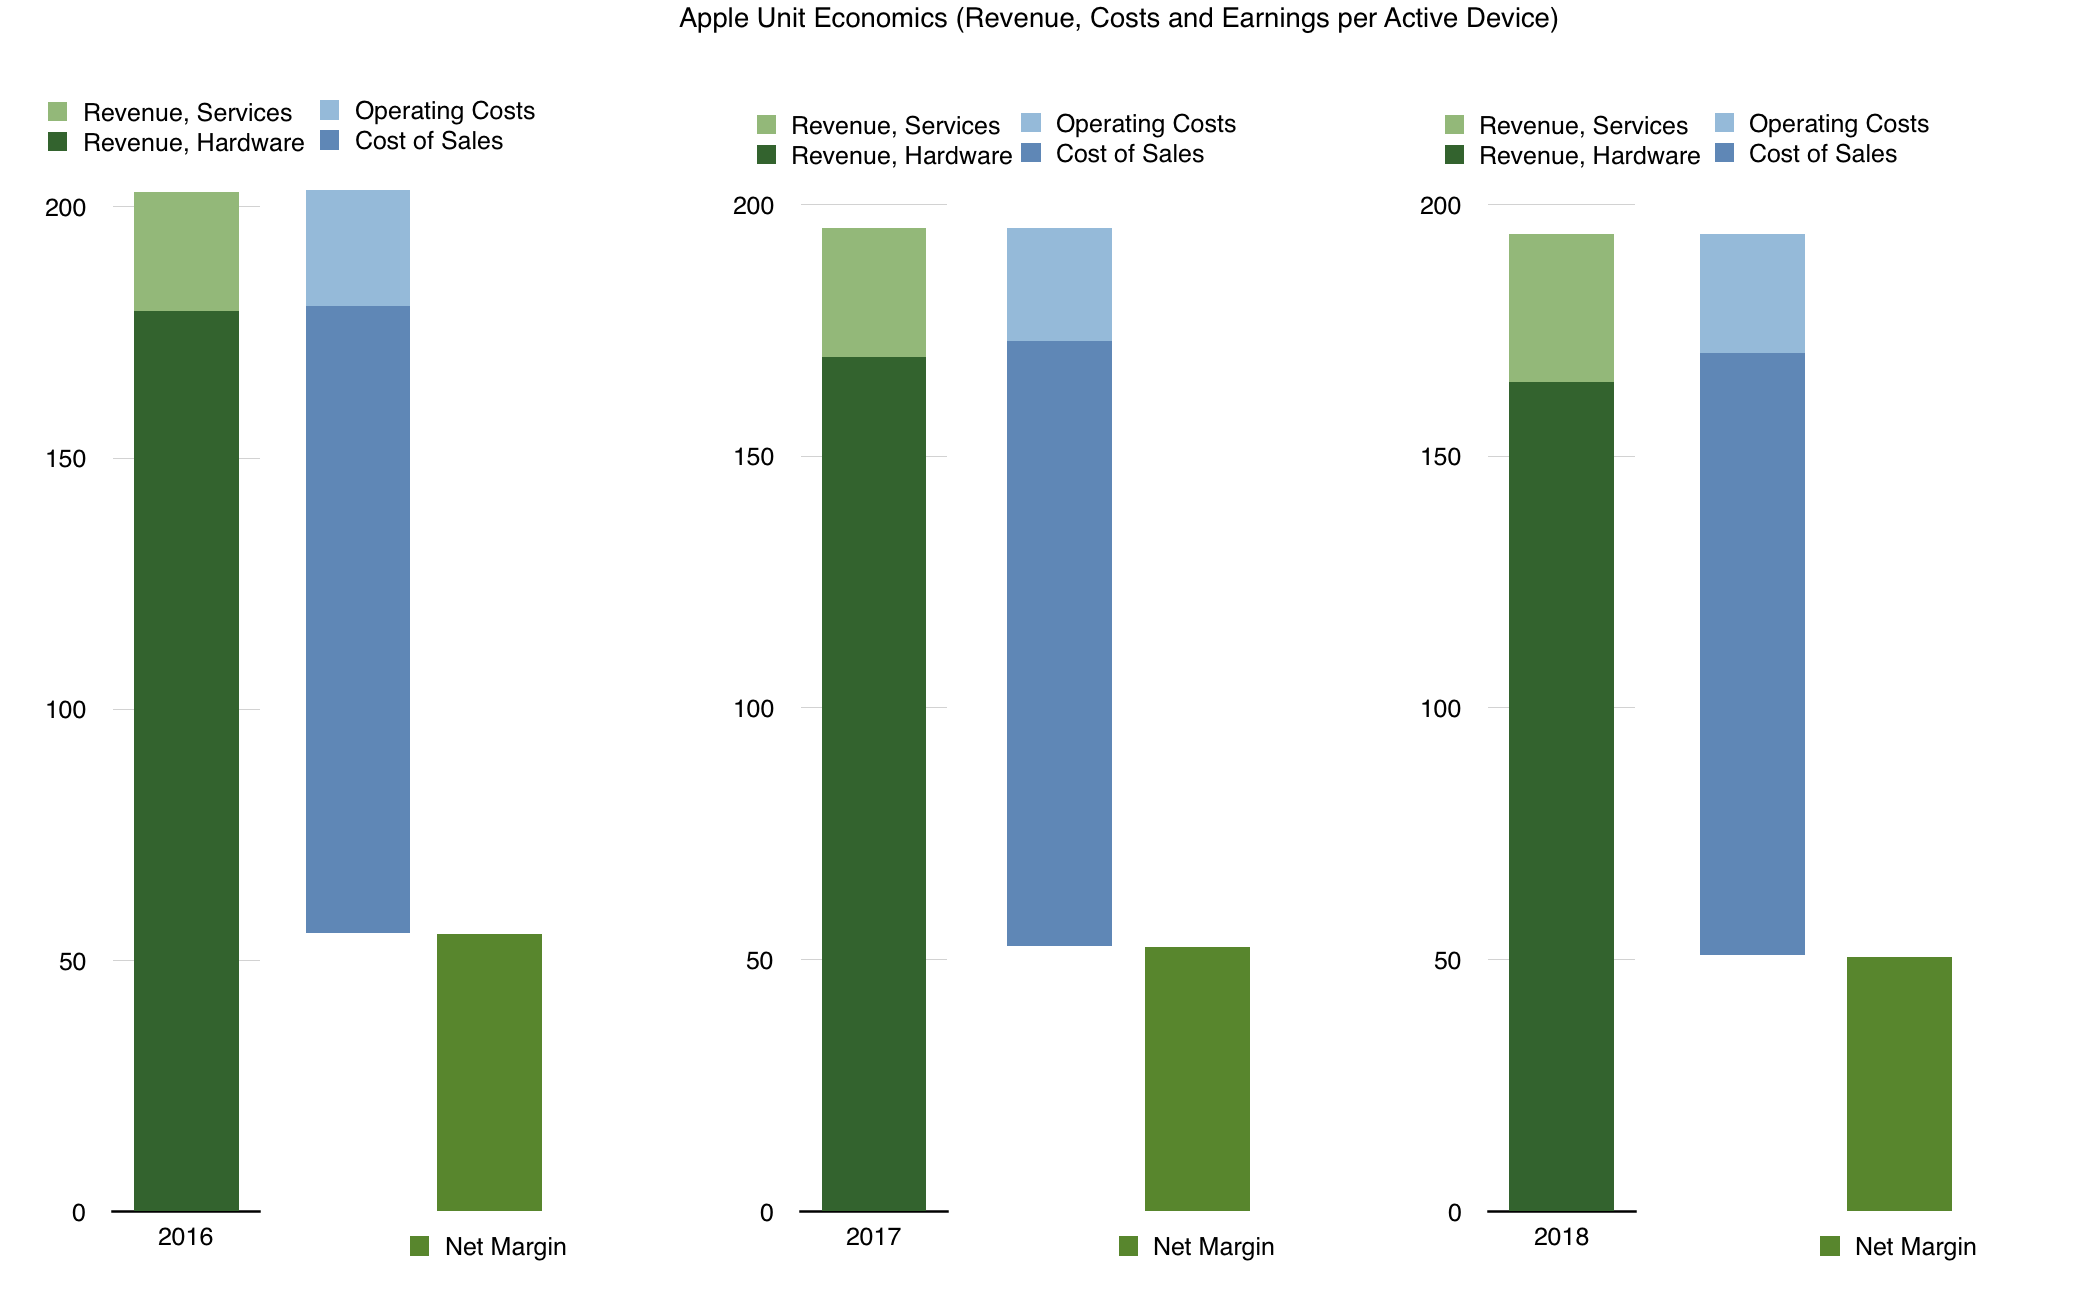
Through this lens, Apple's business over the last three years can be seen in the following graph:
A few observations:
The business is remarkably stable over the last three years.
The top line went from $179 to $165.
The bottom line (Net margin) per device went from $55 to $51.
This happened while the base multiplier went from 1.15 billion to 1.4 billion.
Service revenues are increasing (from $24 to nearly $30)
Seen this way the pattern of service growth at the expense of hardware is clearly evident. This is generally contrary to perception when looking at devices sold per quarter.
This is a three year snapshot but if we were to forecast longer term, the questions that arise:
How rapidly can the base multiplier rise? It had been rising at 150 million/yr for two years and 100 million for one year. What is the likely increase in the future? What is the saturation point? Is it 1.5 billion (which seems a year away) or is it 2 billion or more?
How are services ramping? The revenue per device is ramping in an accelerated rate (from $2/yr/yr to $3/yr/yr). How high can revenue per device rise? Is $50/yr possible? Higher?
Is the ASP increase reducing hardware revenues? This point is contentious and I will write about it separately.
It's going to take a while for this view of the company to prevail but it's clearly the way the company itself operates and how it sets its objectives.