If it wasn't for the MacBook Neo the fall would have been much worse.
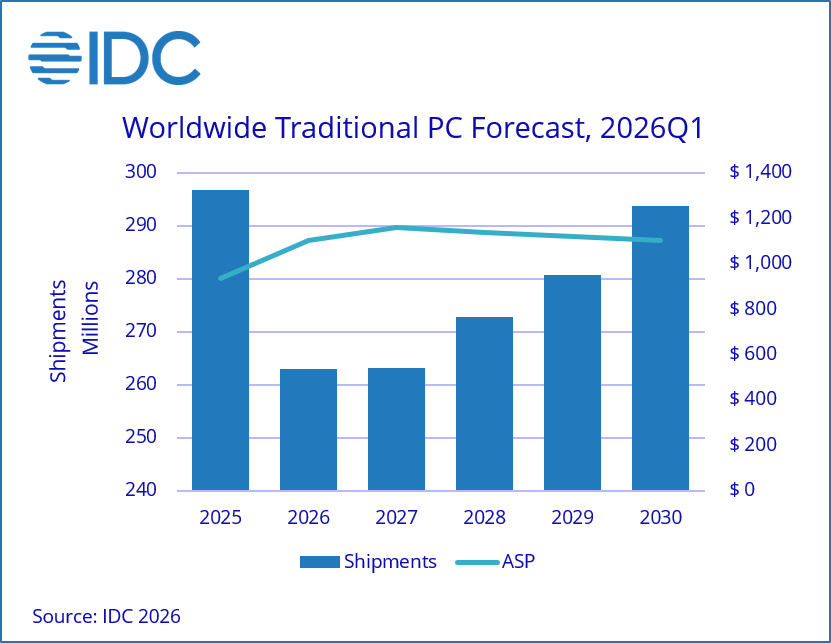
IDC now forecasts global PC shipments will decline 11.3% for the full year, with conditions worsening progressively through Q4, when shipments are expected to fall 20% year-over-year.
Pull-forward demand masked the problem, temporarily
The first quarter of 2026 offered a deceptively encouraging signal, with shipments growing 3% versus the same period last year. But that strength was largely borrowed from the future. Buyers, both consumer and commercial, accelerated purchases ahead of anticipated price hikes and product availability constraints.
Pull-forward demand masked the problem, temporarily
“The anticipation of rising prices and of limited availability of some system configurations due to memory and other component shortages has led some end-users to make purchases earlier than anticipated,” said Jean Philippe Bouchard, Vice President of Devices and Consumers at IDC. “We’re not seeing any relief to the memory shortage situation before the end of 2027, which means prices will continue to rise and PC manufacturers will struggle to maintain full product portfolios for the foreseeable future.”
One notable wildcard is Apple’s MacBook Neo, which has driven stronger-than-expected notebook demand and prompted IDC to revise its notebook forecast upward.
NB: The problem is a memory shortage: PC manufacturers are struggling to maintain product portfolios.
“The introduction of the MacBook Neo is putting real pressure on the entire PC ecosystem,” said Jitesh Ubrani, research manager for IDC’s Consumer Devices Trackers. “We expect vendors to respond with a combination of new silicon, a more efficient OS from Microsoft, and aggressive promotional pricing.”
“The competitive pressure from the Neo is providing a partial offset to broader price increases, keeping some low-cost notebook options alive. But the overall trajectory for average selling prices (ASPs) is firmly upward. IDC forecasts ASP growth of 17% in 2026, and even as memory capacity expands over the next two years, pricing is unlikely to return to 2025 levels,” Ubrani added.
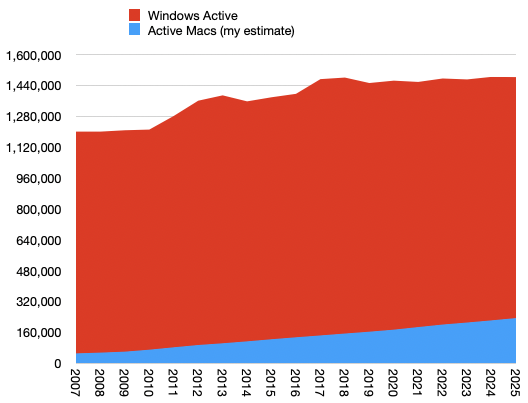
As the graph shows, IDC forecasts no recovery in volumes until after 2030. This is a multi-year opportunity for Apple and may reset market share dynamics permanently.
AI-driven memory shortage continues to hammer sales; Android sales to drop 20%
According to analysis firm IDC, smartphone shipments are headed for a 13.9% decline in 2026, a downward revision from the 12.9% decline IDC had anticipated for the year in February. It would also mark the steepest drop in smartphone history, the company said.
“these pressures are compelling vendors to reduce shipments, raise prices and concentrate on higher price tiers — elevating smartphone [average selling price] to a record $550, up $100 from last year,” IDC senior research director Nabila Popal said in a statement.
“2026 will be a defining year for the industry as [a] new reality of structurally higher costs take hold,” she added. “For consumers, it means the era of ultra-cheap smartphones is over. For vendors, it means only those that can adapt their strategies to this new cost environment and sustain demand at elevated price points will survive.
The broader Android smartphone market is set to take the biggest hit, with IDC projecting a 20% year-over-year drop in shipments. Despite that, Samsung is expected to increase its market share in the space at the expense of smaller smartphone companies thanks to its midrange and premium device lineups.
Apple, the research firm said, is also expected to perform relatively well, with shipments forecast to fall 5.2% on the year, an improvement from a previously anticipated decline of 8.1%.
In its most recent earnings report, Apple announced iPhone revenue growth of 20% for the second consecutive quarter, thanks to its strong iPhone 17 lineup and improved sales out of China.
But CEO Tim Cook also warned of supply constraints due to both the memory shortage and the dearth of iPhone processors.
NB: I would add that Apple also announced that revenues for June quarter would increase at the same rate as they did for March quarter, thus for at least half the year the company will achieve 20% growth in iPhone sales. This is in sharp contrast to both what IDC and Omdia have been reporting.
A part of Horace's interview with Asahi Shimbun on the 50th Anniversary of Apple's founding. The portion here discusses management succession and occurred on April 1. Apple announced the succession of Tim Cook as CEO to John Ternus last week. This analysis of Apple leadership decisions focuses on culture and attributes of the firm rather than attributes of the persons leading it. It may prove a more reliable predictor in future leadership changes.
…, the speculation is John Ternus is the next in line. I think that's a very plausible hypothesis. And one reason, by the way, is I always maintain if you study the company from a cultural point of view, you'll realize that there are people who cannot be CEO. You may not know who it's going to be, but I can tell you who won't be. Many people over the years suggested candidates, and I would say no, never. And here are examples. Johnny Ive would never be CEO. An external hire would never be CEO. Even a head of marketing would never be CEO. Many people think that Apple is a brilliant marketing company. No, it's an engineering company. It's a huge secret out there. →
Writing the story of John Ternus' tenure as Apple CEO from April 21, 2040. What changed and what didn't.
It’s been 15 years but John Ternus has finally stepped down as Apple CEO. Analysts described the transition as expected rather than disruptive, noting that investors had long anticipated Ternus’ eventual departure. Nevertheless, he leaves with many questions still unanswered about Apple’s long term strategy. Apple incoming CEO faces a defining challenge: Fixing the company’s Services dependence. It’s been a tumultuous tenure for Ternus but he is leaving with significant accomplishments: John grew Apple devices to 4.5 billion from 2.5 billion when he took over in 2026. Many have pointed out that he has been building on… →
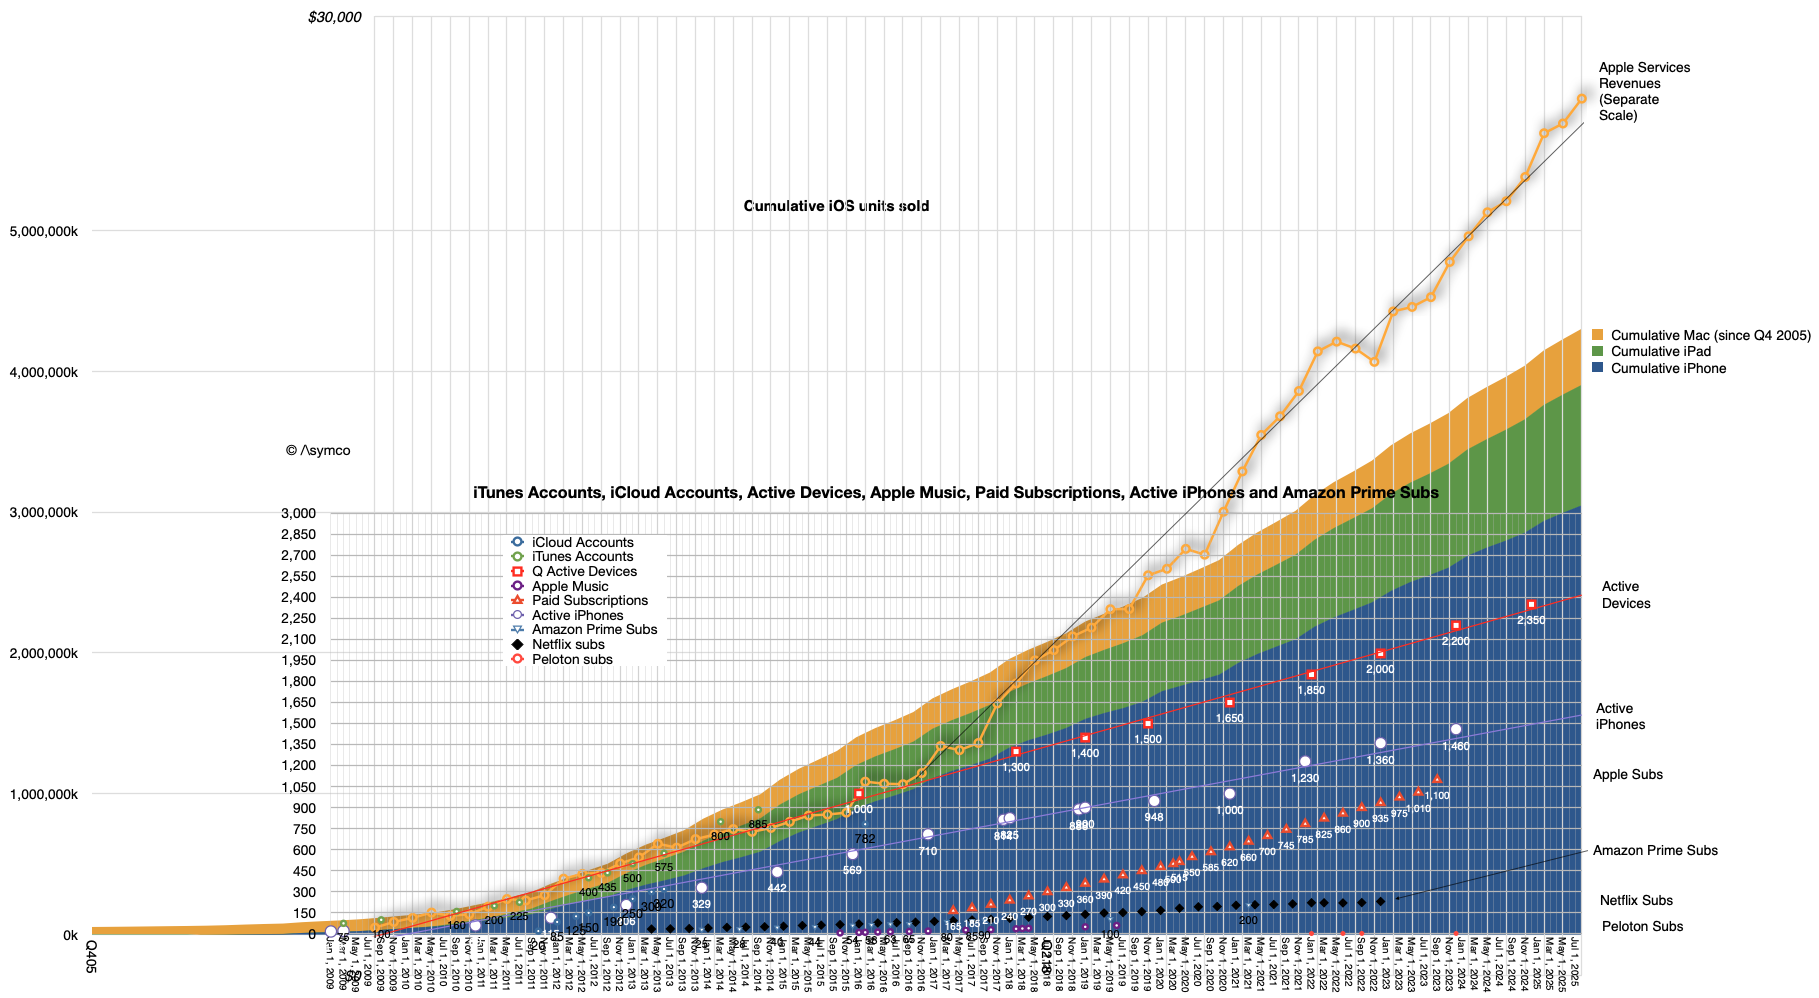
In January this year Apple reported that there were 2.5 billion active Apple devices in use. This figure has been getting updated for years and I’ve been reporting its trajectory and other measures that are correlated to it. For instance the number of Apple subscriptions, Apple Services revenues and other historical indicators such as iCloud accounts and Apple Music.
Simplifying, I published the “ACTIVE” model which makes some basic projections of this total device count and it’s shown below” One element of the analysis that has eluded me was the more precise composition of this total “devices”. →
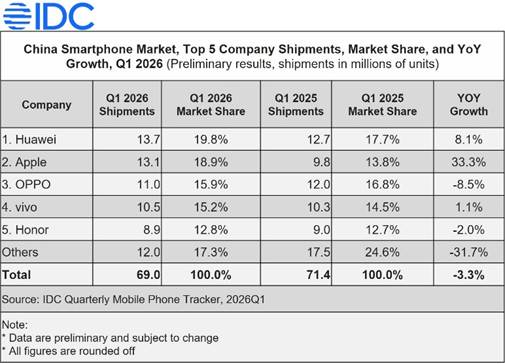
Both researchers say Apple share in China is about 19%, nearly tied with Huawei at 20%…
Some analysts are increasing their targets finally realizing that the memory supply crisis might be beneficial to Apple. This should have been noted already three months ago when Apple provided extraordinary guidance for the March quarter. →
MacBook Neo Sold Out Through April → Despite high demand and stockouts, Apple's strong brand and competitive pricing could turn challenges into opportunities for market expansion.
Microsoft’s cheapest laptop is three times more ex…
As I will argue in a further post perhaps this is one of those pivotal moments. →
Goldman forecasts fiscal second-quarter EPS of $2.00 → Goldman Sachs remains bullish on Apple, forecasting $2.00 EPS driven by strong iPhone and Services growth, dismissing overly pessimistic sentiment as the company consistently gains 100 million new customers annually.
My target of $1.98 seems amiss.…
What is always happening, the reaction that is always ongoing, is the creation of 100 million new customers every year. Accelerating this process is not a matter of just new products or change in sentiment with AI. Much of this rate is due to overall global economic and demographic change. →
What’s the consensus on $AAPL? → Apple's strong analyst backing with a 15:1 Buy:Sell ratio and $315 target contrasts its 39% year-to-date rise, overlooking potential future growth.
The consensus is positive though share price target does not consider significant share gains and service growth acceleration into 2027.
NB: The consensus is positive though share price target does not consider significant share gains and service growth acceleration into 2027. →
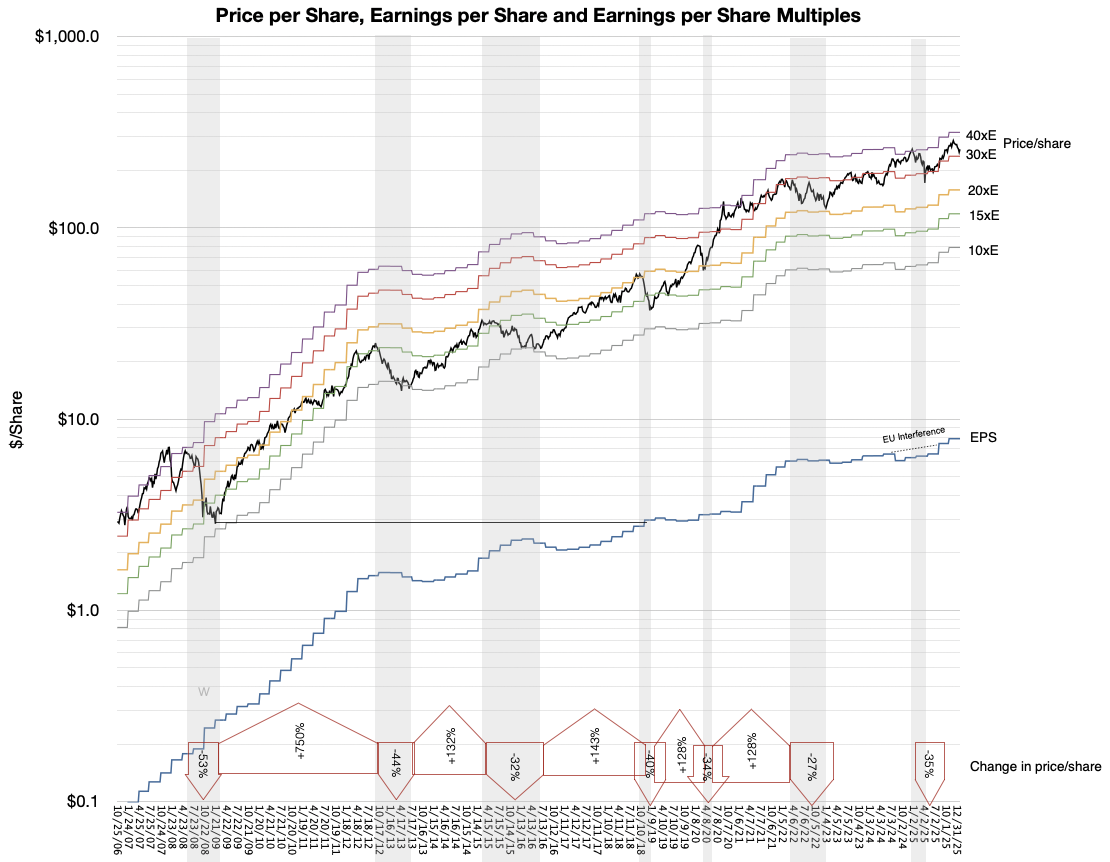
Apple 3.0: JP Morgan expects that Apple will beat its own guidance next week → Analyst Samik Chatterjee projects Apple's EPS to rise to $2.05 from $1.96, driven by strong iPhone and Mac demand, with a revenue boost to $112.7 billion, while I estimate a slightly lower 20.2% EPS growth, anticipating guidance will be met.
Read the original for a more detailed commentary from Chatterjee. He implies Apple will grow EPS 24%…
…My own estimate is about 20.2%. I look forward to a lively quarterly update. The primary source of growth must be the iPhone and I have that growing at 19% revenue growth. Last quarter the growth was 23%. Perhaps Chatterjee is assuming a similar growth rate into March quarter. That is not impossible but I am assuming guidance will be met rather than exceeded. →
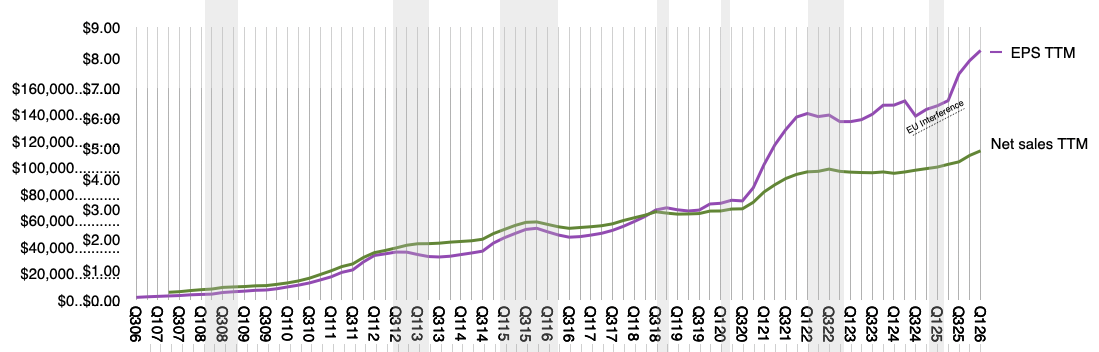
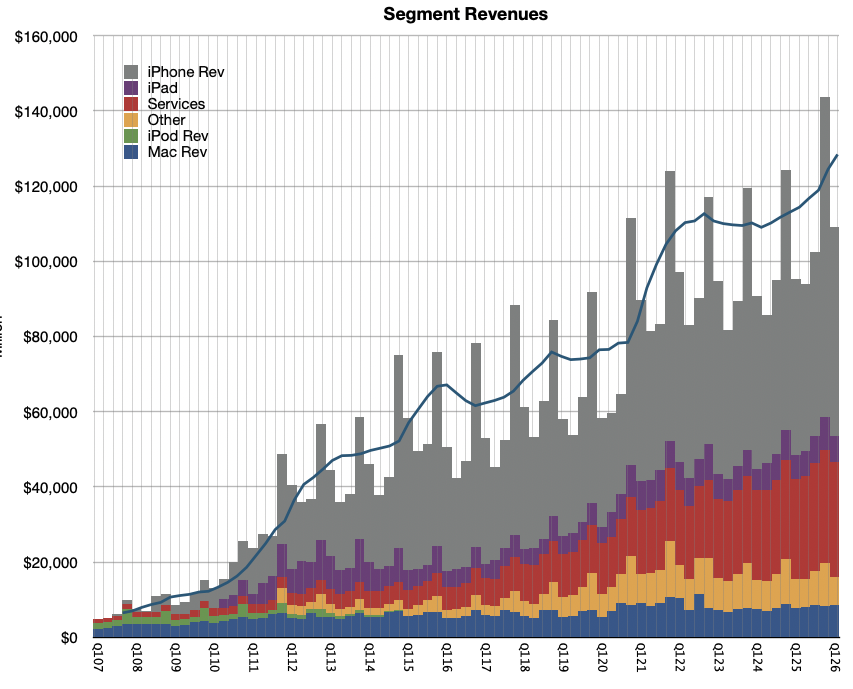
Revenues and growth rates for iPhone, Mac, iPad, Services, Wearables, plus Net Sales, Gross Margin, Operating Expense, Other Income and Expense, Tax Rate, Net Income, Share Count and EPS with a comparison to CFO guidance.
Kevan Parekh, Apple CFO: As we move ahead into March, I would like to review our outlook, […]. We expect our March total company revenue to grow by 13% to 16% year over year, which comprehends our best estimates of constrained iPhone supply during the quarter.
We expect services revenue to grow at a year-over-year rate similar to what we reported in December. We expect gross margin to be between 48-49%. We expect operating expenses to be between $18.4 billion and $18.7 billion, which is at a similar level to what we reported in December and driven by higher R&D on a year-over-year basis. We expect OI&E to be around $100 million, excluding any potential impact from the mark-to-market of minority investments, and our tax rate to be around 17.5%.
I've seen several market reports which estimate that iPhone shipments grew around 3% to 6% in the quarter. When I plug in, say, IDC's iPhones number into my model, and assume quite aggressive growth on the other categories (including Services) I get a y/y revenue growth of 11%. This is far below Kevan's January's guidance quoted above (13% to 16%).
Are IDC, Gartner, et. al. signaling a huge miss?
I need to point out that in the preceding December quarter the iPhone grew revenues at 23%! In order for Apple to hit its targets
I'd also point out that when Kevan Parekh made his forecast, in late January, a full month was already on the books for Apple. Visibility into the next month would have been relatively good as orders from the channel are partly foreseeable. For a change from implying nearly 20% growth in sales/14% in units one third of the way in, to IDC's 3% in units for the whole quarter would imply a collapse in demand into February and March. We're talking double digit decline in order volumes.
Moreover, IDC commentary on Apple is
Apple secured second place, driven by the strong performance of the iPhone 17 series, which saw significant growth in China of over 30%. This led to a 3.3% year-over-year increase in global sales for Q1. Although demand remains robust, supply disruptions and a reduction in channel support in some key markets have hindered growth..
30% growth in China! For this to be tied to 3.3% growth globally would imply significant declines elsewhere. I struggle to see how this adds up.
Here is my complete forecast for the quarter including growth rate for revenues for iPhone, Mac, iPad, Services, Wearables, Net Sales, Gross Margin, Operating Exp., OIE, Tax Rate, Net Income, Share Count and EPS with a comparison to CFO guidance.
Global memory scarcity will cause a 13 percent drop in smartphone sales in 2026, according to IDC. DRAM is in short supply because AI companies are buying huge quantities of high-bandwidth memory (HBM) for servers in data centers, and manufacturers are prioritizing HBM instead of the memory used in consumer devices.
IDC says that the global memory supply has been drained into next year, putting smartphone makers in a tough spot. Prices have spiked because there's not enough memory to meet production needs, which will cause a smartphone market "crisis like no other."
Smartphone makers are expected to ship 1.1 billion devices in 2026, down from 1.26 billion in 2025.
"The tariffs and pandemic crisis seem a joke compared to this," said IDC Senior Research Director Nabila Popal. "The smartphone market will witness a seismic shift by the time this crisis is over -- in size, average selling prices and competitive landscape. We don't expect the situation to ease up until mid-2027, at least."
Cheap Android smartphones will be impacted most heavily by increasing DRAM costs, but Apple is well-positioned to avoid major impact because it focuses on more expensive, premium devices. Apple has more profit margin to work with and is better able to secure available DRAM supply.
IDC says that even when the DRAM shortage is resolved, memory prices are not expected to return to 2025 levels, so there could be a permanent shift toward higher-priced smartphones.
The following is a transcript of the comments from Tim Cook (CEO) and Luca Maestri (CFO) at Apple's Q1 2018 Earnings Conference Call February 1, 2018. I color coded my interpretation of the comments into four categories:
Grey: Background and promotional commentary
Red: Strategy and signals of what management considers important and may include data beyond the regularly reported numbers.
Green: Financial data
Black: Commentary.
Blue: My commentary, in brackets.
For a quick read of Apple's strategy, read the Red text. These comments are not repeated in financial reports. Highly recommended.
For a quick read of Apple's financial performance, read the green text (which are replicated in financial reports). Read this if you don't want to wade through the financial reports.
For marketing or product material, read the grey text.This is sometimes unique but also repeats product launch information.
---- Tim Cook: Thanks, Nancy and thanks everyone on the call, and welcome to everyone today. Before we dive into the quarter, I'd like to take a moment to talk about a significant milestone we recently crossed.
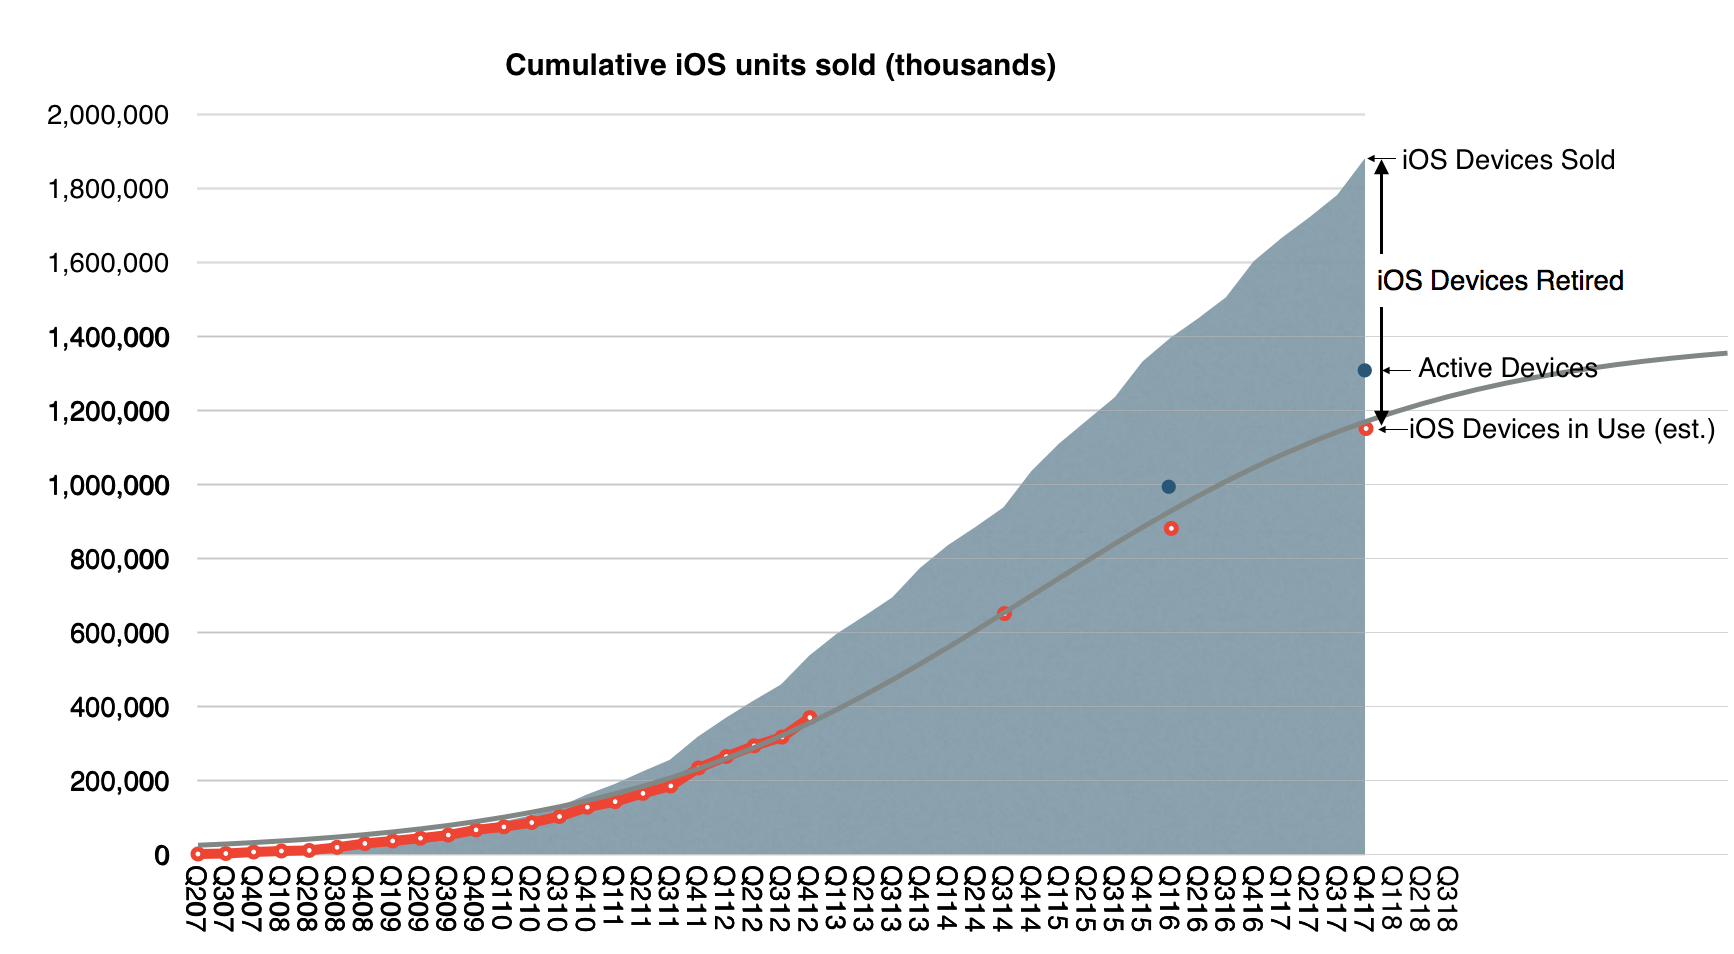
Apple's active installed base reached 1.3 billion devices in January and is at an all-time high for all of our major products. 1.3 billion devices represents an astonishing 30% growth in just two years. It speaks to the strength and reliability of our products and our ecosystem, as well as the loyalty, satisfaction and engagement of our customers. It's also fueling tremendous growth in our services business, which I’ll talk about a little later in the call. [This is probably Apple's most important number. For at least the next 20 years this is the key performance metric and it can be used to derive company's valuation. A summary of the history of active devices vs. units sold is shown in the graph below:]
Turning to the December quarter. We're thrilled to report Apple's biggest quarter ever, which set new all-time records in both revenue and earnings. We generated revenue of $88.3 billion, which is above the high-end of our guidance range, and it is up almost $10 billion or 13% over the previous all-time record we set a year ago.
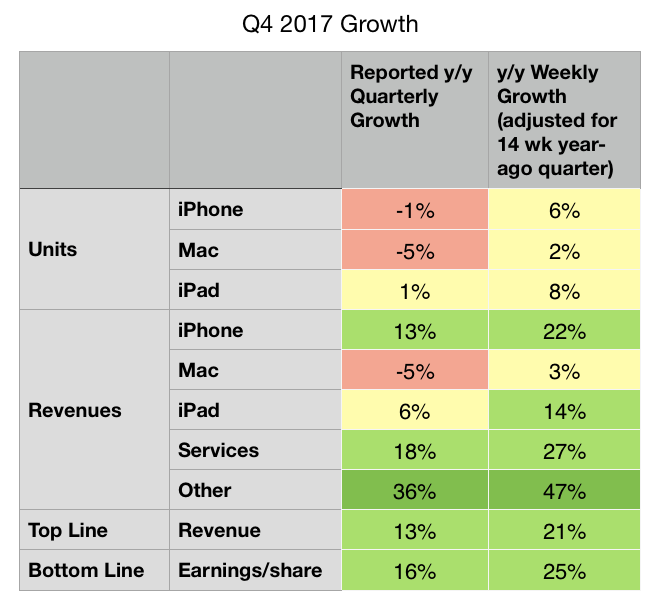
It's also our fifth consecutive quarter of accelerating revenue growth with double digit growth in each of our geographic segments around the world. What makes us even more remarkable is that the quarter we're reporting today was 13-weeks long, while the year ago quarter was 14-weeks. When we look at the average revenue per week in the December quarter this year compared to last year, our growth was a stunning 21%. [The 13-week vs. 14-week year-on-year comparison is repeated several times. The summary differences are shown in the table below:]
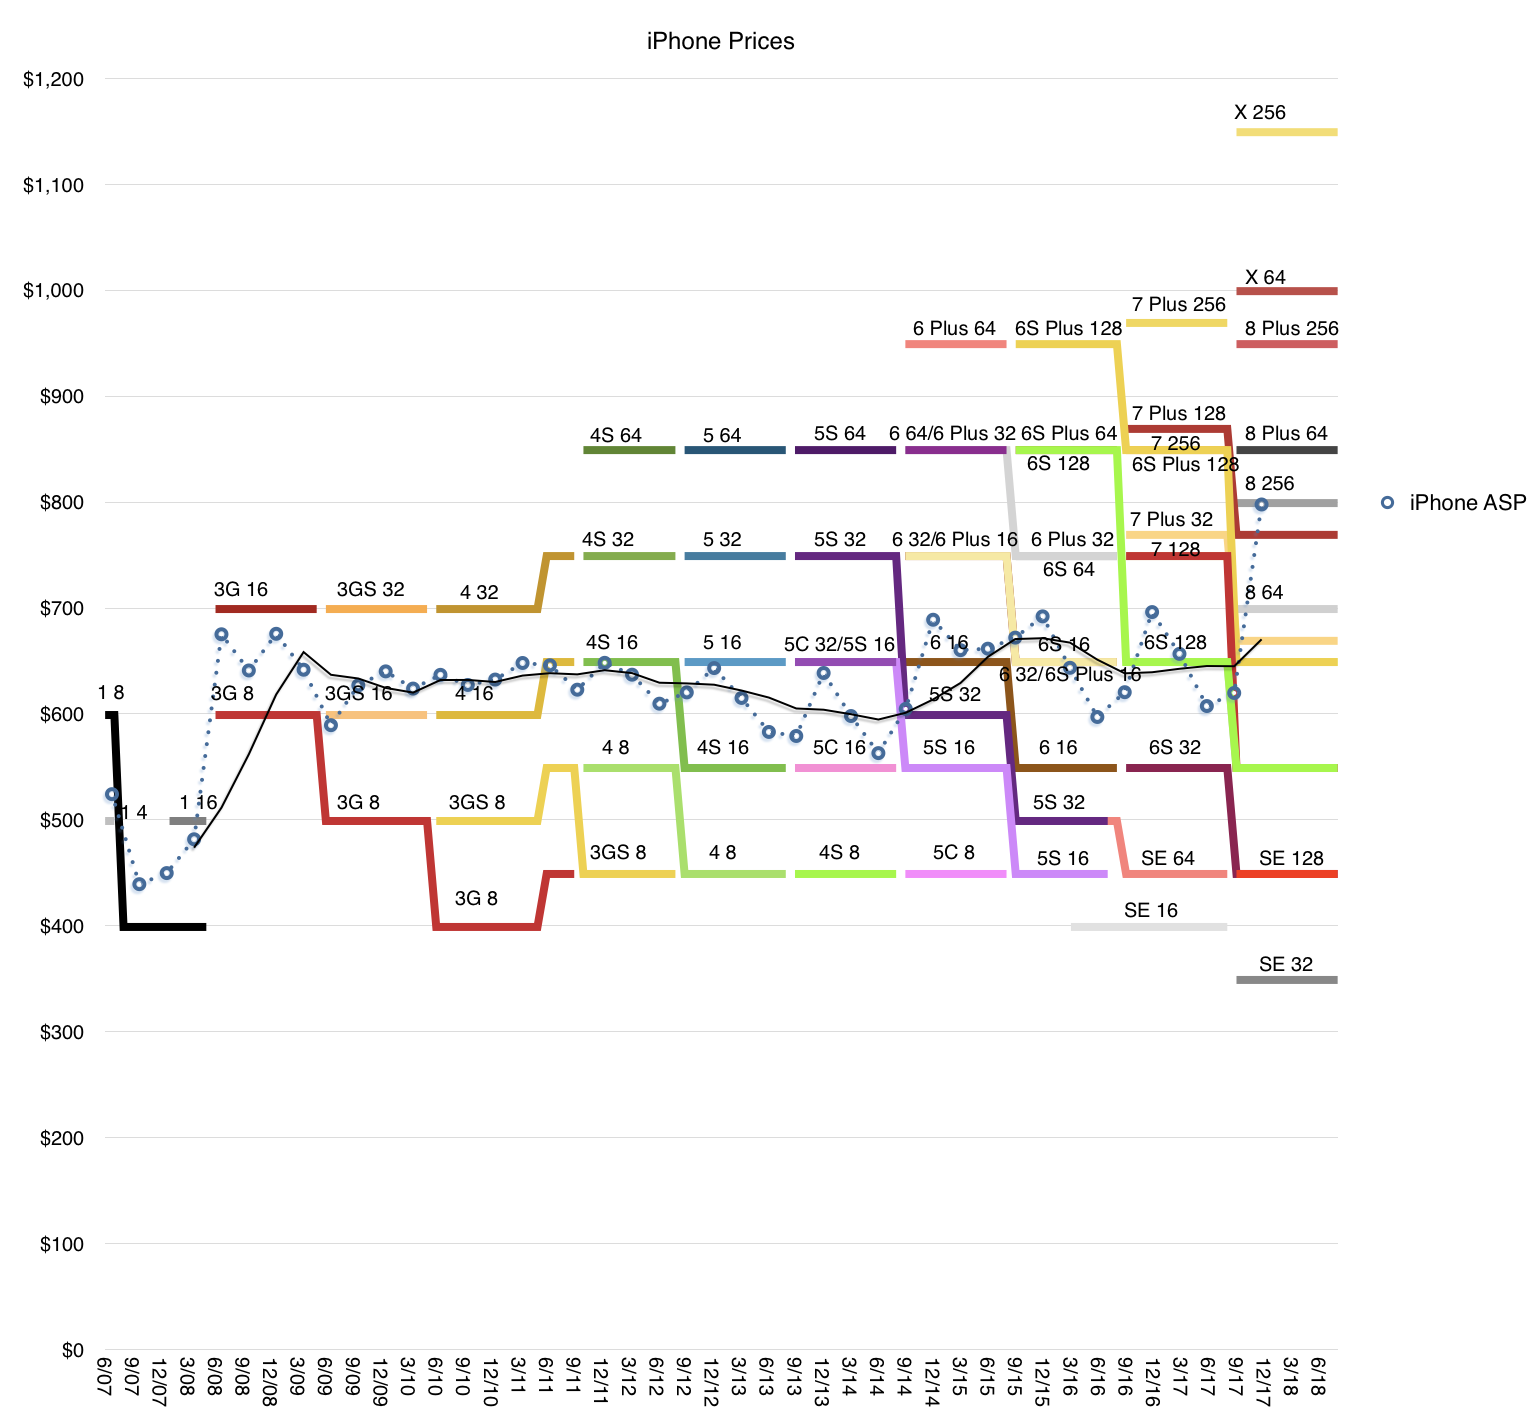
Our growth was broad-based and a key driver was iPhone, which generated its highest revenue ever. iPhone X was the best-selling smartphone in the world in the December quarter according to Canalys, and it has been our top selling phone every week since it launched. iPhone 8 and iPhone 8 Plus rounded out the top three iPhones in the quarter. In fact, revenue for our newly launched iPhones was the highest of any lineup in our history, driving total Apple revenue above our guidance range. [The iPhone X is a huge hit. It drove the average selling price $100 higher y/y. This is not only unprecedented for Apple but for the entire Industry. The average smartphone sells for less than $300 while iPhones sold for $800. The gap is widening. The following graph shows the product mix and the average resulting price.]
I want to take a moment to recognize the tremendous amount of work that went into creating iPhone 10. Our teams carried out an extremely complex launch from both an engineering and operations perspective, executing an outstanding product ramp that required years of research and development; one that introduced innovative features like an edge-to-edge Super Retina Display and the TrueDepth Camera, which enables face ID. Our customers love these new features and the new gestures like simply swiping up from the bottom, which make using iPhone even more intuitive and enjoyable.
Our team has put the technology of tomorrow in our customers’ hands today, set a standard for the next decade of smartphones and we are very proud of their achievements.
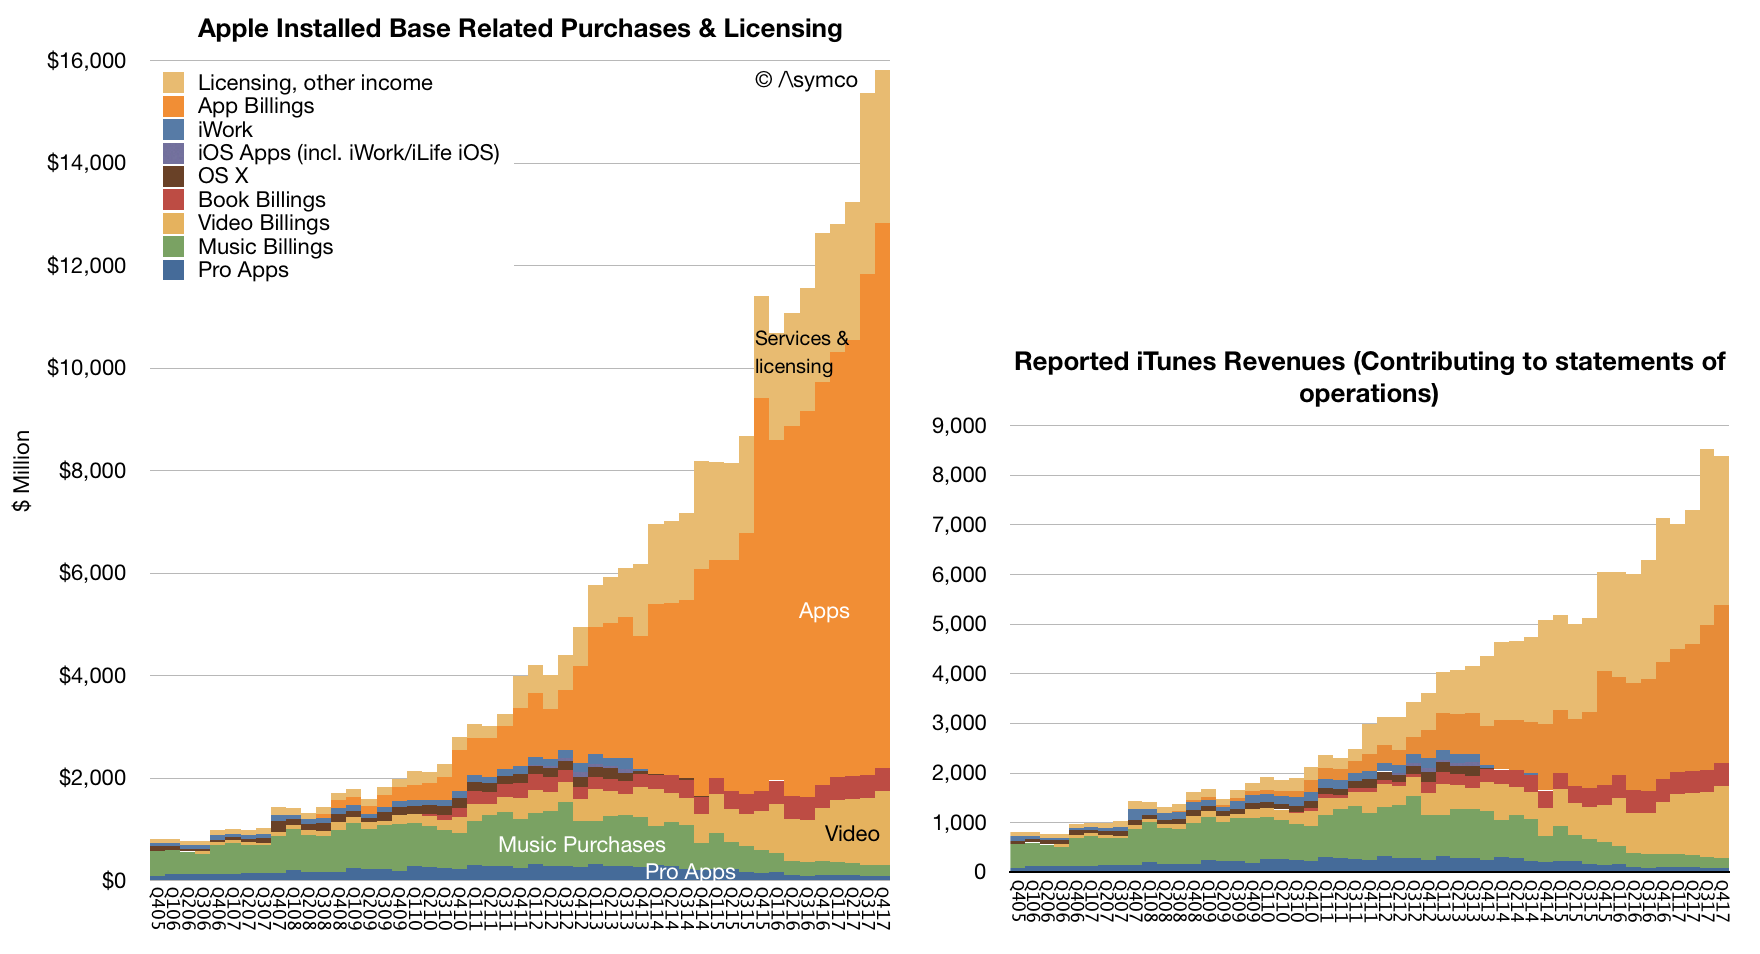
It was another very strong quarter for services with revenue of $8.5 billion, up 18% over last year, and we’re on pace to achieve our goal of doubling our 2016 services revenue by 2020. The number of paid subscriptions across our services offerings passed 240 million by the end of the December quarter, that’s an increase of 30 million in the last 90 days alone, which is the largest quarterly growth ever. [Services has been growing relentlessly for over a decade. This steadiness of growth makes is a juggernaut. Apple is increasingly speaking about subscriptions as the key metric and 240 million is reaching record territory. The rise of Services is shown below (both revenues and consumer spending.)]
We had an all-time record quarter for the App Store with our best holiday season ever. We’re seeing great excitement around augmented reality with customers now enjoying over 2,000 ARKit enabled app, spanning every category in the App Store. In December, when Pokémon GO released its new augmented reality features built with ARKit, it jumped the top of the App Store charts. Last week, on a stop in Toronto, I met developers who are hard at work on creative applications using ARKit from art appreciation to ecommerce, and I was very impressed with what I saw.
Just for months after ARKit launched to the public, we’ve already released ARKit 1.5 in beta to developers around the world, and the response has been tremendous. Augmented reality is going to revolutionize many of the experiences we have with mobile devices. And with ARKit, we’re giving developers the most advanced tools on the market to create apps for the most advanced operating system running on the most advanced hardware. This is something only Apple can do.
In addition to the App Store, several other services had their biggest quarter ever, including Apple Music, iCloud and Apple Pay, all of which saw growth in both active users and revenue.
Apple Pay has reached an important milestone in the U.S. As a result of 50% year-over-year growth in merchant adoption, it’s now accepted at more than half of all American retail locations, which includes more than two-thirds of the country’s top 100 retailers. Now available in 20 markets, global Apple Pay purchase volume more than tripled year-over-year and we’re delighted to be expanding to Brazil in the coming months. [There are no absolute data points on Apple Pay but we do have some scattered growth data. The US data is cited here but in my experience it's more popular in select countries like UK where users are using it habitually]
Today, you can use Apple Pay to take the subway in Guangzhou, China, see a concert at London’s Wembley Stadium or buy a souvenir in Yosemite National Park. In the U.S., we launched Apple Pay Cash in December, and it’s off to a terrific start. Millions of people are already using it to send and receive money with friends and family quickly, easily and securely; to split a bill, pay someone back, or send last minute gift right from the messages app.
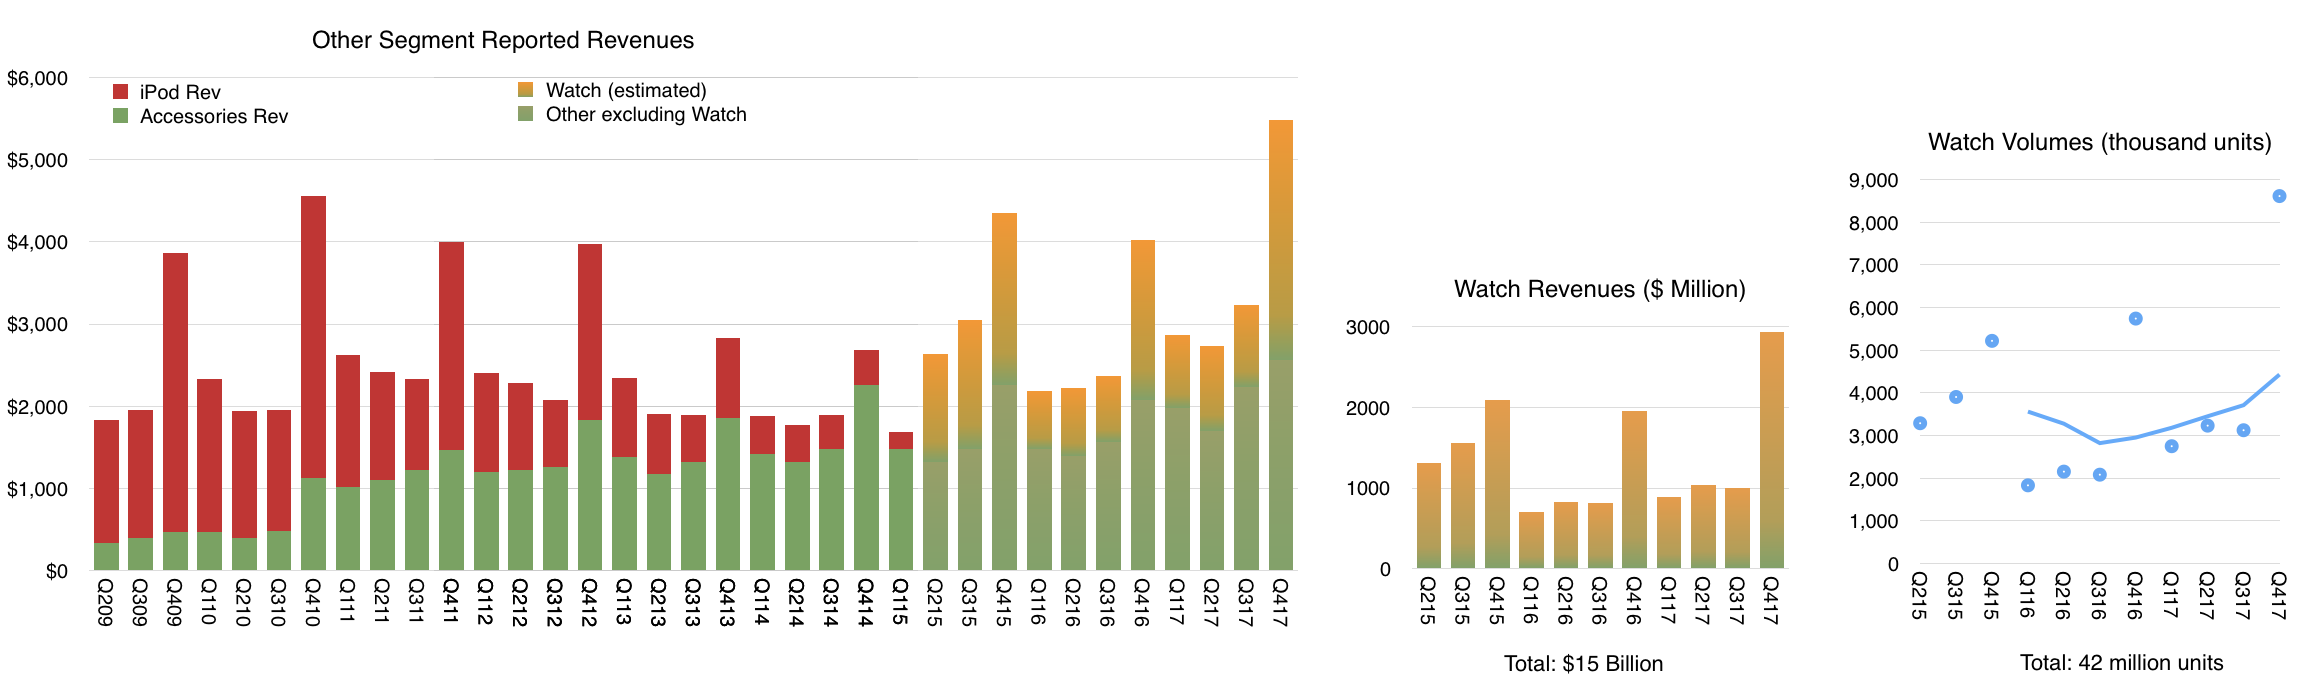
It was our best quarter ever for the Apple Watch with over 50% growth in revenue and units for the fourth quarter in a row and strong double-digit growth in every geographic segment. Sales of Apple Watch Series 3 models were also more than twice the volume of Series 2 a year ago. Apple Watch is the most popular, smart watch in the world and gained market share during the quarter based on the latest estimates from IDC. [Apple Watch is growing consistently. The following graph shows my estimates of volume (total 42 million to date) and revenues (total $15 billion) based on all available data and commentary from management.]
It was the third consecutive quarter of growth for iPad revenue, thanks to the strength of both iPad and iPad Pro. Based on the latest data from IDC, we gained share in nearly every market we track with strong outperformance in emerging markets.
Worldwide, almost half of our iPad sales were the first-time tablet buyers are those switching to Apple, and that’s true in some of our most developed markets, including Japan and France. In China, new and switching users made up over 70% of all iPad sales.
For Mac, we launched the all new, iMac Pro in mid-December. It’s an entirely new product line designed for our Pro users who love the all-in-one design of iMac and require workstation class performance. It's the fastest, most powerful Mac ever, delivering incredible computational power, for simulation and real time 3D rendering, immersive VR and complex photography audio and video projects. Worldwide, 60% of our Mac sales were the first time buyers and switchers and in China, that number was almost 90%.
We're looking forward to getting HomePod in customers’ hands beginning next week. HomePod is an innovative wireless speaker, which delivers stunning audio quality wherever its placed in the home, thanks to the advanced Apple engineered hardware and software.
Together with Apple Music, HomePod gives you instant access to one of the world's largest music catalogs. And with the intelligence of Siri, it’s a powerful assistant you control through natural voice interaction. We're very happy with the initial response from reviewers who've experienced HomePod ahead of its launch, and we think our customers are going to love this new product.
We believe one of the key issues of the 21st century is education. And because of that, we've strengthened our commitment and investment into initiatives like everyone can code. To find the innovators of the future, we need to nurture the students of today. Our App Development with Swift curriculum, which is available free on iBooks, has been downloaded more than 1.2 million times worldwide with almost half of those coming from here in the United States. It’s also being taught in dozens of community colleges across the country, putting practical skills in the hands of today’s jobs seekers.
I was in London two weeks ago as we announced that the program was expanding to more than 70 colleges and universities in Europe. Millions of students around the world will have the opportunity to add Swift to their coding vocabulary and gain skills that are essential for today’s economy.
This is an exciting time at Apple and with the best lineup of products and services we've ever had and a set of initiatives that show how business can be a force for good in the world. We could not be more excited about our future.
Now, for more details on the December quarter results, I'd like to turn over the call to Luca.
Luca Maestri: Thank you, Tim. Good afternoon, everyone. Our business and financial performance in the December quarter were exceptional, as we set new all-time records for revenue, operating income, net income and earnings per share.
Starting with revenue, we’re reporting an all-time record, $88.3 billion, up nearly $10 billion or 13% over the prior record set last year. It is our fifth consecutive quarter of accelerating revenue growth. As you know, the December quarter a year ago spanned 14-weeks compared to 13-weeks this year, which is important to consider as we have set the underlying performance of our business this year. When we look at average revenue per week, our growth rate was even higher at 21% with growth across all product categories for the third consecutive quarter.
Our results were terrific all around the world with double digit revenue growth in all our geographic segments, an all-time quarterly record in the vast majority of markets we track, including the U.S., Western Europe, Japan, Canada, Australia and Korea, as well as Mainland China, Latin America, The Middle East, Central and Eastern Europe, and India.
In Greater China, we were very happy to generate double digit revenue growth for the second quarter in a row and in emerging markets outside of Greater China, we saw 25% year-over-year growth.
Gross margin was 38.4% at the high end of our guidance range. Operating margin was 29.8% of revenue. Our net income was $20.1 billion an all-time record, and up $2.2 billion over the last year. Diluted earnings per share were $3.89 also an all-time record and cash flow from operations was very strong at $28.3 billion.
During the quarter, we sold 77.3 million iPhones, the highest number ever for a 13-week quarter. Average weekly iPhone sales were up 6% compared to December quarter last year with growth in every region of the world despite the staggered launch of iPhone 10. We established all-time iPhone revenue record in nearly every market we track with double-digit growth in all of our geographic segments. iPhone ASP increased to $796 from $695 a year ago, driven primarily by the launch of iPhone 10 and the success of iPhone 8 and 8 Plus.
We exited the December quarter towards the lower end of our target range of five to seven weeks of iPhone channel inventory with less than 1 million more iPhones in the channel compared to the December quarter a year ago, in line with our growth in average weekly unit sales. Customer interest and satisfaction with iPhone are very, very strong for both consumers and business users.
The latest data from 451 Research indicates U.S. customer satisfaction ratings of 96% or higher across iPhone models. In fact, combining iPhone 8, iPhone 8 Plus and iPhone 10, consumers reported an amazing 99% satisfaction rating. And among business customers planning to purchase smartphones in the next quarter, 77% planned to purchase iPhone. Our customers are also incredibly loyal with Kantar's latest U.S. research, reflecting a 96% iPhone loyalty rate, the highest ever measured. [Customer satisfaction is the second most important figure after active user base. Combining these two figures yields the recurring revenue value of the company. Remember what Deming said: the most important measurements for a company's value are the multipliers of a satisfied customer and a dissatisfied customer--these numbers never appear on any financial report but they are applied to all the numbers on every report].
Turning to services. We had a terrific quarter with revenue of $8.5 billion, up 18% year-over-year and up 27% in terms of average revenue per week; that is an acceleration to the 24% services growth run rate that we experienced in the September quarter.
The App Store set a new all-time revenue record. The Store’s all-new design is off to a fantastic start with quarterly store visitors, transacting accounts and paying accounts, reaching new all-time highs. During the week beginning December 24th, a record number of customers made purchases or downloaded Apps from the App Store, spending over $890 million in that seven-day period, followed by $300 million in purchases on New Year’s day alone.
And according to App Annie’s latest report, the App Store continues to be the preferred destination for customer purchases by a very wide margin, generating nearly twice the revenue of Google Play. Across all our services offerings, paid subscriptions reached $240 million with growth of 58% over last year and they were a major contributor to the overall strong growth in services revenue. [Apple has half the user base of Google Android. This is based on Google's May 2017 report of 2 billion active devices vs. the 1.3 billion that we just got from Apple. And yet these users collectively spend twice as much on apps. This ratio of "half the users, twice the spending" has been cropping up in individual developer anecdotes and can also be seen in other metrics of engagement and consumption. This should not be surprising as it conforms to the Pareto distribution of economic value.]
As Tim mentioned, it was our best quarter ever for Apple Watch. And when we add to this us from Beats and AirPods, our total revenue from wearables was up almost 70% year-over-year. In fact, wearables were the second largest contributor to revenue growth after iPhone, which is impressive for a business that started only three years ago. In total, our other products category set a new all-time record with quarterly revenue exceeding $5 billion for the first time. [Wearables now includes more than watches but watches are likely still the dominant product.]
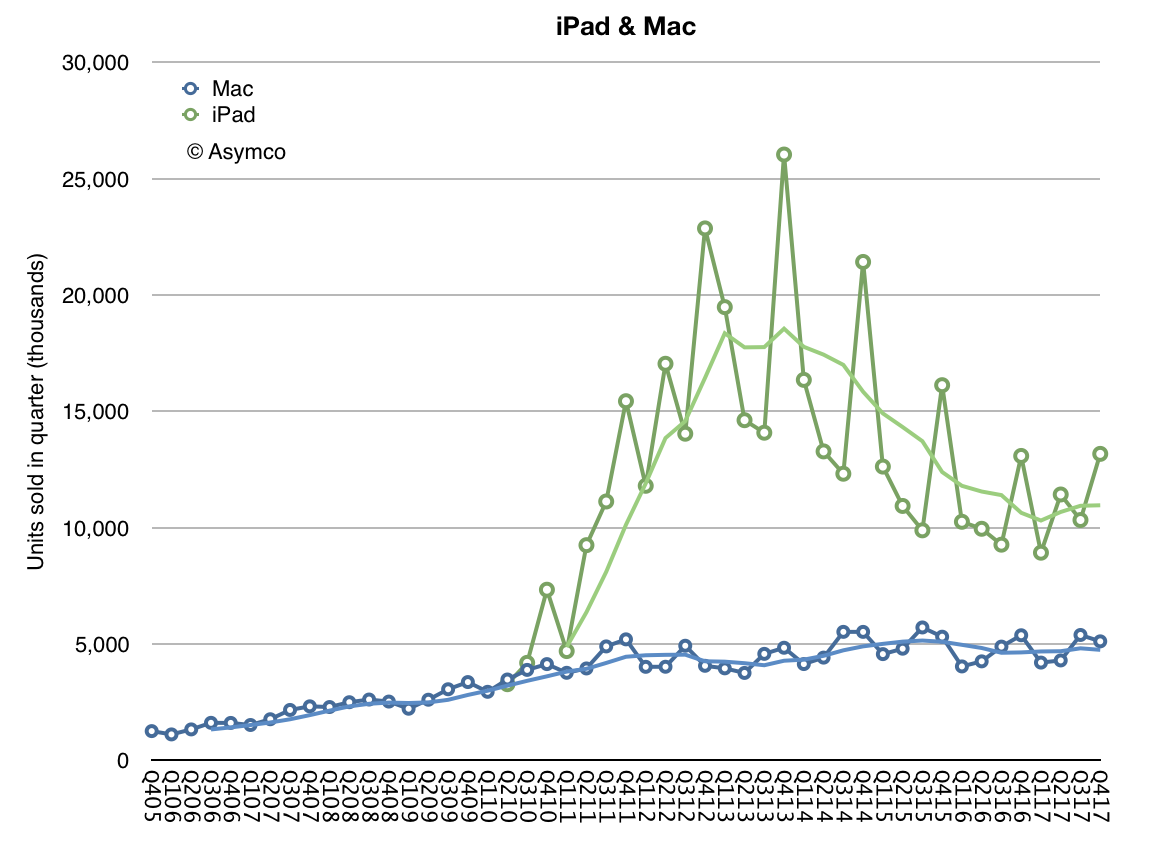
Next, I’d like to talk about the Mac. We sold 5.1 million Macs during the December quarter, which translates to a 2% year-over-year increase in average sales per week. Mac performance was particularly strong in emerging markets with unit sales up 13% year-over-year and with all-time records in Latin America, in India, Turkey and Central and Eastern Europe. On a worldwide basis, the active install base of Macs was up double-digits year-over-year to a new record.
It was also another growth quarter for iPad. We sold 13.2 million units with average iPad sales per week up 8% over last year’s December quarter. iPad sales grew strong double-digits in many emerging markets, including Latin America, the Middle East, Central and Eastern Europe and India, as well as developed markets, including Japan, Australia and Korea. The active install base of iPad has grown every quarter since its launch in 2010, and it reached a new all-time high in December, thanks to extremely high customer loyalty and large numbers of first-time iPad users. [iPad is clearly recovering from a long decline. ASPs are rising as it's being positioned as a PC alternative. Its low end functions are being absorbed by large screen iPhones.]
NPD indicates that iPad had 46% share of the U.S. tablet market in the December quarter, up from 36% share a year ago. And the most recent surveys from 451 Research found that among customers planning to purchase tablets within 90 days, 72% of consumers and 68% of business users planned to purchase iPads. Customer satisfaction is also very high with businesses reporting a 99% satisfaction rating for iPad.
We are seeing great traction in enterprise as businesses across industries and around the world standardize on iOS. For example, Intesa Sanpaolo, one of Europe’s leading banks, has chosen iOS as the mobile standard for its entire 70,000 employee base in Italy; choosing iOS for its security, user interface, accessibility and reliability, Intesa Sanpaolo will deploy native apps to improve employee productivity in customer support, human resources, and marketing across the company.
And LensCrafters, one of the largest optical retail brands in North America, will be using over 7,000 iPad Pros to enable digital eye exams and digital optical measurements in a personalized and interactive experience. We’re also rolling out a new initiative, called Apple AtWork to help businesses implement employee choice programs more easily and offer Apple products company-wide.
Resources from both Apple and our channel partners will enable enterprise IT and procurement teams to buy or lease Apple products more efficiently, streamline the setup of iPhone, iPad, and Mac, and deliver a seamless onboarding experience for employees. We launched the program with CDW in the U.S. last week, and we would be expanding to more channels and regions later this year.
The December quarter was extremely busy for our retail and online stores, which welcomed 538 million visitors. Traffic was particularly strong during the four-weeks following the launch of iPhone 10, up 46% over last year. And across the quarter, our stores conducted over 200,000 today at Apple sessions, covering topics including photography, music, gaming, and app development, and art and design. Just last weekend, we opened our first store in Seoul, Korea and we’re looking forward to opening our first store in Austria in a few weeks. These newest openings will mark the expansion of our retail store presence to 21 countries.
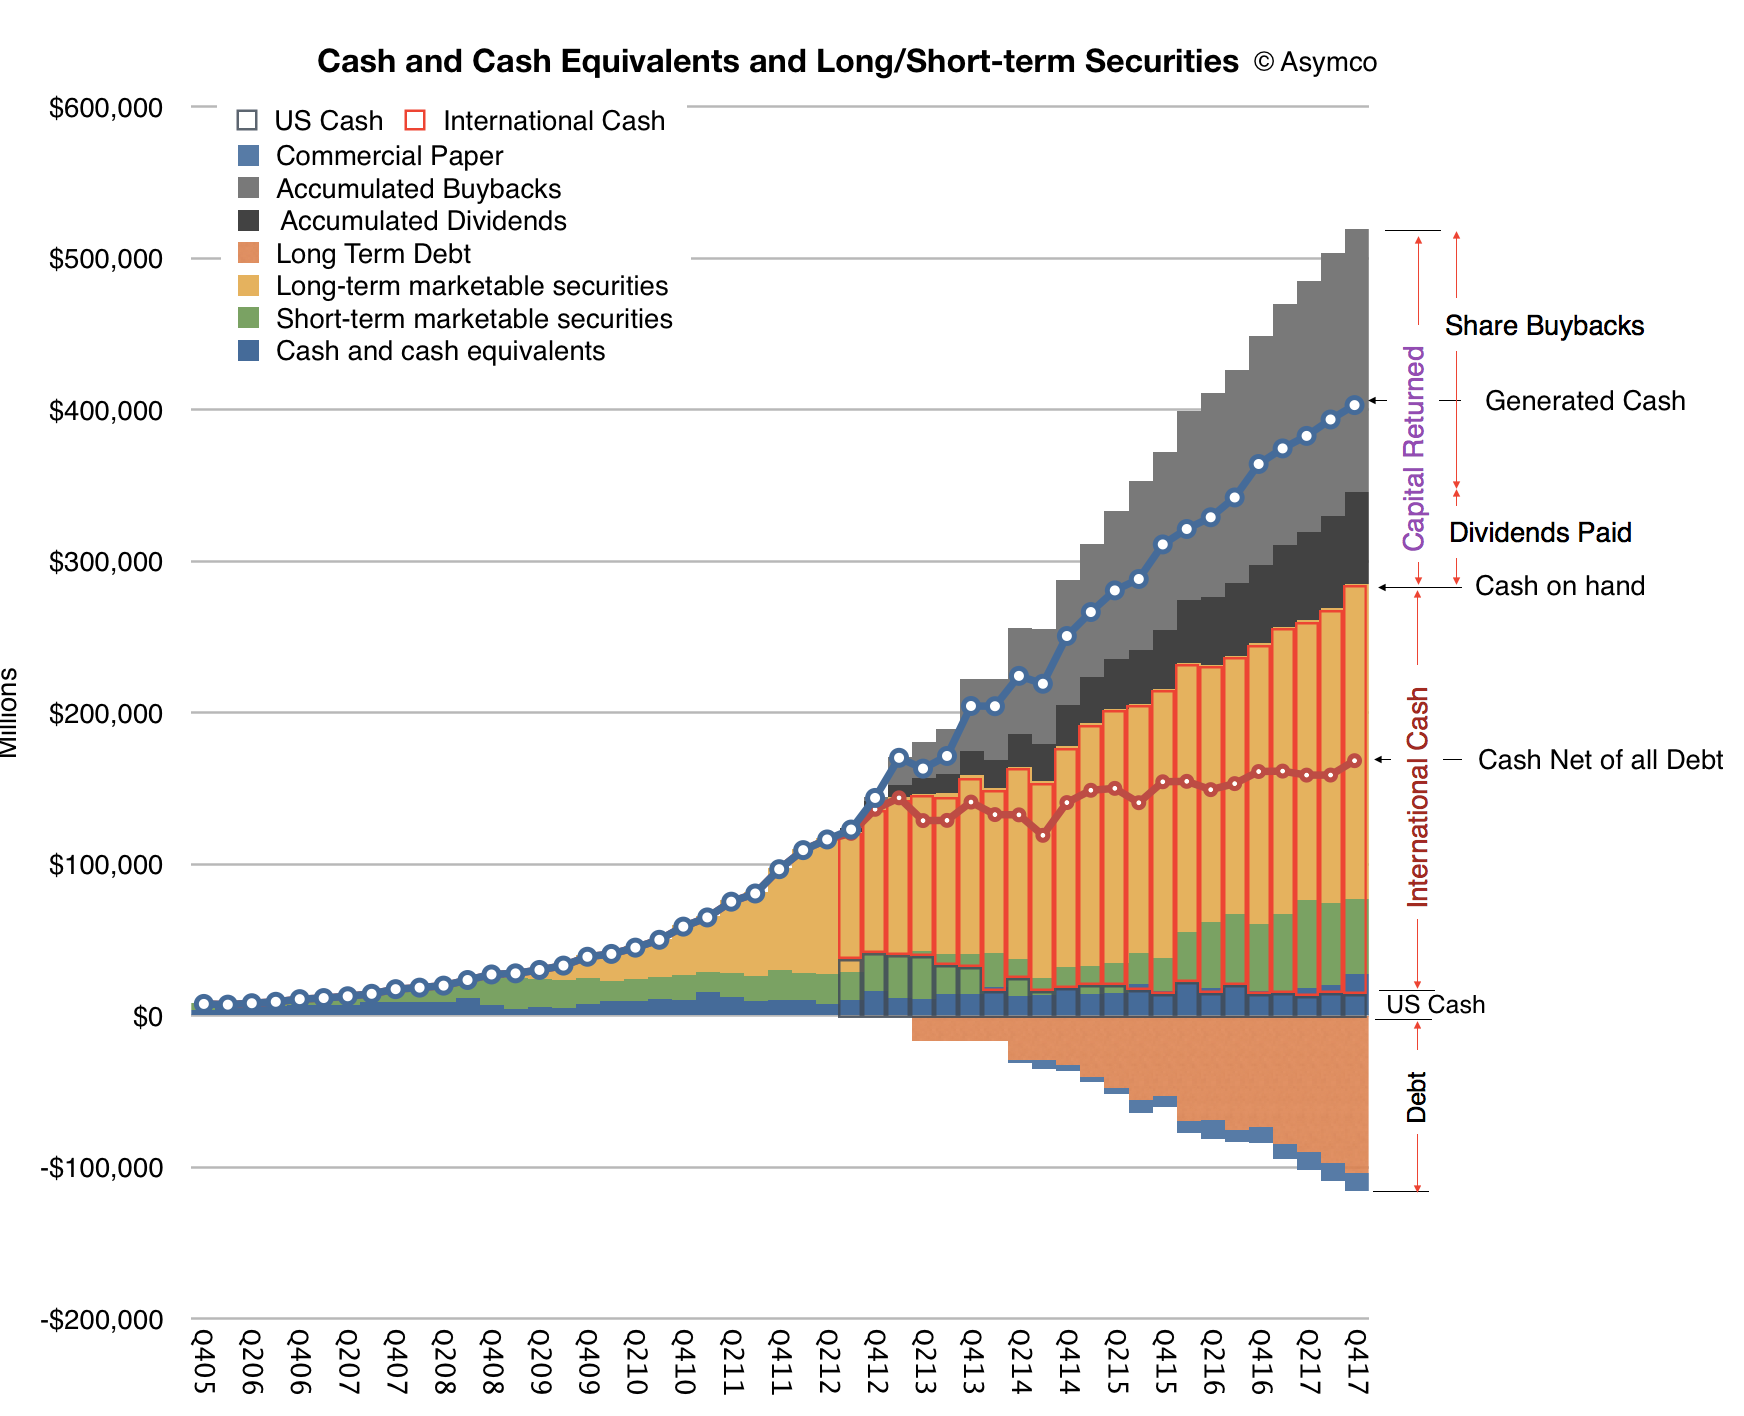
Let me now turn to our cash position. We ended the quarter with $285.1 billion in cash plus marketable securities, a sequential increase of $16.2 billion. $269 billion of this cash, or 94% of the total, was outside the United States. We issued $7 billion in debt during the quarter, bringing us to $110 billion in term-debt and $12 billion in commercial paper outstanding, for a total net cash position of $163 billion at the end of the quarter. We also returned $14.5 billion to investors during the quarter. We paid $3.3 billion in dividends and equivalents, and spent $5.1 billion on repurchases of 30.2 million Apple shares through open market transactions.
We launched a new $5 billion ASR program, resulting in initial delivery and retirement of 23.6 million shares and we retired 3.8 million shares upon the completion of our 12th ASR during the quarter. We’ve now completed over $248 billion of our $300 billion capital return program, including $176 billion in share repurchases against our announced $210 billion buyback program with $34 billion remaining under our current authorization. [An updated look at Apple's cash is shown below]
Turning to taxes. Due to the recently enacted legislation in the U.S., we estimate making a corporate income tax payment of approximately $38 billion to the U.S. government on our cumulative past foreign earnings. This amount is very similar to what we had been accruing on those earnings in our financial results through fiscal year 2017, including the $38 billion payment. We will have paid over $110 billion of corporate income tax on our total domestic and foreign earnings during the last 10 years for a cash tax rate of about 26%. [Apple has paid more tax than any company in history, and is about the make the largest single payment to the US Treasury.]
Our tax rate of 25.8% for the December quarter was close to our guidance of 25.5% as the lower U.S. statutory rate from the new legislation was effective offset by the remeasurement of deferred tax balances.
As we move ahead into the March quarter, I'd like to review our outlook, which includes the types of forward looking information that Nancy referred to at the beginning of the call; we expect revenue to be between $60 billion and $62 billion; we expect gross margin to be between 38% and 38.5%; we expect OpEx to be between $7.6 billion and $7.7 billion; we expect OI&E to be about $300 million; and we expect the tax rate to be about 15%.
Tax reform will allow us to pursue a more optimal capital structure for our company. Our current net cash position is $163 billion. And given the increased financial and operational flexibility from the access to our foreign cash, we are targeting to become approximately net cash neutral overtime. We will provide an update to our specific capital allocation plans when we report results for our second fiscal quarter, consistent with the timing of updates that we have provided in the past.
Finally, today our Board of Directors has declared a cash dividend of $0.63 per share of common stock, payable on February 15, 2018, to shareholders of record as of February 12, 2018.
In the fourth quarter of 2013, mobile phone sales in mature regions fell due to weaker demand."Mature markets face limited growth potentialis the markets are saturated with smartphone sales, leaving little room for growth with declining feature phone market and a longer replacement cycle," said Anshul Gupta, principal research analyst at Gartner. "Lack of compelling hardware innovation has further exacerbated replacement cycles for high-end smartphones in 2013 because consumers don't find enough reasons to upgrade." - Gartner
Anshul Gupta's assertion of market saturation was not the first. IDC also cited "a number of mature markets nearing smartphone saturation" in late 2013.
Shortchanging the smartphone market is nothing new. It was happening very early in the market's formation when initial growth was not as rapid as expected. I recall Nokia managers disappointed with sales growth losing faith in smartphones in 2004. Eleven years later, the market is still growing.
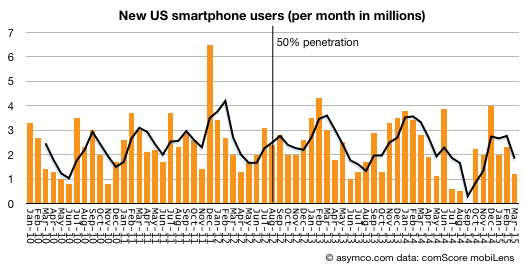
comScore reported that during the first quarter of 2015 the US market was adding over two million new smartphone users every month. These are not two million units sold every month but two million new users who began using smartphones for the first time ever, every month.
Since the end of 2013 when both IDC and Gartner declared the onset of saturation in "mature regions" ((The US is the most mature by penetration data)) 31.5 million new-to-smartphones Americans adopted the product. That's an addition of 11% of the sampled market.
And the sampled market is just a subset of the addressable market. comScore only counts 'primary phones' in use and excludes company-purchased devices and any users below age 13.
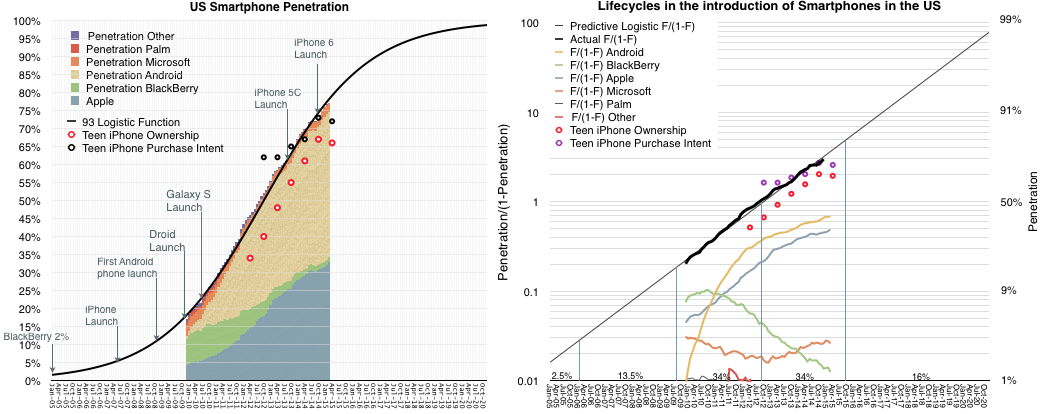
So according to comScore's data, the US market is at 77% smartphone usage. My assumption is that saturation would come at the earliest at 90% and could be 100%. ((Of the market comScore measures)) The fact that conversion to smartphones is still proceeding at roughly the same rate it has been for five years, makes this assumption pretty safe.
The pattern of growth fits a diffusion S curve (Logistic curve) as closely as ever:
Note that the curve continues to rise even into 2020, and that this is the US only.
The US is the most highly penetrated market but it's not the biggest. That would be China. So it's not surprising that two years after declaring US growth was over, IDC claims "China's smartphone market has reached saturation".
Chinese penetration is far below the US. It was estimated at 43% by the end of 2014. If we assume Chinese users are no less hungry for information than US consumers, then why should Chinese stop adopting the technology at less than half of US levels of use?
That would be risky.
This understanding of the maximum potential of a market — its highest level of user adoption — is crucial for product development. Paying attention to short term sales trends blinds you to the power of the job your product is hired to do. Your product's purpose is not to be sold, but to be hired. If your product is powerful enough, it can be hired for universal jobs and it should be desired by all consumers, not just the fickle.
Being patient for growth means that you can release features when the majority of users can absorb them, not just when early adopters choose to play with them. Often, early adopters offer feedback which is off-putting to later, mainstream adopters. In engineering and design one has to always make compromises. The right balance at the right time avoids overshooting a market or under-performing against competitors.
There are plenty of examples of getting it wrong (see the graph on the right above).
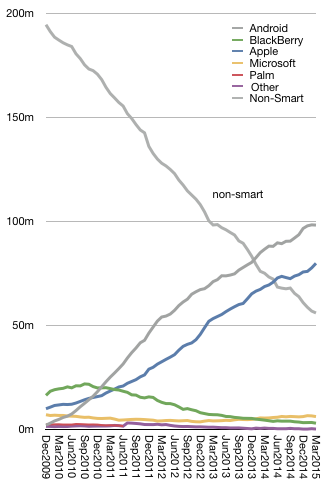
At this stage in the US market, the iPhone has more than 80 million (sampled) users. Android has about 100 million. It's still a growing market so apart from BlackBerry, ((Three million BlackBerry users in the US remain.)) the churn between the smartphone platforms is still minimal. The two main platforms are still harvesting non-consumers.
This will change of course. And when it does, the competition will shift from winning against non-consumption to winning against other-consumption or over-consumption. That post-saturation competition will be decided by brand loyalty as much as anything else.
---
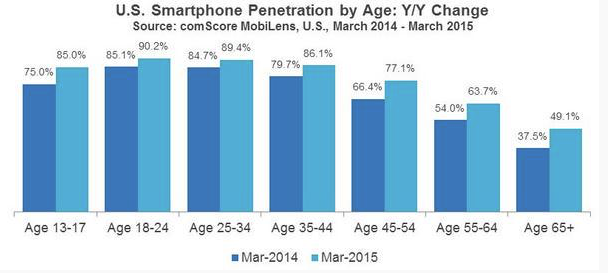
Update: comScore just published US Smartphone penetration by Age which offers some clues where smartphone hiring is still going on. (Note: <13 ages are not shown).
Gartner's own press release has an interesting spin:
"After Two Years of Decline, Worldwide PC Shipments Experienced Flat Growth in Second Quarter of 2014, According to Gartner"
Gartner's actual figure is 0.1% growth. Gartner and IDC measure slightly different quantities as "PC" but they don't disagree much. IDC still shows declining PC sales at about -1.7%. However both also include the Mac in their accounting of PC. If we were to remove the Mac and measure "Windows PC" ((In quotes because this total includes Linux and Chromebook)) Gartner's figures would show -0.8% drop in PC ex-Mac shipments.
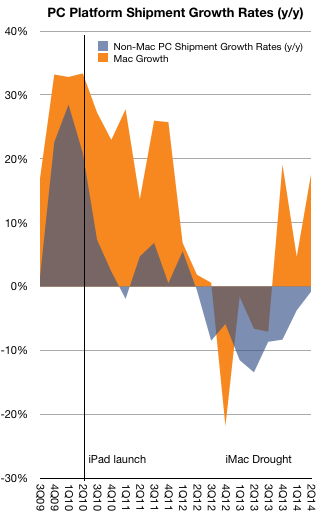
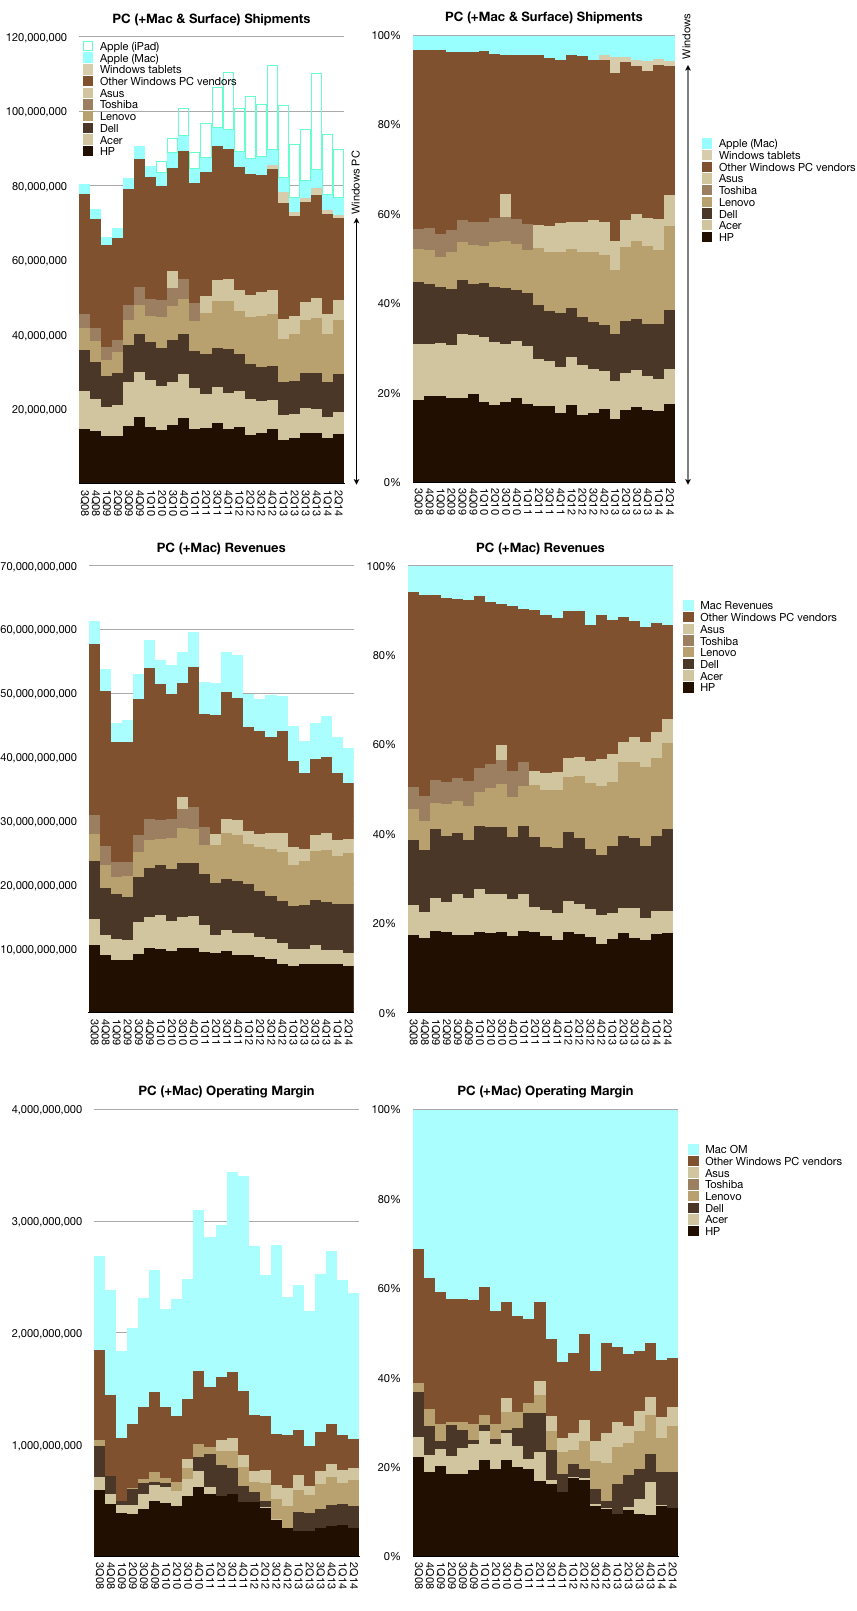
The difference in growth between the Mac and non-Mac PCs is shown in the following graph.
As Apple puts it, the Mac grew faster (and hence gained share) for 31 out of the last 32 quarters. It missed on this perfect record during the fourth quarter of 2012 when the then fresh new iMac was impossible to buy due to production issues.
So as far as the Mac is concerned the slowing of the decline in PC unit shipments isn't at its expense. What has been discussed as a cause for the moderation of market contraction is the expiration of Windows XP support. Certainly that seems plausible and is supported anecdotally. If it's true then the PC respite may be transient.
To put a finer point on it, it would be useful to know revenues and profits in addition to volumes. Thanks to Charles Arthur for providing most of the data that allows this picture to be drawn:
The revenue pictures shows that (non-Mac) PCs have been declining for almost four years and into the present quarter and operating margin ("profit") has shrunk to nearly $1 billion (while being generous with "other" PC vendors).
Incidentally, the Mac is nearly the highest revenue PC brand and by far the most profitable. Indeed, it's more profitable than all the other vendors put together.
If one includes the Mac, the PC industry may be limping along, but if we were to exclude it then this post conforms to Betteridge's law of headlines.
Because that is an estimate. Of the 104 million Android phones shipped in the quarter (itself an estimate from another, possibly different methodology), I could only account for 7 million actually reported. That figure comes from a close reading of an investor presentation from Sony. HTC does not report their shipment numbers. It stopped some time late last year. Neither does Motorola now that it's a part of Google. Huawei is silent except for setting targets and ZTE published a press release citing IDC's estimate of its own shipments.
But most glaring of all is the absence of any mention by Samsung of its performance. The company stopped reporting any data on either overall phone shipments or of smartphones within that total since Q3 2011. We may have been able to estimate Samsung if we had more competitor actuals, allowing us to back into a figure. But we don't.[1]
Which leaves us with IDC's estimate[2]. But the problem is that since the industry is growing so quickly it is very sensitive to assumptions. Consider how difficult it is for consensus estimates for Apple's iPhone shipments to come near the actuals--and that's for one quarter, and knowing all the previous quarters with precision. The absence of visibility into the assumptions made by market analysts (or their methods) should lower confidence in the results.
Consider that IDC specifies 50.2 million Samsung smartphones, implying an accuracy down to 100,000 units. Is this accuracy believable?
There is reason for doubt.
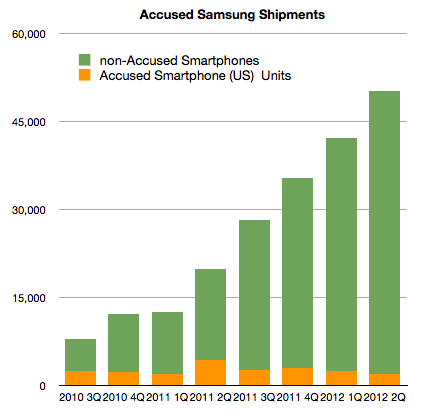
I start with the following graph:
It shows the estimates for Samsung global shipments (latter four quarters are estimates without the benefit of company reports.) I separated the component of shipments that Samsung reported as part of its submission to the Samsung v. Apple trial in California. Note that this (orange) segment consists of most US smartphone shipments. It's not all US Samsung shipments. It notably excludes the Note, the latest Nexus and the Galaxy SIII.
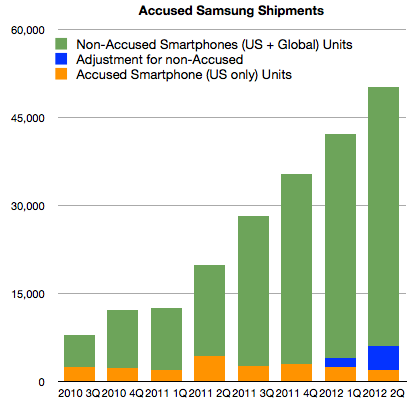
Without these "non-accused" phones, it would appear that Samsung's US volumes dropped to 4% of global totals from a 10% average[3]. In order to return to 10%, the US totals would need to be adjusted as shown below:
I added 1.5 million units in Q1 and 4 million units in Q2 (to account for Galaxy SIII).
So far this seems consistent with the total estimated global shipments of 50.2 million from IDC. US units would result in 12% of global shipments.
However, there is more data we can test against. First, we are also given pricing for the US phone portfolio, or at least we have revenue per unit sold. This allows us to get an idea of what revenues can be obtained for the smartphones in the US, and possibly world-wide[4]. Knowing prices for smartphones and knowing global sales (which Samsung reports) and finally knowing global total phone shipments allows us to price the average non-smart phone.
Excluding the non-accused smartphones, the average revenue per smartphone in the US for Samsung in Q2 was $339. Adding in the estimated Galaxy SIII (4 million) at an average price of $470 gives a new "ASP" of $413.
This is where the analysis goes off the rails.
If we assume the global ASP is equal to the US ASP and knowing everything else about the mix of smartphones (54% of total) and revenues (as reported) yields a negative ASP for feature phones. Assuming the revenue figure is correct, either the number of smartphones is wrong (50.2 million) or the global ASP ($413) is wrong. The total phone number is also an analyst estimate which can be called into question.
There are many assumptions being multiplied here so I have very low confidence in the result, but we should ask "what do you need to believe" in order for the 50.2 million figure to be real. The following scenario for example has to be true:
Global Samsung phone shipments total 93 million units (which means 42.8 million feature phones sold as well as the 50.2 million smartphones).
6 million smartphones shipped into the US, equivalent to about 50% increase y/y, roughly in-line with market growth
4 million Galaxy SIII shipped (but not necessarily sold through) at an ASP of $450. This results in a US total smartphone ASP of $413
The global smartphone ASP is significantly lower (at 80% of the US or $330)
Global revenues of $18.14 billion is essentially all from phones
Global feature phones will have an average price of $36
If these conditions are met then it's possible that 50.2 million Samsung smartphones did ship.
The figure for feature phone ASP is difficult to accept as it would be lower than Nokia's. Also, the low global smartphone ASP is also difficult to accept but it might be possible to find a scenario with the above variables which makes the 50.2 million figure believable.
Unfortunately this is an unsatisfying analysis. I could propose another figure to answer the question in the title, based perhaps on more "believable" assumptions. But I have no means to defend my assumptions. The only option I have remaining is to caution that the total smartphones shipment estimate for Samsung remains precarious. The new evidence from the US trial places more doubt on it but it is not enough to disqualify it entirely.
---
Notes:
This cone of silence over 93% of the most popular mobile platform is somewhat puzzling in contrast to the perfect information we are used to having about iOS, BlackBerry and even Symbian. It seems that the more open a platform, the less is revealed about its market performance. This extends to the licensed Windows Phone whose shipments are only revealed through Nokia's reporting of Lumia shipments.
In the PC market, vendors also selectively publish their units. The norm is, however, not to. As a result IDC et. al. are the only sources for global market data. However, the PC market can be sampled more easily than the phone market. PC retail measurement methods are more reliable compared with all the points of sale for phones.
Note that Apple sells about 30% of iPhones in the US.
Apple's pricing world-wide is very consistent with pricing in the US which makes sense from a channel management point of view. One would not want to create incentives for cross-border arbitrage of phones.
Markets are difficult to measure. Mainly because the information is not easy to obtain and that which is obtained is not made public. Collecting, analyzing and filling in the gaps is big business with many firms involved in selling it.
However, with all the analysts and companies selling and promoting their "numbers" it's important to understand the difference between the methods used. There are for instance at least the following measurements:
Units sold to end users. For example NPD or GfK data of retail transactions. Also Gartner's estimates for phone units sold.
Units sold to the channel. For example units recognized on income statements usually reported by companies. Also IDC's estimates for phone units sold.
Units in use. For example comScore and Nielsen survey data.
Units "activated". The measurement Google uses to describe Android performance.
Intent to buy. For example ChangeWave surveys of early adopters.
Utilization rate. For example browser statistics.
Each measurement tells a different story about the market but the best story is told when all data is analyzed in a combined integrated market review.
Before diving into that it's important to understand the difference between the first and second measurements or the difference between shipped and sold.
What does "Sold" mean?
Let’s say that you sell a phone to another party. What constitutes a sale? The sales agreement? That you shipped it? That he wanted it? That you were paid for it?
What if he changes his mind and returns it? Is it still a sale? What if a manager's bonus depends on these sales? What if the company’s share price depends on these sales? Is there a way to rig the accounting?
As it turns out, yes there are; many ways. Unethical and fraudulent practices happen surprisingly often. A classic instance would be: A customer is shipped ten phones, though he only wants one, and he gets paid to ship the other nine back, after the close of the year.
The sales manager records ten times the sales he actually made, making ten times the commission and the company’s stock price rises. To compound the offense, the manager could also tip his friends to short the stock at the end of the year, leaving investors “holding the bag” when the inevitable correction follows.
There have been so many cases of this kind of accounting fraud that the FASB (GAAP), SEC, and IFRS have placed a very stringent definition on “revenue recognition”. This means that although you can sell all you want, the company can only recognize the proceeds and profit in the financial statements according to strict rules.
In the case of hardware (Sales of Goods), the customer must receive it (“delivery has occurred”), and like it enough to not return it (“amount to be refunded”), and be able to pay for it (“collection is probable”). If some are projected to be returned or unpaid, that percent is subtracted from total revenue. In the case of software (Sales of Services), it is generally accounted for over a time period. And because it is customary to send the customer upgrades, the revenue must be spread out over the time the service is provided. (“upgrade rights … 24 to 48 months.”)
It gets complicated when a piece of hardware has upgradeable software. The rules used to stipulate that the hardware, in its entirety, must be accounted for as a service and have subscription accounting. This is how Apple had to report sales during the first few years of the iPhone. It still defers some revenues for its hardware, mainly on account of iCloud, but the vast bulk of hardware revenue (96%) is now accounted upfront, recognized upon the product's acceptance by customers. 4% is for software upgrades and is accounted for over a specific lifetime of the product (24 months in the case of the iPhone).
What does "Shipped" mean?
The discussion so far implies that if a product that is accounted for as "Sold" on an income statement does not mean that it's in the hands of an end user. These "revenue recognized" products are sold to a distributor, typically for a phone that's an operator.
These sales satisfy the requirements for financial reporting as revenues booked. But they are not in the hands of users. Nor are they "activated" and they don't generate page views that are measured by web analytics companies. Most analysts and companies now use the phrase "Shipped" to describe these revenue-recognized units though it's also common to hear "sold".
When a product sells to end users it's sometimes called "sell-through". It's counterpart is "sell-in" which is sales to the channel distributors.
A big gap between sell-in and sell-through might imply large amounts of in-channel inventory. This is product that is sitting either in stores or in warehouses or on trucks in transit. If sales are steady, the inventory is measured in time as in "weeks of inventory". This means that the excess is expected to be sold within a fixed time frame if shipments were to end. The smaller this amount, the better or "tighter" the operations are. Inventory, as Tim Cooks says, is fundamentally evil. It eats capital and erodes profitability.
Sometimes miscalculation of sell-through could result in vast amounts of inventory that has to be returned by distributors. That inventory is either written off or sold at fire sale prices resulting in a "write-down". This happened recently with both the HP TouchPad and with the RIM PlayBook. This special charge against income is a one-time (usually) incident but it can also affect a firm's reputation with channel partners for a long time. This type of failure is very costly.
Therefore what matters most is to keep the difference between Sell-in and Sell-through as small as possible. However, it can't be too small. Sometimes if Sell-through is too fast, you get stock-outs which means that there is more demand than supply and sales opportunities are missed. This has happened many times with iPhones and iPads. This is also an unwanted situation (unless there was too much inventory in the channel during the previous period and thus it was being drained in the current period.)
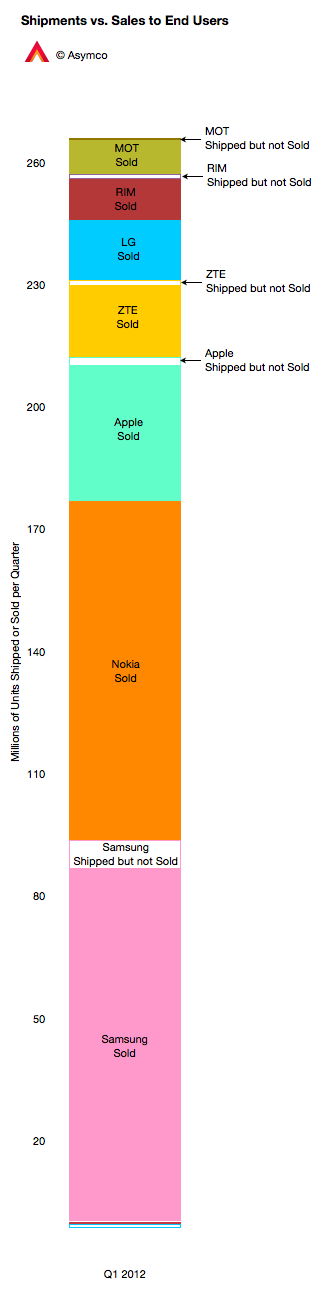
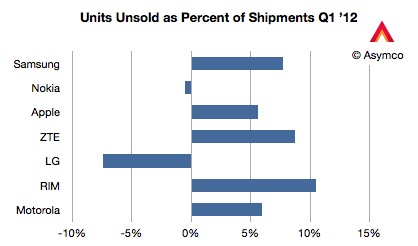
The chart to the left shows how the phone market looked for various vendors last quarter. I compiled the data based on Gartner's "sales to end users" and IDC's "shipments" data. Two vendors had higher sell-through than sell-in (Nokia and LG) probably because they were draining excess inventory. The others had channel inventory of between 5% and 10% of units shipped.
This ratio is shown below in a chart comparing the largest phone vendors.
Management is often rated for performance on this metric, as they should be, since it's a measure of operational skill. However, there are many factors that affect overall performance.
New product launches, windows of opportunity related to seasonal buying patterns, anticipating macroeconomic slowdowns, even natural disasters and legal challenges can affect this metric.
Understanding the overall market requires an appreciation of this distinction but also an understanding of all the other metrics listed above and what stories they tell.
---
Notes: My thanks to Michael Dediu for input on this discussion.
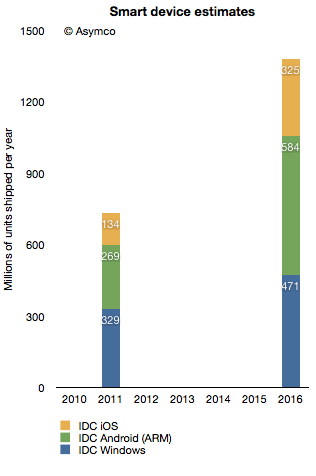
In terms of platforms, IDC expects a relatively dramatic shift between 2011 and 2016, with the once-dominant Windows on x86 platform, consisting of PCs running the Windows operating system on any x86-compatible CPU, slipping from a leading 35.9% share in 2011 down to 25.1% in 2016. The number of Android-based devices running on ARM CPUs, on the other hand, will grow modestly from 29.4% share in 2011 to a market-leading 31.1% share in 2016. Meanwhile, iOS-based devices will grow from 14.6% share in 2011 to 17.3% in 2016.
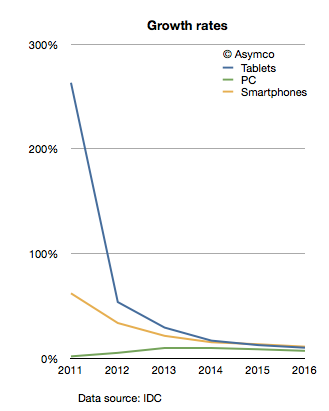
The company provides a stacked bar chart (follow link above) to illustrate their view of the market. I took the data they included and measured the implied growth rates for the product categories:
IDC is implying that in four years the tablet market will be growing at 10%, the Smartphone market will grow at 11% and the PC category will grow at 11%. In other words, five years from now the PC market is expected to grow faster than the tablet market and just as fast as the smartphone market!
What's more remarkable is that this situation is not going to happen in four years. The slowdown in growth is actually expected much sooner. The growth rates two years from now are expected to be: Tablets 17%, Smartphones 15% and PC 10%. IDC is unequivocal: by 2014 the good times will come to an end to the post-PC challengers. These growth rates would be catastrophic for share prices and the value propositions of the new platforms to developers, partners and consumers.
What's more, these growth rates are striking not only because they predict a collapse in the value of most market challengers but that they also predict a strongly resilient PC market. How can we test this forecast?
I tried to reconcile this doomsday scenario with what is known about the components making up the data. I.e. what "bottom-up" data is IDC using? In the quote above, IDC offers some insight into this market participant data. Based on the category and share data they published it's possible to infer the following:
Bearing in mind that neither iOS nor Android existed five years ago, we can observe they are bigger together than the PC market. And yet, IDC predicts a compounded average yearly growth rate of 16.7% in Android, 19.4% in iOS and 7.5% in Windows between today and 2016.
In aggregate, IDC forecasts that in the next five years Android will not manage to double and that iOS will only increase by a factor of 2.4. Is this believable?
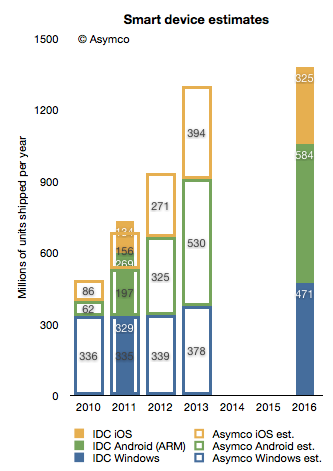
I try to stay away from long term forecasts, but I do maintain a short term forecast based on recent growth data. My forecasts for this year and next year are shown below.
I super-imposed my short-term forecast (outline bars) on IDC's long term forecast (solid bars) and a several differences become apparent.
First, my 2013 forecast is nearly the same as IDC's 2016 forecast. To see why we need to look at each platform separately.
Perhaps we might (with difficulty) agree on Microsoft's potential. I believe Windows 8 will have a catalyzing effect and that Microsoft will begin to see its platform grow again. However, my expectations are modest. To increase Windows sales rate by 100 million units/yr between 2013 and 2016 is possible but ambitious.
The real problem is that our Android and iOS forecasts are outside any zone of possible agreement. Maybe there is a difference in what we measure. For a hint, we seem to disagree on the number of Android devices shipped in 2011. I used Google's own reports of activations to work out the yearly shipment estimates. Perhaps IDC is including versions of Android that are not Google sanctioned.
We also disagree on the 2011 iOS figures. I obtained 156 from Apple's own reports. Again, perhaps the difference is the inclusion of the iPod in my case.
Nevertheless, the difference in the long term cannot be accounted for only through these categorization differences. I would put the cause of the difference down to the methods used in forecasting. As can be seen from the first chart above, IDC's growth rate reductions are extraordinarily steep. Perhaps the approach used by IDC was to forecast the overall market growth and then assignment of shares to participants. This can be called the "top-down" approach. In contrast, my approach is to forecast growth rates based on recent growth rates and moderating these rates gradually. This can be called the "bottom-up" approach.
My experience and all the data I've ever collected about historic disruptions tell me that the entrants tend to win these types of paradigm shifts. They win through a vast expansion of consumption and the recruitment of non-consumers. Markets tend to experience vast shifts in composition. If we believe this to be true then the bottom-up approach focused on entrants is likely to be more effective vis-a-vis the top-down approach of projecting steady state markets and the implicit assumption of incumbent share preservation.