Recording and transcript of the June 9, 2026 Asymco One Office Hours, recorded the day after Apple's WWDC 2026 keynote. Horace Dediu shares his impressions of the event and takes questions from Asymco One subscribers.
TrendForce’s latest figures reveal that global smartphone production reached around 284 million units in the first quarter of 2026, marking a 1.7% YoY decline. Despite a sharp rise in memory prices since the second half of 2025, the effect on production was minimal because brands still held inventories of cheaper memory components. Additionally, consumer expectations of higher prices in the future have helped sustain short-term demand, cushioning the impact of rising memory costs on production during the quarter.
However, as low-cost memory supplies are gradually exhausted and significant ongoing increases in memory prices reduce profits, most smartphone brands have begun adjusting production in the second quarter.
Looking ahead, TrendForce forecasts global smartphone production to decline approximately 16.2% YoY to 1.051 billion units in 2026. Under a more severe scenario, the annual decline could become even more pronounced if memory price increases remain elevated and brands are forced to raise retail prices repeatedly.
TrendForce notes that Samsung is relatively well-positioned to withstand the current cost inflation cycle thanks to strong financial backing from the broader Samsung Group and a sizable premium product portfolio. Nevertheless, its significant exposure to lower-end models remains a concern—particularly amid weakening consumer sentiment—making end-market demand a key factor to monitor.
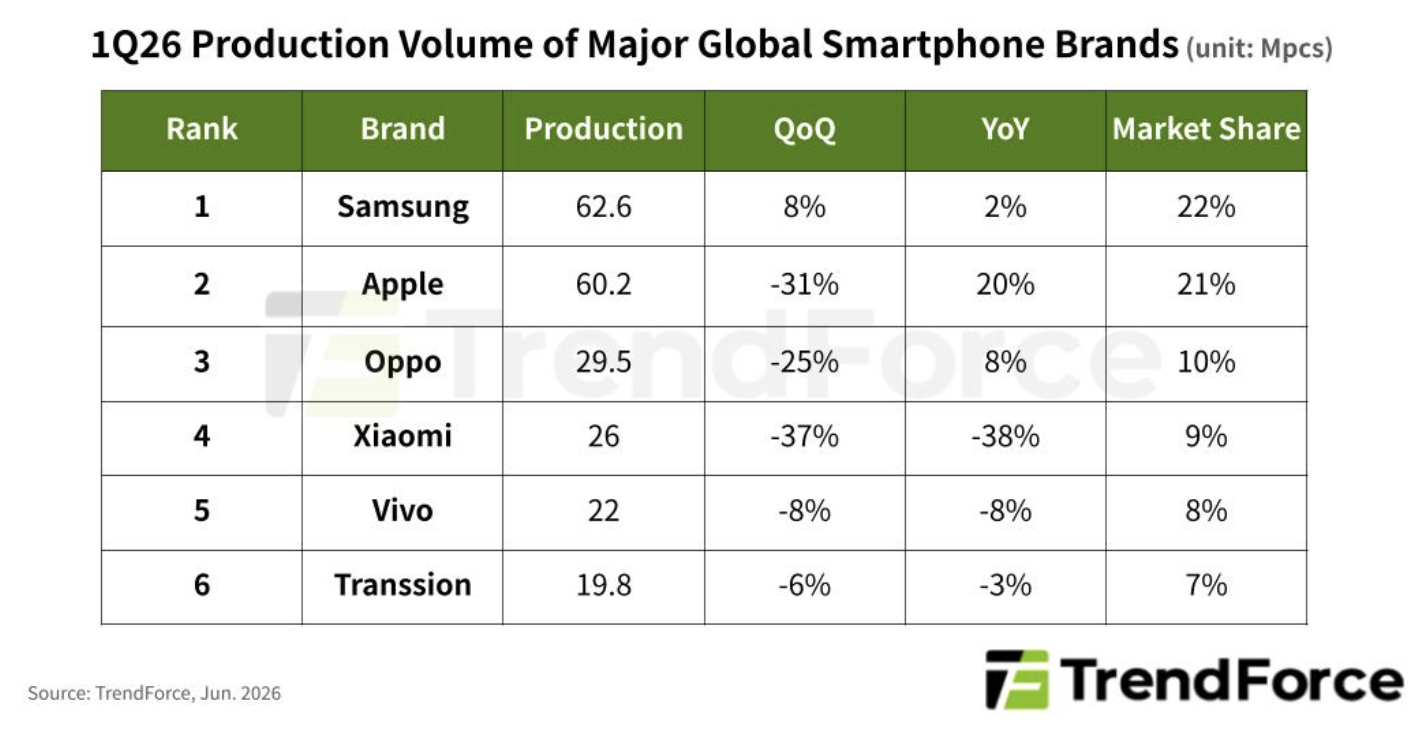
Apple ranked second with its production of approximately 60.2 million units during the quarter. In addition to ongoing production ramp-up for new iPhone models, output was supported by the launch of the iPhone 17e, resulting in 19.7% YoY growth.
Compared with competitors that have already entered a margin-protection phase, Apple remains better positioned to absorb higher memory costs while maintaining profitability. TrendForce believes Apple is more likely to prioritize market share expansion during the current downturn as it lays the groundwork for future growth in recurring software and services revenue.
Xiaomi, Oppo, and Vivo focus on preserving profitability as production plans face greater uncertainty
First quarter production declined seasonally among the major Chinese smartphone brands, including Oppo (29.5 million units), Xiaomi (26 million units), and Vivo (22 million units). These three brands ranked third through fifth globally by production volume.
While all three delivered strong market share gains in previous years, surging memory costs are now weighing heavily on profitability, creating significant uncertainty around their 2026 production plans. As a result, production targets may be revised downward if cost pressures persist.
Transsion produced approximately 19.8 million units in 1Q26, roughly flat compared with the same period last year, placing sixth among global smartphone brands.
The brand has been particularly vulnerable during the current memory price supercycle given its smartphone portfolio is heavily concentrated in entry-level and budget segments—where profit margins are already thin. Limited access to low-cost component inventories has further amplified the impact.
NB: Counterpoint tracks sales, Trendforce tracks production. The production data may include inventory build-up not shown in sales while sales may include drawdowns not shown in production. The two analyses however agree on a market under significant supply-side stress. Profitability is a big concern and availability of components is critical. As noted previously in response to Counterpoint reports, the 2026 full year volumes will probably show the worst decline in decades.
Apple has cumulatively shipped over 450 million Apple Intelligence-capable iPhones till Q1 2026.
Apple has the largest number of smartphones with consumers which are capable of GenAI as compared to any other brand.
At WWDC ‘26, Apple needs to deliver a revamped Siri showcasing practical use cases, making a strong statement.
Although iPhone sales remain strong, competition is already moving ahead in terms of AI, and Apple must be ready to follow since Agentic AI has the potential to redefine the smartphone industry.
NB: Words like "needs", "must", "follow" contrast with minimal evidence of demand.
Effectiveness is a number. Efficiency is a ratio. No bank has ever accepted a ratio as a deposit. Counterpoint continues: "Although the lack of a more fully AI-featured Siri…
René Descartes, who published the phrase I think, therefore I am" in Discourse on the Method, in 1637
Apple isn't measured by revenue or profit, at least not primarily. The measure is always satisfied customers. The application of services, software and computing hardware to improve lives has always been the modus vivendi and the resulting customer creation has always been the metric of success. Revenues and profits follow customer creation in a 1:1 relationship.
WWDC seems to attract attention as a catharsis for product and strategy announcements but it was never intended to be this. It's about developers (the D in WWDC) and what matters to them: APIs, operating system updates, languages, SDK, and other tooling. It's also a chance to reveal the economic value proposition for those developers who are following their part of the $2 trillion ecosystem.
And so the measure of WWDC should be how developers are created and satisfied. The products, which come later, are important but what matters more is developer opportunity, productivity and satisfaction.
So here is what I'm looking forward to:
New developer opportunity with AI. This is via easier integrations, more choices perhaps in terms of back ends and possible hooks into different parts of the ecosystem. To wit: Swift extensions, *Kit extensions with hooks to smart home, exercise/fitness, accessibility.
New developer productivity tools: How is AI going to improve the toolchain for developers.
New developer business models: how agents can be built and integrated into privacy and safety that only Apple can guarantee.
As Apple has shown with accessibility improvements (foreshadowing!), AI can be used to make people's lives better especially those who cannot perform due to disability. AI can lift those "below the median" in terms of many forms of ability: below median communications, below median health and below median mobility. Those with more limited ability can be "enhanced" into at least median ability. By definition, half of humans are below the median so helping them is as useful as helping those above the median.
This is in contrast to the narrative that AI makes supermen. The opportunity is not mainly about taking over high ability tasks and forcing human effort to be displaced. it's much more about making the less able become more abled. (Characteristic of GenAI output is the "averageness" of it. For those of exceptional ability it feels worse/erroneous and irritates. For those of less ability it's empowering. AI pushes toward the median, both from below and above.)
Below the median here does not necessarily mean below the median income or wealth. Ability is not always correlated with income. There are many Apple customers and potential Apple customers who can use help. I surely can use help in many areas of life.
WWDC is about the scaffolding upon which these grand problems can be solved. Scaffolding is not pretty to look at and most look away in disappointment if that's all that is revealed. But no matter how well regarded, no great building has ever been built without scaffolding.
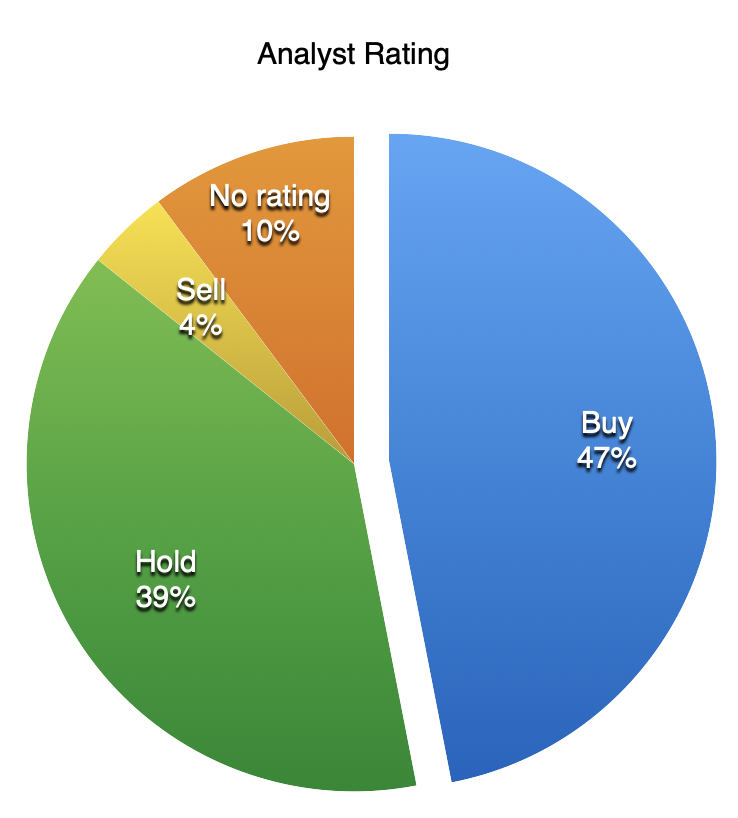
Apple has compounded net income at 26.6%, revenue at 21.5%, and share price at 27.7% for two decades, thus doubling every three years. Yet despite this, 21 of 49 analysts rate it Hold or Sell, with another 5 having no opinion. Extraordinary claims require extraordinary evidence yet assuming the Apple flywheel is about to grind to a halt is still a majority opinion. →
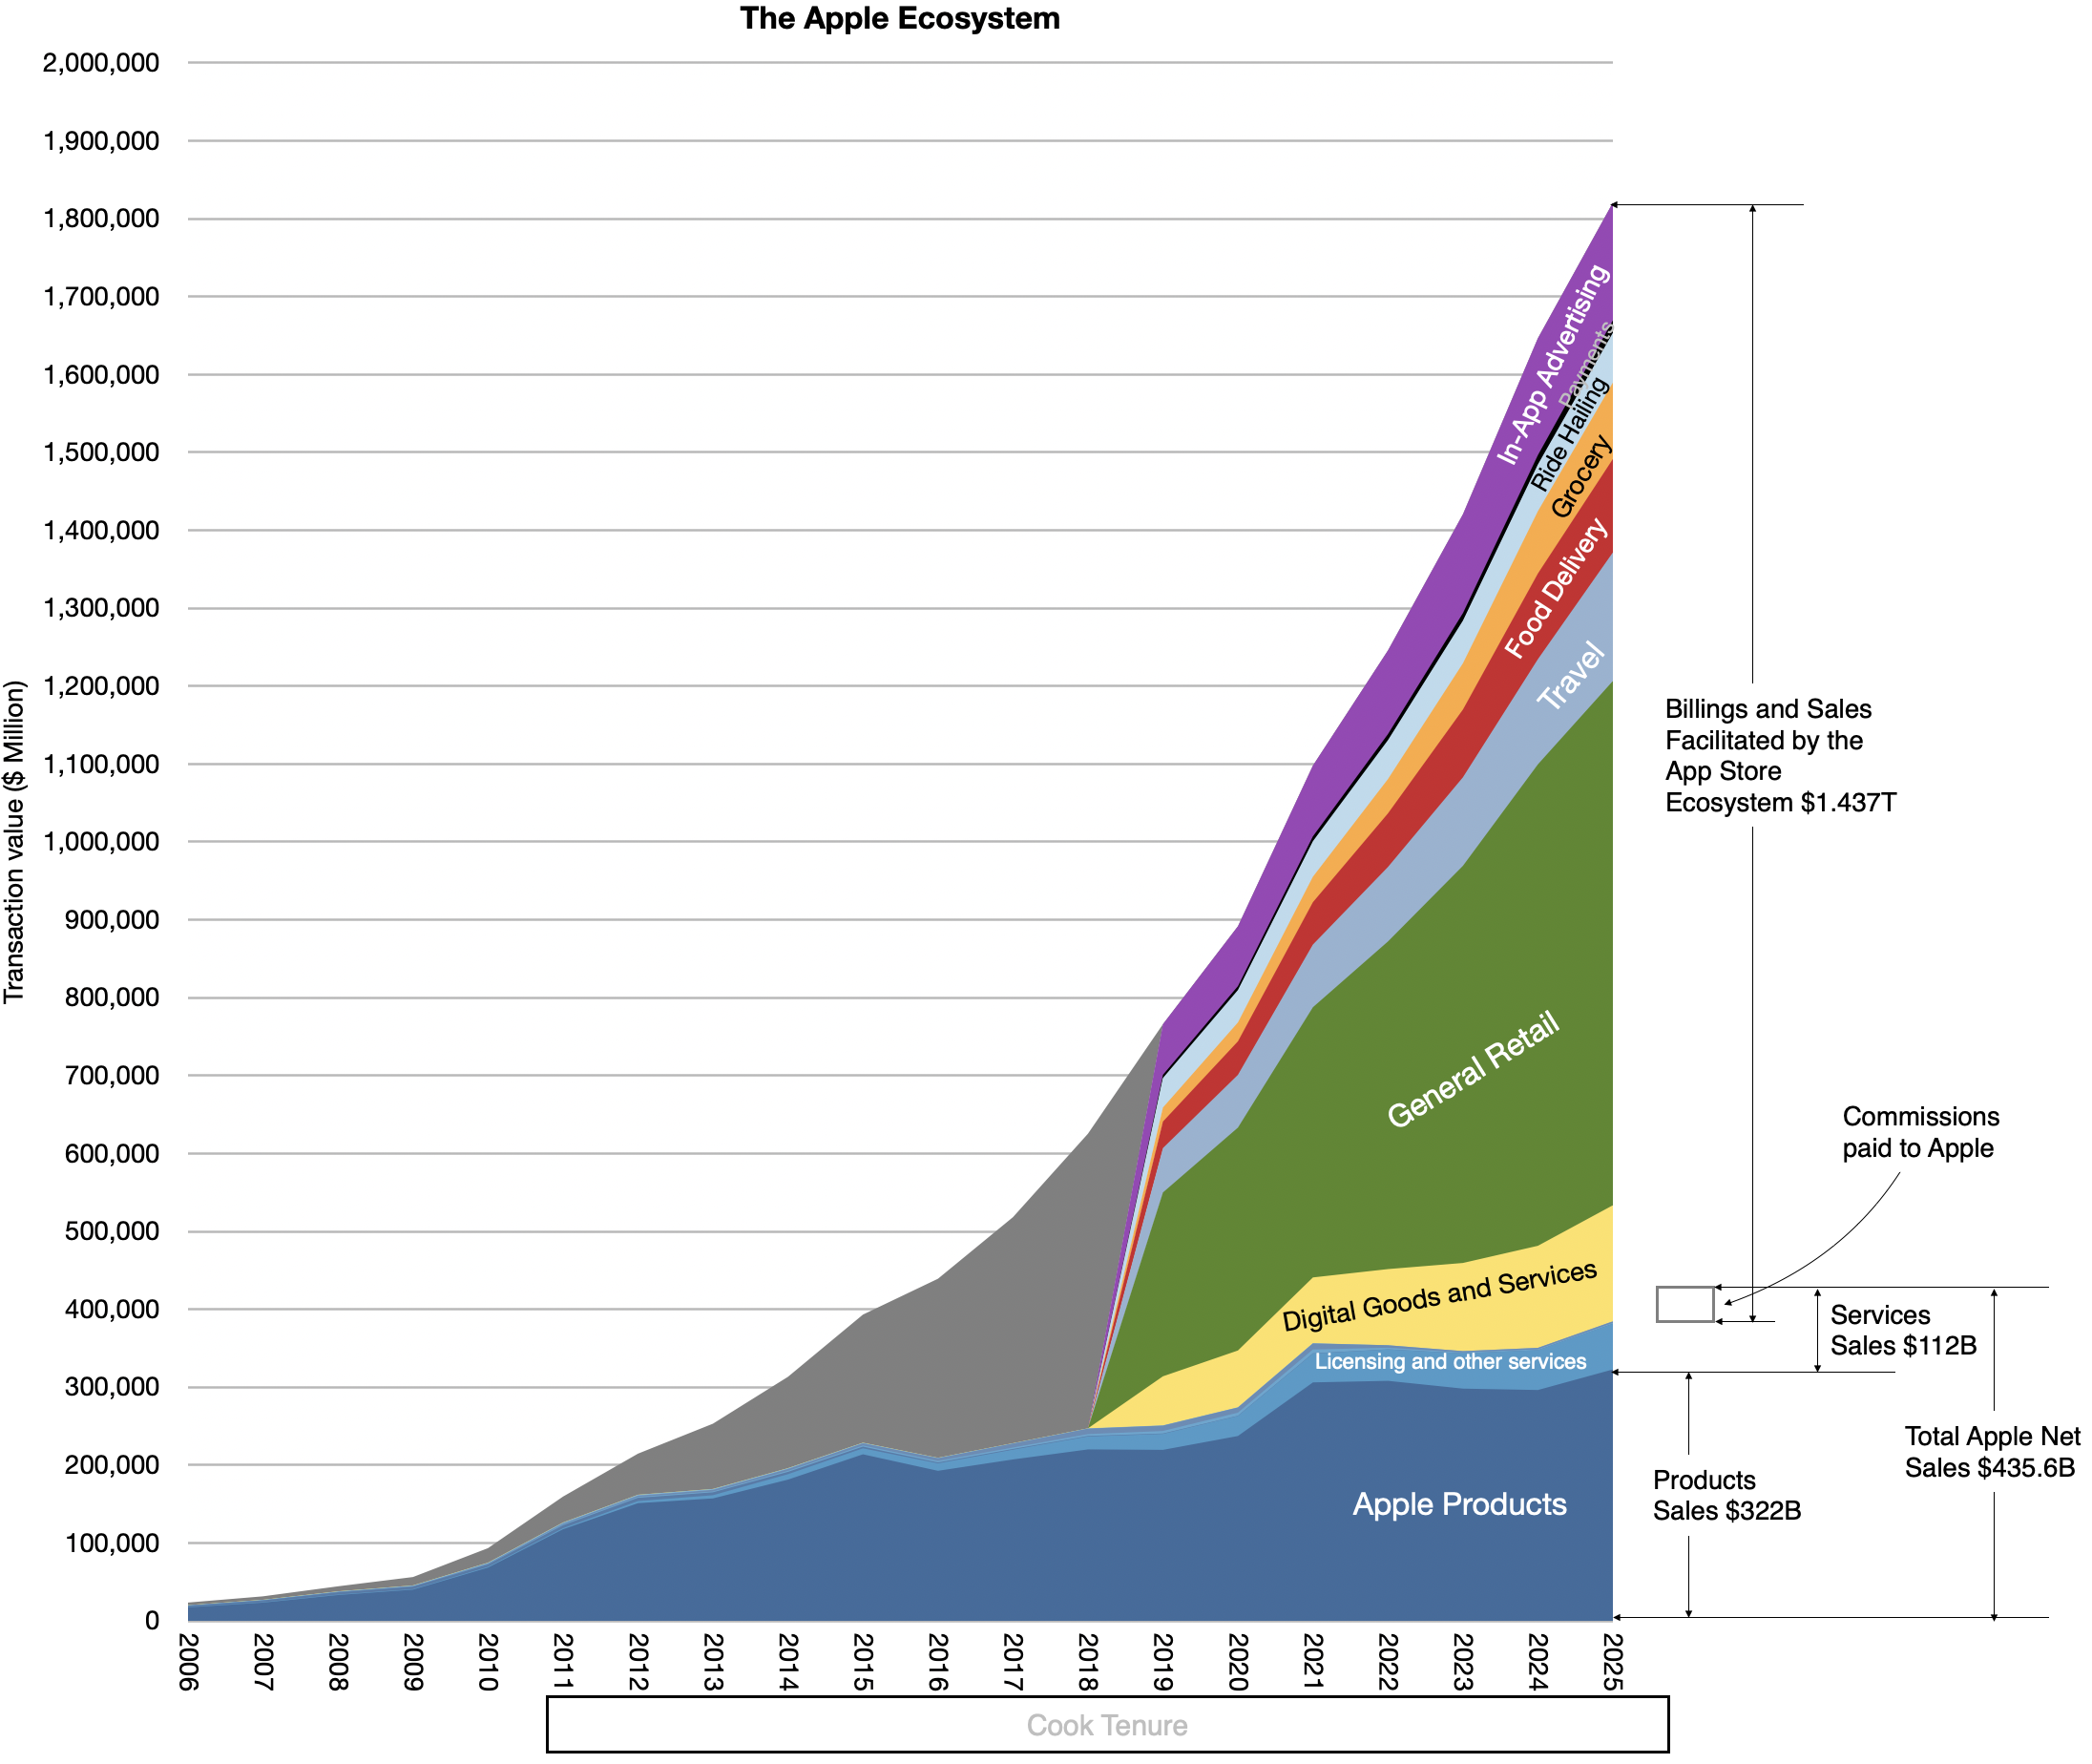
The App Store ecosystem facilitated $1.4 trillion in 2025. Add Apple's direct sales and the Apple Ecosystem comes to $1.8 trillion; add browsing, social, and messaging activity and the Apple Economy reaches roughly $3 trillion. Seen another way, at a $4.57 trillion market cap, Apple is valued at only 2.5 times its ecosystem and 1.5 times its economic footprint. These third-party dependencies are a measure of platform resilience and a carefully worded caution to regulators about the downside of interfering with it. →
Part 4 of the Asahi Shimbun interview turns to the spec trap. Apple maintains improvement but is selective: it ignores refresh rates beyond what the eye can see, and invests instead in features nobody asked for, like Face ID and AirPods. The phone became a machinery of vanity because the supply of cameras created demand for image editing, not the other way around. Christensen thought Apple would be disrupted by the low end. The honest answer for why it isn't is: culture, held together by extreme diligence. →
Nota Bene
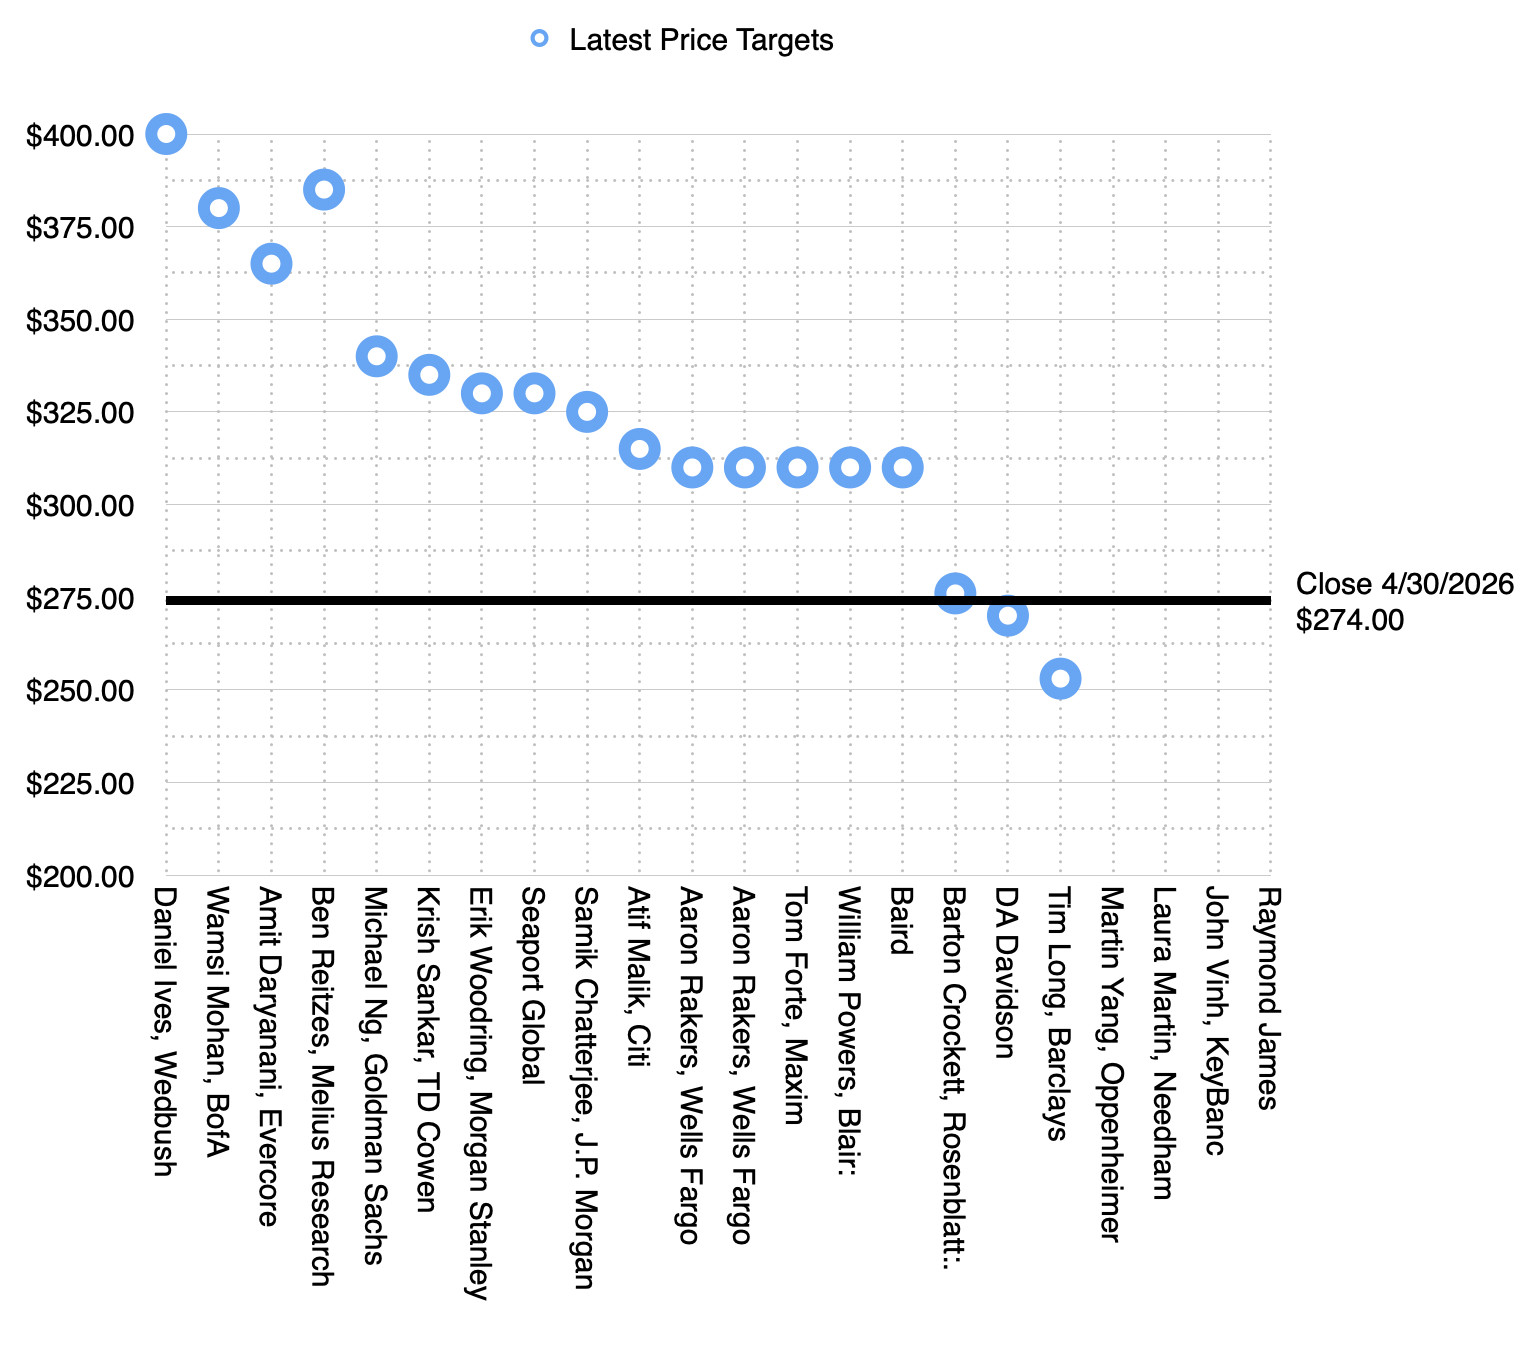
Morgan Stanley reiterates $330 price target with bull-case $440 → Morgan Stanley reiterated $330 with a $440 bull case if WWDC unlocks an AI re-rating. Apple does not respond to market fads, and a multiple above 40 is almost never experienced. Disappointment after WWDC is nearly guaranteed because it has always been a software and tools show. →
Citi reiterated a Buy rating and a $315 price target → Citi reiterated its Buy and $315 target ahead of WWDC, expecting a revamped Siri to make Apple an edge AI winner. Edge AI is inevitable, but it was also inevitable two years ago. The target is already priced in, making the AI story a non-starter. →
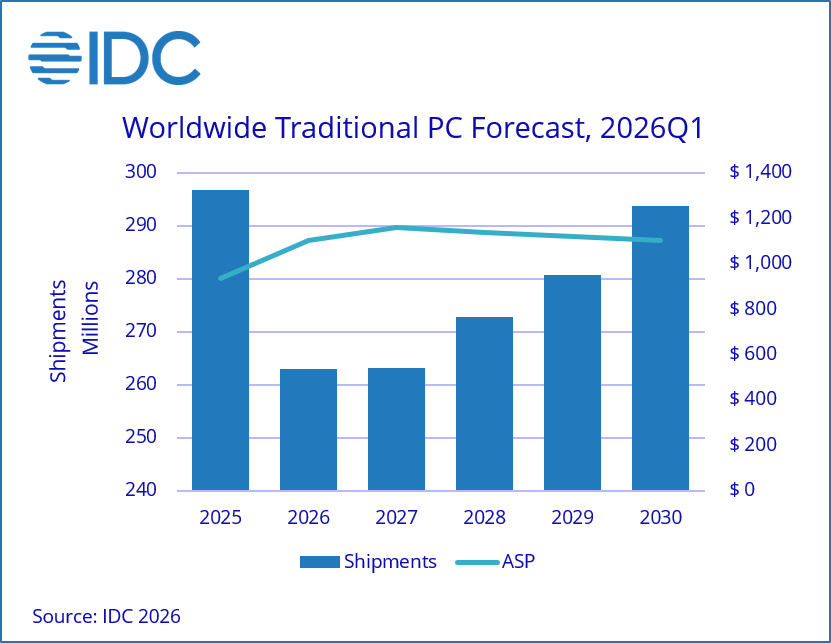
Q4 PC shipments are expected to fall 20% year-over-year, 11.3% for the full year → IDC now sees PC shipments falling 11.3% for 2026 and 20% in Q4, with no recovery in volumes until after 2030. The MacBook Neo is the only thing keeping the broader notebook forecast from being worse. This is a multi-year opportunity for Apple that may reset PC market share dynamics permanently. →
The iPhone maker is trading at 2.5x its ecosystem value and 1.5x its economic impact
Apple today announced the global App Store ecosystem facilitated over $1.4 trillion in developer billings and sales in 2025, according to a new study by economists at Analysis Group. For more than 90 percent of the billings and sales facilitated by the App Store ecosystem, developers did not pay any commission to Apple. Since 2019, the size of the App Store ecosystem has nearly tripled, as the App Store remains the safest and best place for users to discover and download apps. .
Bill Gates once said you have a platform when other people make more money from it than you do.
In other words, success is if there is more value created on top of it than captured from it.
Few platforms qualify but Apple's certainly does. Apple's ecosystem is shown in the graph below.
Apple's direct payments to developers were about $126.7 billion but, as the Analysis Group report shows, Apple and the developers enabled transactions dwarfing app store transactions. In 2025 Apple captured a tiny fraction of the economic activity it induced on its platforms (about $57 billion out of $1.437 trillion or 4%).
Combining the billings and sales facilitated by the App Store and Apple's direct sales of products and services leads to a total of over $1.8 trillion. I call this the Apple Ecosystem (Apple + App Store.)
But that's not everything. There are lots of economic activities on the platform that do not involve the App Store. Activity on browsing and social media and messaging apps probably add another 50% on top of this, perhaps even 100%. I call this the Apple Economy (Apple + App Store + All other transactions.)
Ultimately, the 1.4 billion Apple users using 2.5 billion devices are likely inducing as much as $3 trillion of economic activity.
It seems to me that we need a way to measure a multiple of this activity as perhaps a fundamental metric of value creation.
At $4.57 trillion current market cap, the value is only 2.5x its ecosystem and 1.5x its economic footprint.
AI-driven memory shortage continues to hammer sales; Android sales to drop 20%
According to analysis firm IDC, smartphone shipments are headed for a 13.9% decline in 2026, a downward revision from the 12.9% decline IDC had anticipated for the year in February. It would also mark the steepest drop in smartphone history, the company said.
“these pressures are compelling vendors to reduce shipments, raise prices and concentrate on higher price tiers — elevating smartphone [average selling price] to a record $550, up $100 from last year,” IDC senior research director Nabila Popal said in a statement.
“2026 will be a defining year for the industry as [a] new reality of structurally higher costs take hold,” she added. “For consumers, it means the era of ultra-cheap smartphones is over. For vendors, it means only those that can adapt their strategies to this new cost environment and sustain demand at elevated price points will survive.
The broader Android smartphone market is set to take the biggest hit, with IDC projecting a 20% year-over-year drop in shipments. Despite that, Samsung is expected to increase its market share in the space at the expense of smaller smartphone companies thanks to its midrange and premium device lineups.
Apple, the research firm said, is also expected to perform relatively well, with shipments forecast to fall 5.2% on the year, an improvement from a previously anticipated decline of 8.1%.
In its most recent earnings report, Apple announced iPhone revenue growth of 20% for the second consecutive quarter, thanks to its strong iPhone 17 lineup and improved sales out of China.
But CEO Tim Cook also warned of supply constraints due to both the memory shortage and the dearth of iPhone processors.
NB: I would add that Apple also announced that revenues for June quarter would increase at the same rate as they did for March quarter, thus for at least half the year the company will achieve 20% growth in iPhone sales. This is in sharp contrast to both what IDC and Omdia have been reporting.
The company “may be on the brink of some real AI sizzle.”
Reitzes said people are becoming more comfortable using voice commands, and Apple could benefit from this shift as technology becomes more voice-driven.
Reitzes also said the upgraded Siri could become a standalone tool that many Apple users rely on, even instead of apps like OpenAI’s ChatGPT. He described it as an “agent-style interface” that could make the Apple ecosystem more unique and spark fresh excitement among developers.
Additionally, he highlighted that no other consumer tech company has both parts of that system under one trusted setup. He added that this advantage will become even clearer—and more valuable—as AI systems get more complex and start acting more independently.
Overall, he expects Apple to post about $613 billion in revenue by fiscal 2028.
NB: Latest analyst targets are shown with Melius' stepping up. Analysts are coming round.
This upgrade follows Bank of America boosting its price target to $380 a share.
“In an agentic world, value accrues to the platform that controls user intent, personal context, app access, permissions, identity, authentication, payments, and trust,” said BofA’s senior equity research analyst Wamsi Mohan.
“Smartphone is the scaled consumer device where these factors already converge,” he added. “If AI assistants become the new front door…we think Apple should have meaningful leverage over model providers, app developers, merchants, advertisers, and payment networks.”
An agentic version of Siri could boost 2030 revenue by as much as $65 billion, Wamsi and his team estimated, adding up to $2 billion in incremental earnings over the next four years.
Reitzes sees the new Apple Siri as a stand-alone app that has the potential to replace ChatGPT for Apple's 2.5 billion installed devices, while proving to be “an agentic interface that can further differentiate the Apple ecosystem and ignite a level of excitement with developers not seen since the early days of the App store.”
But it’s also likely to establish Apple as the leader in consumer-use AI.
“If agentic AI shifts the market from answering questions to taking actions, the critical control point becomes centered around owning the endpoint,” Wamsi said. “Apple does not need to own the best frontier model if it owns the trusted interface that routes intent across local models, Apple-controlled cloud models, external models, and app actions.”
Reitzes at Melius sees that shift, which he describes as a “shot in the arm” for Apple’s app store, driving “a massive new product cycle that keeps iPhone growth going.”
He’s also observing that Apple’s architecture, with on-device models handling lighter workloads and its private cloud taking on the larger ones, makes it unique.
“No other consumer technology company has both legs of that architecture under a single trust model, and we think that gap becomes more visible, and more valuable, as agentic complexity scales,” he said.
“Agentic AI is a structural tailwind that will force consumers to get the latest and greatest Apple device because it will work better than other brands.”
Market contraction expected for second half of year.
Omdia reports that Europe (ex. Russia) smartphone market grew 2% to 33 million units in 1Q26.
Key vendor highlights from 1Q26 include
Samsung was Europe’s largest vendor as it grew 3% to 12.6 million units. Effective discounting of the Galaxy A16 4G helped Samsung boost volume, offsetting declines related to the delayed launch of the Galaxy S26, A57 and A37.
Apple grew 9% to 8.8 million iPhones, driven by robust iPhone 17 series demand in addition to benefiting from a wider mid-range coverage from the iPhone 15 and iPhone 16e. Noticeably, Apple’s strong results came despite lower and fewer discounts than in previous years.
Xiaomi retained third place despite declining 15% to 4.5 million units, as it was more immediately impacted by supply-side difficulties. However, Xiaomi’s ASP grew 21% compared with 1Q25, boosted by a record-strong Xiaomi 17 and 15T series performance, which drove year-on-year value growth despite the shipment decline. Premium sales were particularly strong in France, Germany, and Spain.
Motorola grew 17% to 1.9 million units, driven by rapid expansion in Spain and Portugal, alongside continued progress in France and Italy.
OPPO grew 9% to 1.3 million units, largely driven by its comeback in France alongside growth in Romania and Poland. With both realme and OnePlus now under its umbrella, OPPO is restructuring to optimize its portfolio and strategy with ambitions to strengthen its European position.
HONOR, ranking sixth, was the fastest-growing vendor among the largest players, with shipments increasing more than 60% compared to 1Q25. HONOR’s growth is underpinned by its portfolio being expanded further down the price-tiers.
"The average-selling-price (ASP) of smartphones in Europe surged to a record-high level of €580 in 1Q26," added Bjorhovde. "This was largely caused by lower availability of devices costing less than €200, which made up an all-time low of just 25% of shipments. Additionally, the high-end remained resilient thanks to Apple’s growth. The focus from both vendors and channel partners has shifted from volume to value to deliver results and operational sustainability. Many vendors who normally focus on the mass market segments are increasingly concentrating on the mid-to-high-end, hoping to benefit from less price-sensitive and upgrade-willing buyers."
[My emphasis]
"The first quarter of 2026 delivered beyond expectations, but the outlook remains bearish as the rapidly escalating memory bottleneck worsens," commented Bjorhovde. "Omdia forecasts shipments into Europe to decline 12% in 2026, but the majority of this will come in the second half of the year.
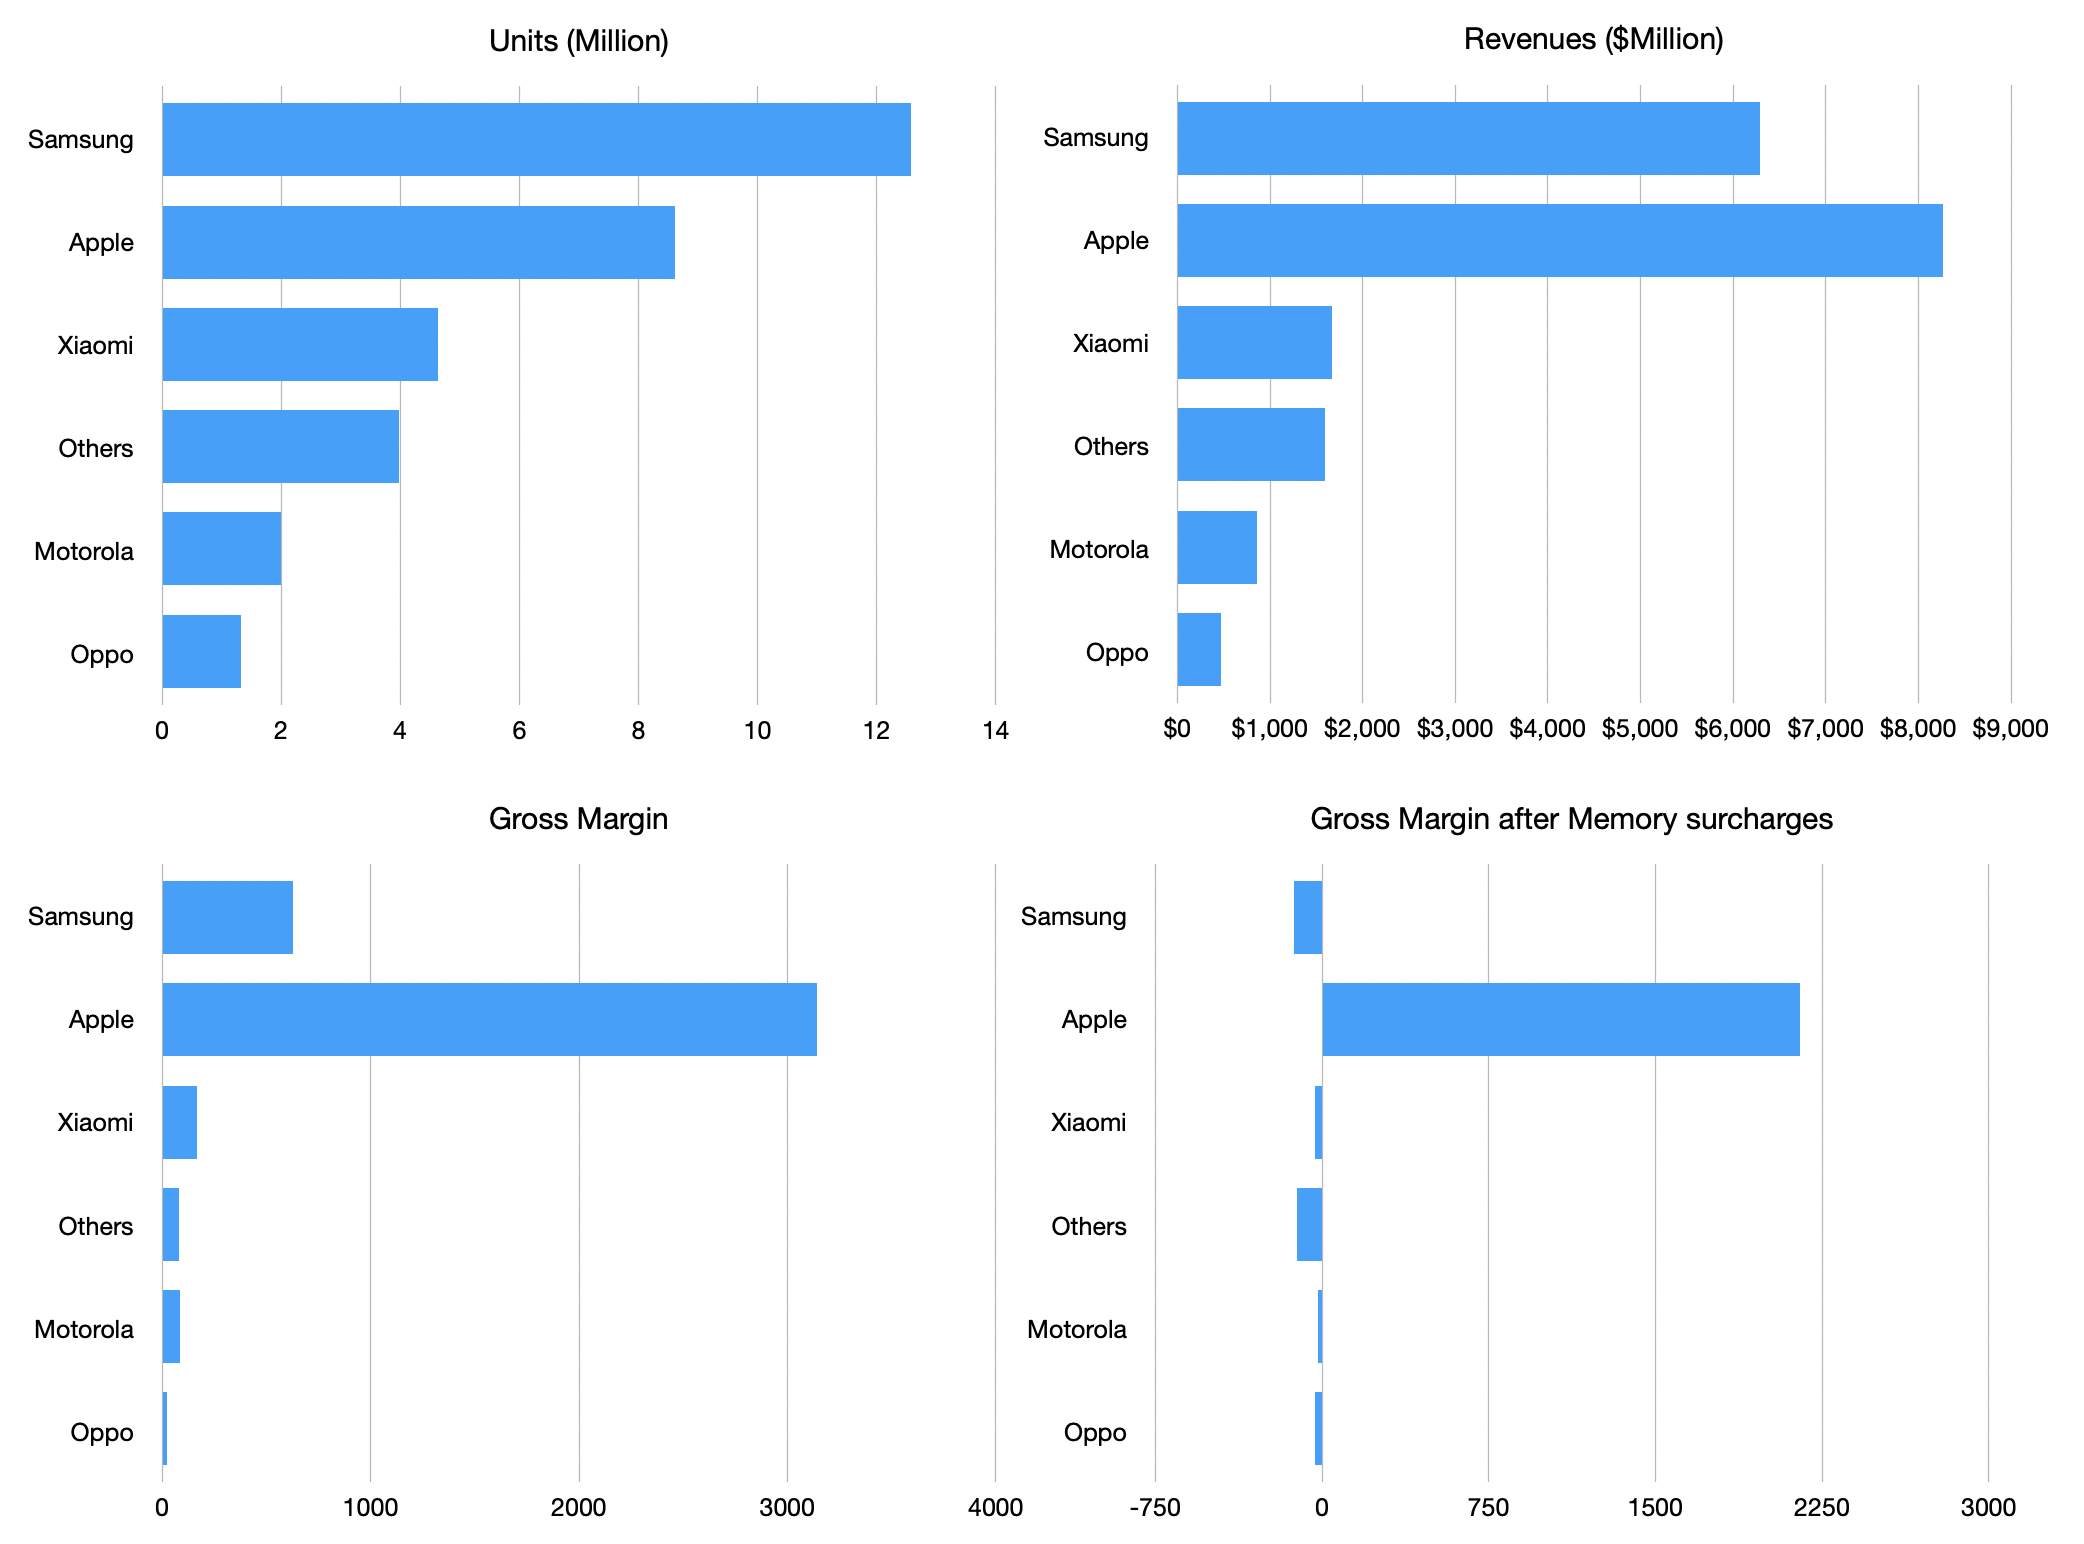
Applying average pricing per vendor and average gross margins gives the following picture of the market:
Apple currently captures 26% of unit volume, 43% of ...
Why the most common measure for valuation is inadequate in an age of AI
Software and services companies like Google, Microsoft, Amazon, Meta are spending on Capital Expenditures at the rate of heavy industry manufacturing. This defies their description as "asset light" business models which depend on services, distribution or platform economics.
The problem isn't just semantic. It is that for their entire existence, these companies were valued for their profitability and measured in terms of a P/E ratio and earnings growth. The situation has changed dramatically. Their revenues are up, the earnings are up and growth is up and share prices are way up. But not their P/E ratios. Why is this?
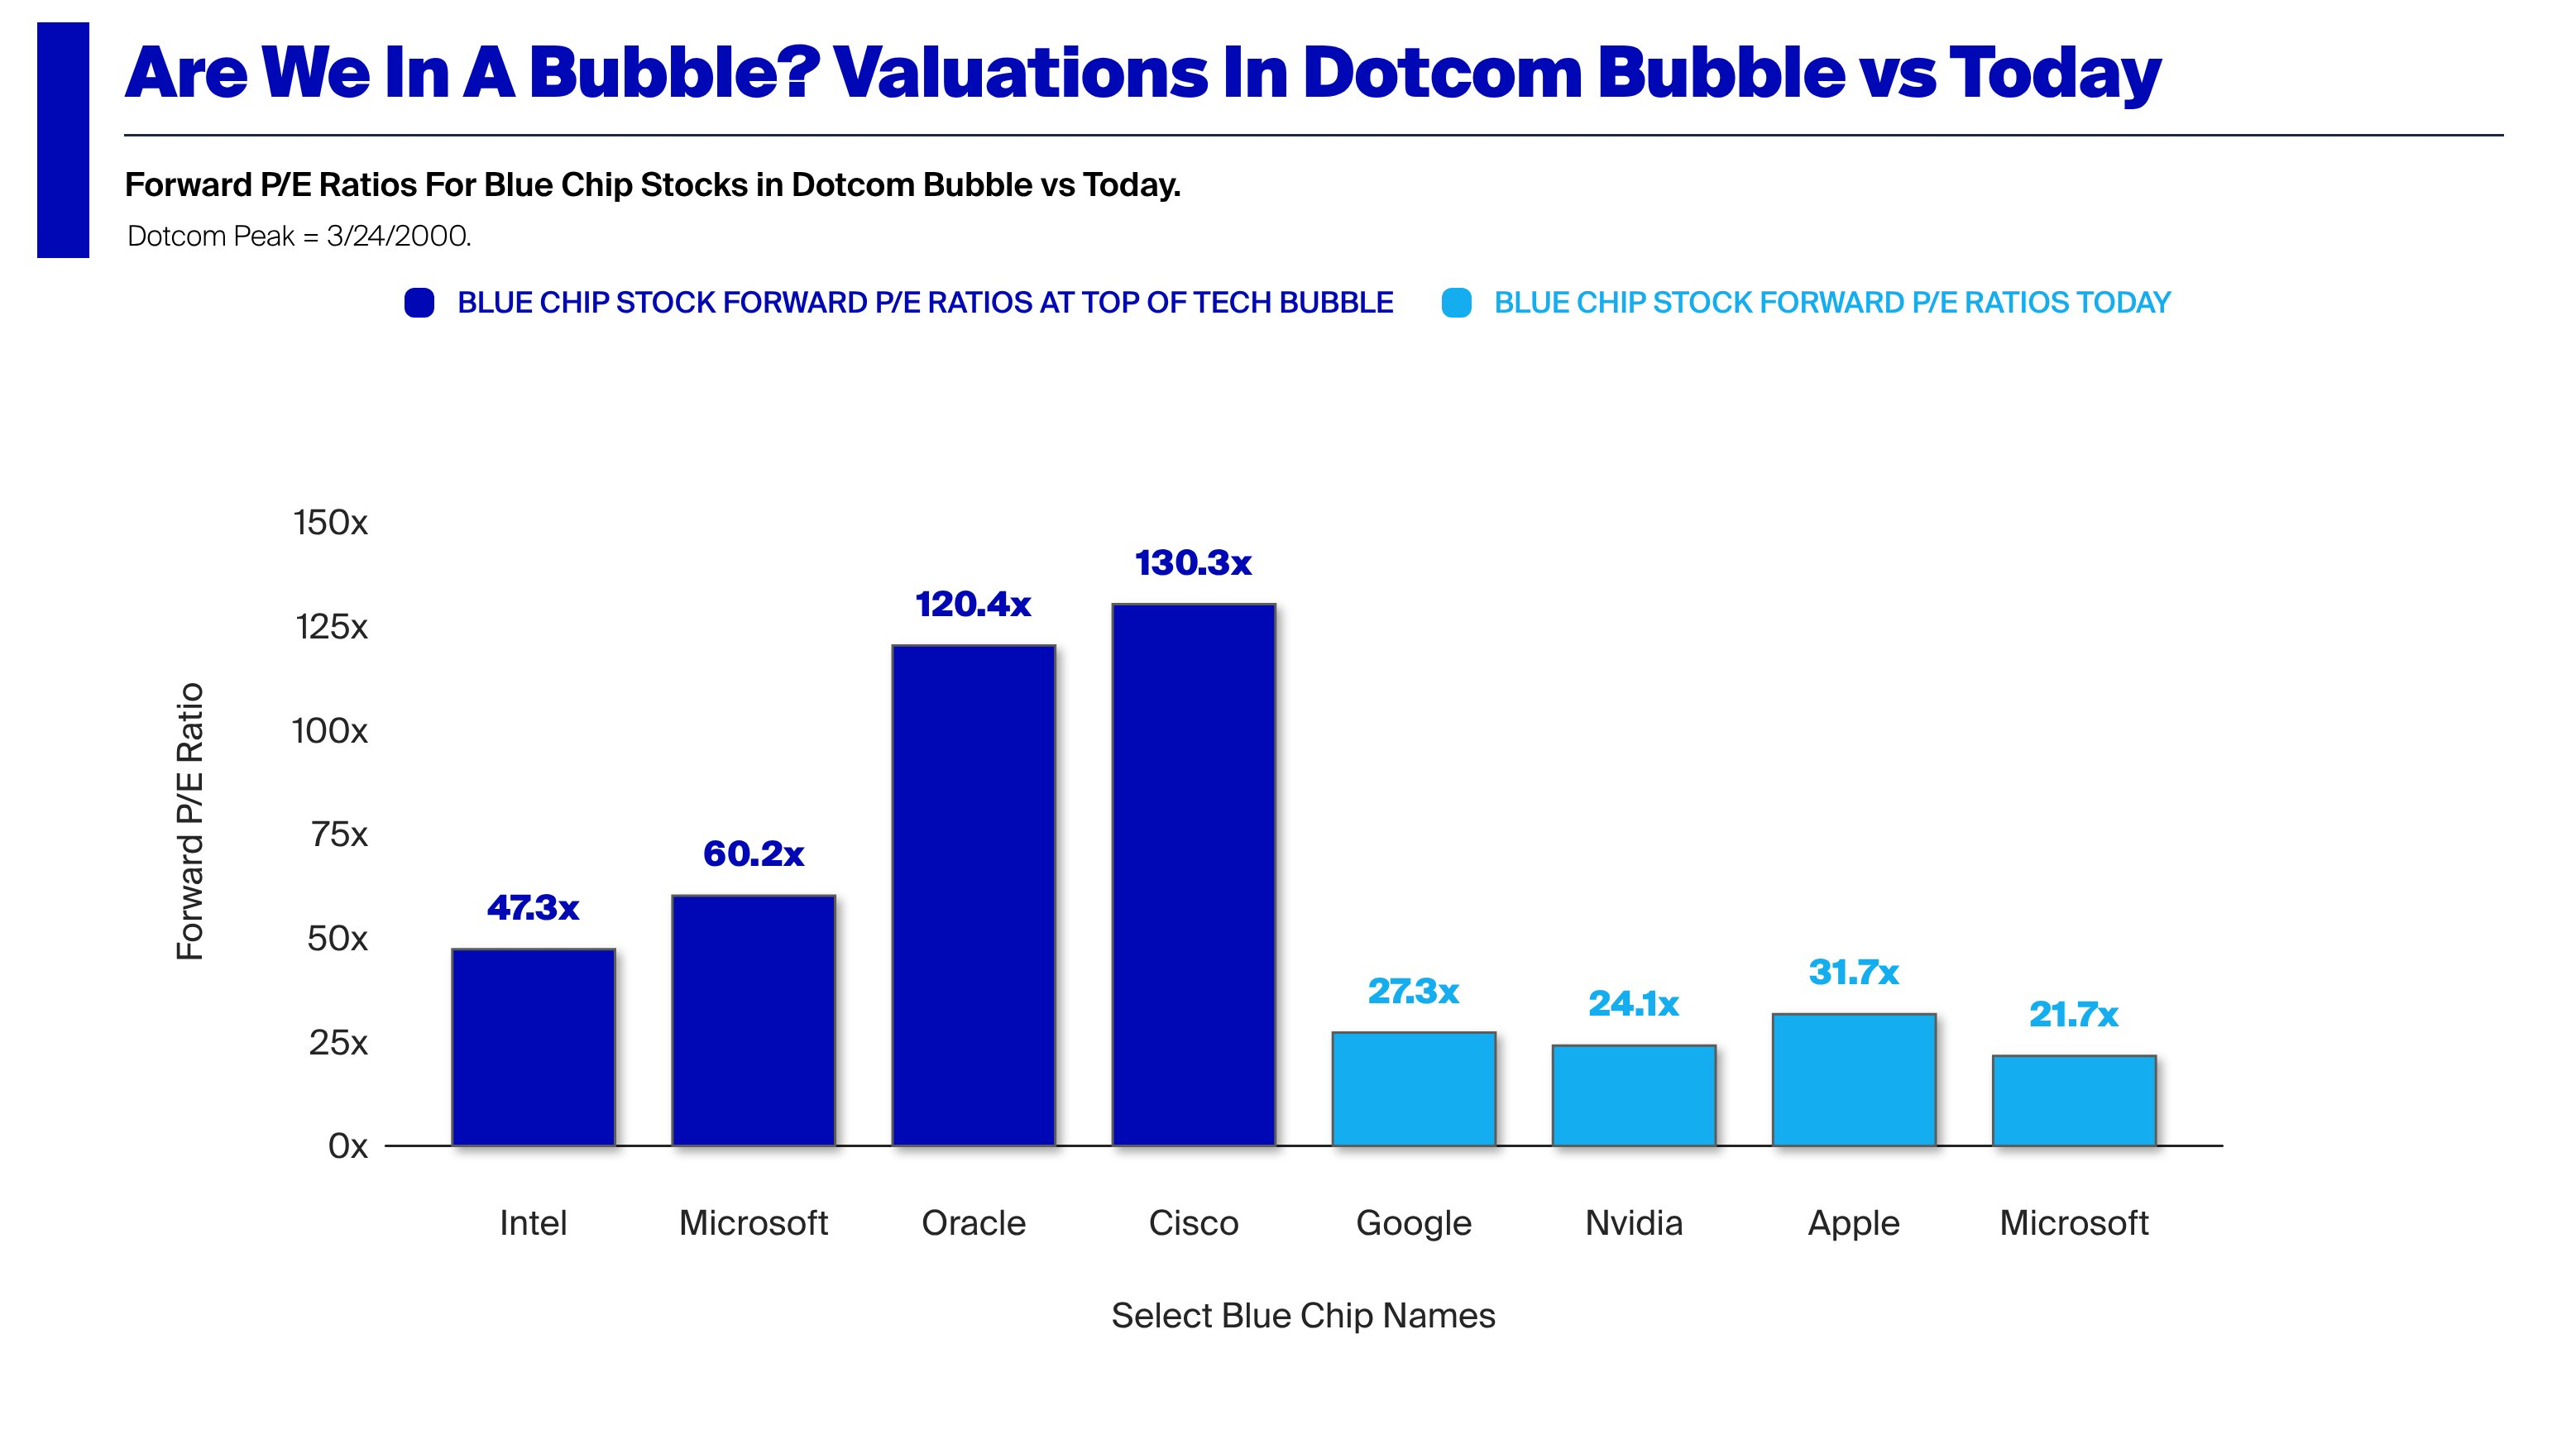
Consider the graph below showing the (forward) P/E ratios of the Dot Com market leaders vs. the market leaders today.
This even as share prices and value concentration have risen even faster than in the Dot Com era. Seen from the P/E basis, it does not look like we are in a bubble. Earning growth is way up so the share prices are not outrageous on that basis. That is contrary to 1999 when P/E ratios in the hundreds were considered normal. Expectations of an internet fueled boom were speculative. Expectation of an AI earnings boom seem well founded.
But these companies could still be over-valued. The P/E ratio is not the full picture. It is in fact a simplifying shortcut which ignores significant pockets and omissions of value.
For this analysis I'll use a sample including some of the largest market caps in the world with two exceptions. The exceptions are Lilly (LLY), Berkshire Hathaway (BRK-B) which are on the list but not in the top 10 (though in top 15) and Saudi Aramco and Broadcom which are in the top 10 but not on the list[1].
Company
Market Cap
NVDA
$5,709,746,405,376
AAPL
$4,379,916,369,920
GOOG
$4,811,891,146,752
MSFT
$3,041,424,048,128
AMZN
$2,874,514,866,176
TSM
$2,166,463,135,744
TSLA
$1,664,912,326,656
META
$1,569,837,154,304
BRK-B
$1,044,046,610,432
LLY
$897,716,060,160
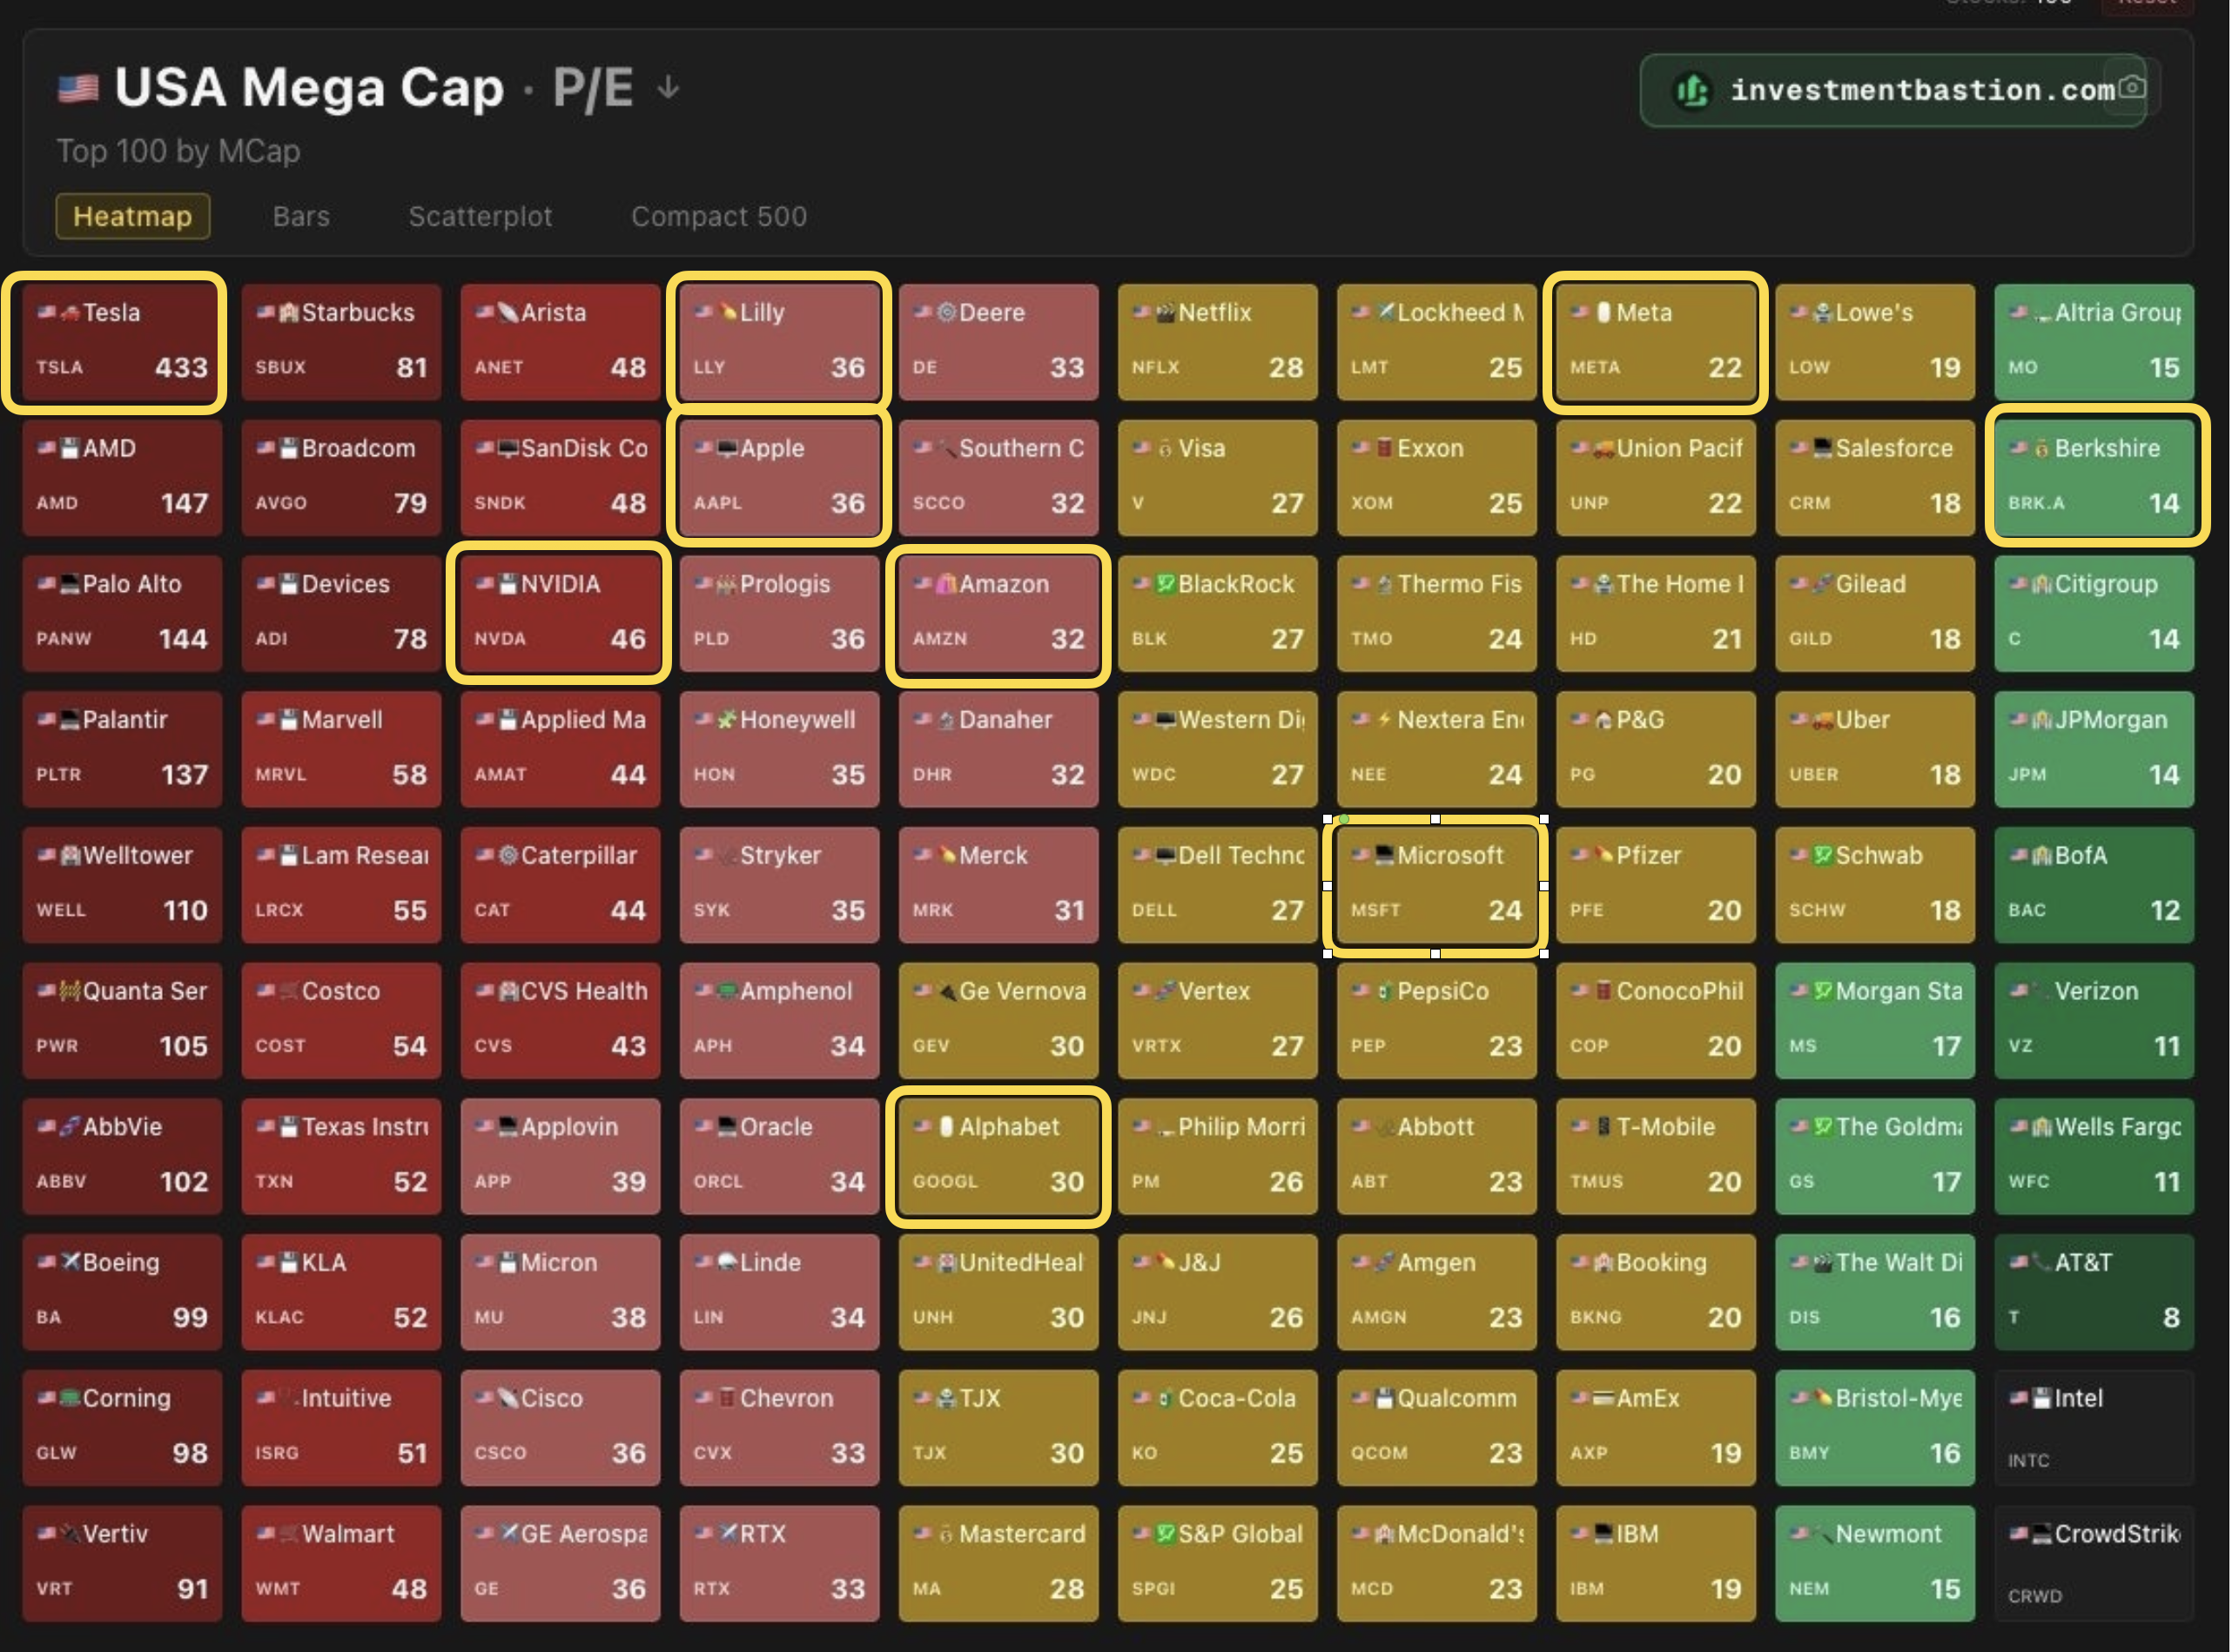
The following diagram shows the P/E ratios of the sample relative to the top 100 US market caps[2]. Note that, with one exception, the companies are not in the dark red zone with above P/E of 60. The exception is, of course, Tesla, which, at P/E of 400+ is 14x the average multiple.
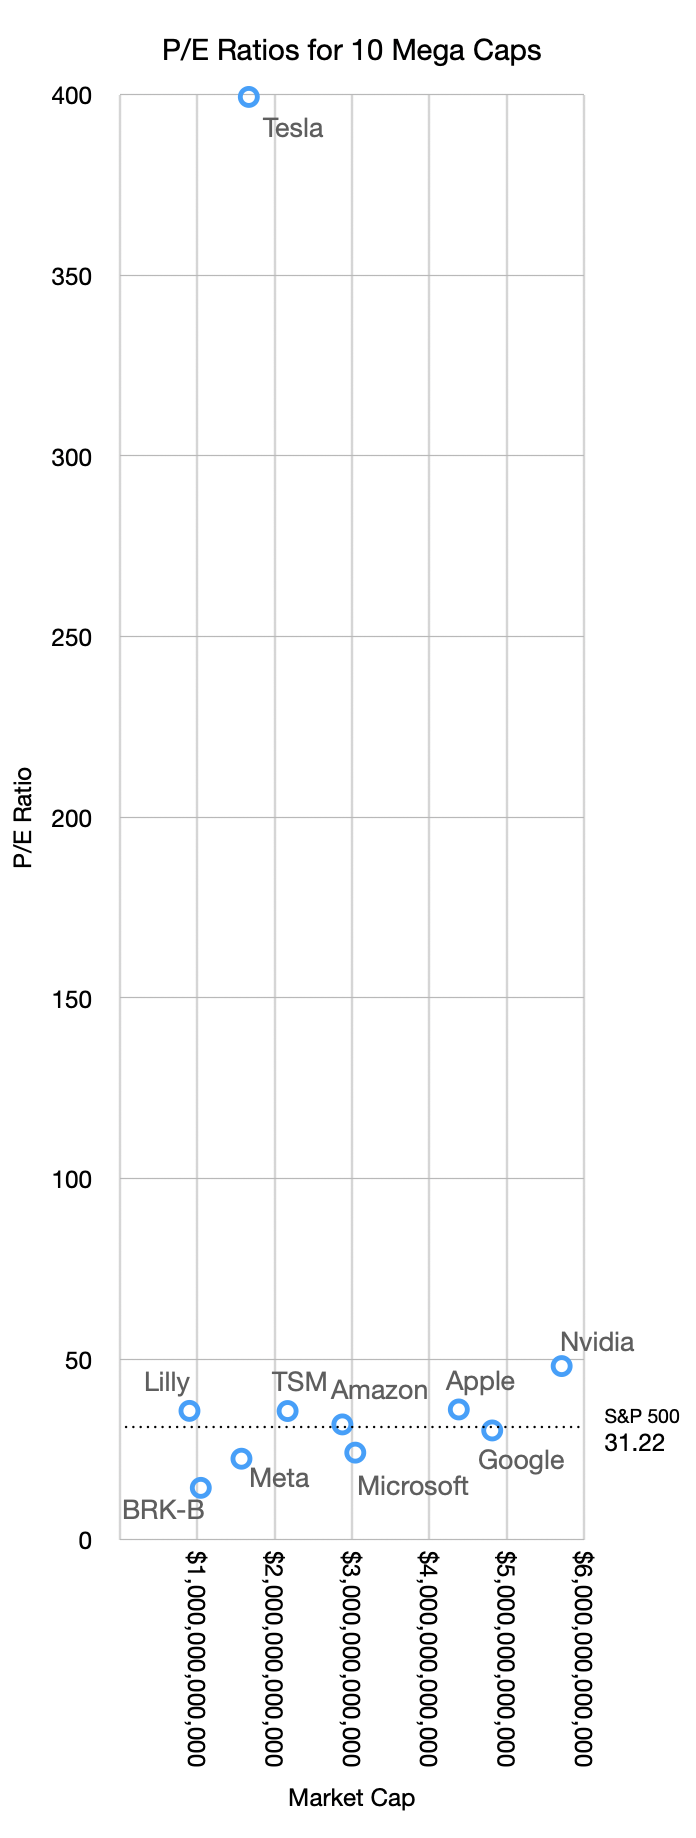
Moreover, compared with the S&P 500, these P/E ratios are in-line with the median. The following graph shows the sample set with P/E ratio vs. Market Cap.
Excluding the one anomaly the relationship seen is that higher market caps roughly correspond to higher P/Es. Nvidia has a market cap over $5.7 trillion with a P/E of 48 while Meta has a market cap of $1.5 trillion and a P/E of 22.5.
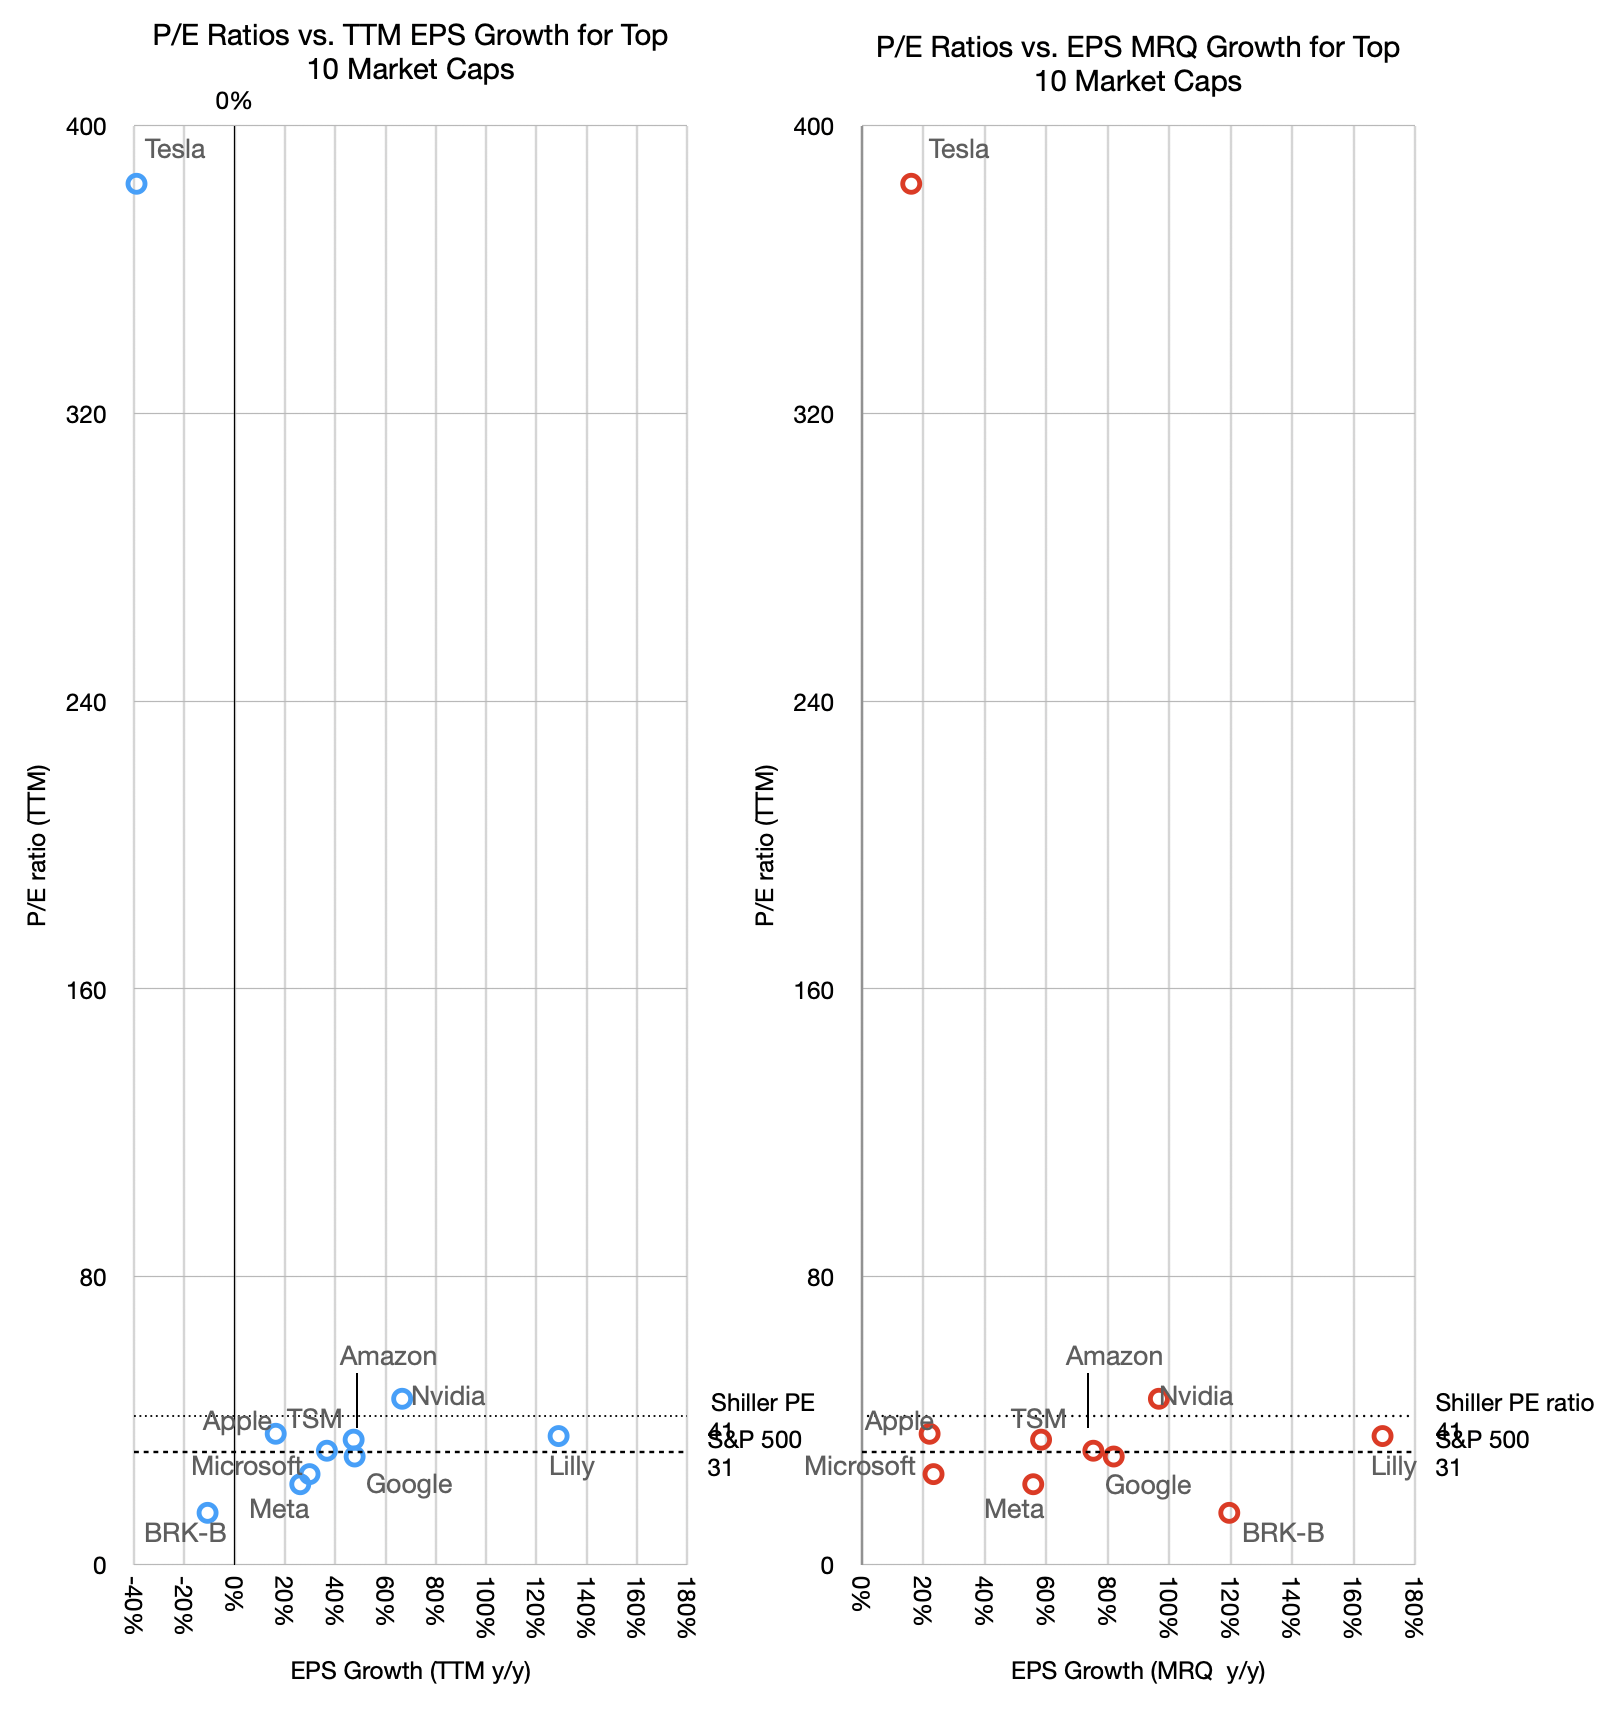
Higher P/Es should also correspond to higher growth rates. The graph below shows the relationship between P/E and growth, both in the most recent quarter (MRQ) and trailing twelve months (TTM).
There is a loose relationship between P/E and TTM growth but not with last quarter's growth. The one anomaly is even more prominent as it shows negative growth with exceptional valuation. Fundamentally however the relationship between P/E and growth is weak. Companies having widely divergent growth show similar P/E ratios. Alphabet for example has seen its P/E ratio in the 20s with growth in the 80s TTM and 50s MRQ.
This might sound familiar. From 2008 to 2020 Apple was trading at a P/E ratio in the teens and low 20s while growing as fast as 80%. The logic was captured by my analogy of the goose that lays the golden eggs. Apple was able to create extraordinary products but the market considered such hits fleeting. It valued consistency over heroism. Getting on base vs. home runs. And so the P/E began to rise only once Services became more prominent. Regardless of how foreseeable this pattern was, it took a decade and is still ongoing for the pricing to catch up.
But the situation with AI companies (that is, all the big tech companies but Apple) is that their earnings today are somewhat an illusion.
An old maxim that says "earnings are an opinion while cash flow is a fact.[3]"
This is because Net income can be manipulated by accounting abstractions, whereas cash flow is based on bank transactions.
To wit: Net income (earnings) is calculated using accrual accounting, which relies heavily on judgment calls rather than bank balances. Companies recognize revenues the moment a contract is signed, even if the cash won't be collected for months. Or they can dial in a delay as they desire.
Because of varying accounting policies, two identical companies with the exact same physical business can report vastly different earnings figures.
Cash flow is objective and simply tracks the actual movement of money in and out of the business. Real dollars either enter the bank account or they don't. A company can look highly profitable on an income statement but still go bankrupt if its cash is trapped in unpaid invoices or unsold inventory.
Finally, cash flow can be strongly negative while earnings are strongly positive. This is because investment in capital equipment does not appear in the income statement.
Therefore true economic value is determined by the cash a company can actually distribute or reinvest rather than how it declares profitability based on accounting abstractions.
AI companies are not necessarily hiding behind suspect earnings but their extraordinary capital expenditures are draining their cash and thus what investors have access to.
Earnings seem to be soaring so the ratio P/E suggests a modest valuation. This is based on opinion or at least incompleteness.
We should look at a better indicator. It's the EV/FCF ratio. We will look at this next.
The top 10 ranking can change rapidly and it makes analysis difficult over longer time periods. The inclusion of LLY and BRK-B allow for visibility outside of the tech sector and they were in the list mid 2025. Saudi Aramco is in a completely different environment influenced by non-economic factors.
TSMC is absent from the table as it is US only companies. It is notable perhaps that of the top 15, three are not US companies (TSMC, Samsung and Saudi Aramco). Furthermore the top Chinese company, Tencent is 25th, valued at $532 billion and the top European company is ASML at 21st and $610 billion.