Asymco

Asymmetric Intelligence

share

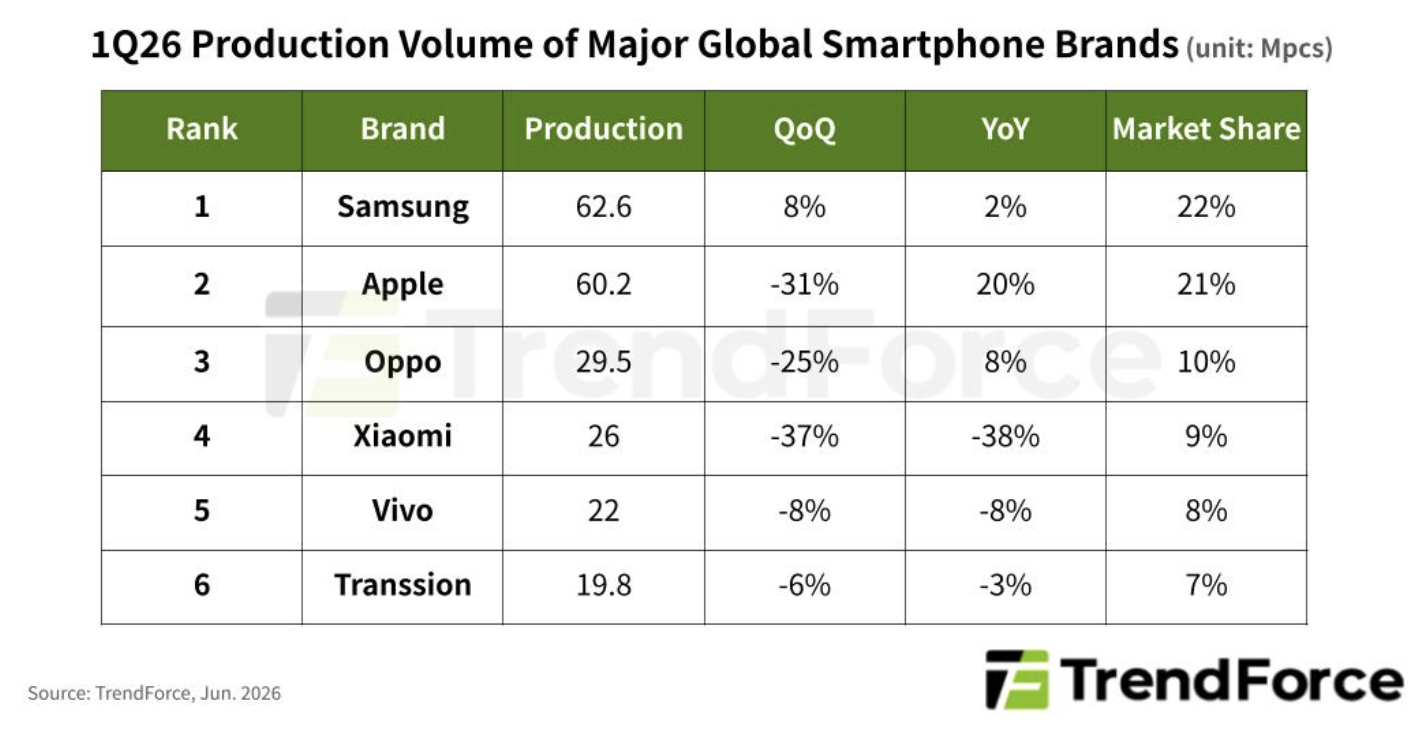
  1. Trendforce: Global Smartphone Production Fell 1.7% YoY in 1Q26; Sharper Decline expected in 2Q26

    Nota Bene · 2 comments

    Apple increases production by 21%

    TrendForce’s latest figures reveal that global smartphone production reached around 284 million units in the first quarter of 2026, marking a 1.7% YoY decline. Despite a sharp rise in memory prices since the second half of 2025, the effect on production was minimal because brands still held inventories of cheaper memory components. Additionally, consumer expectations of higher prices in the future have helped sustain short-term demand, cushioning the impact of rising memory costs on production during the quarter.

    However, as low-cost memory supplies are gradually exhausted and significant ongoing increases in memory prices reduce profits, most smartphone brands have begun adjusting production in the second quarter.

    Looking ahead, TrendForce forecasts global smartphone production to decline approximately 16.2% YoY to 1.051 billion units in 2026. Under a more severe scenario, the annual decline could become even more pronounced if memory price increases remain elevated and brands are forced to raise retail prices repeatedly.

    TrendForce notes that Samsung is relatively well-positioned to withstand the current cost inflation cycle thanks to strong financial backing from the broader Samsung Group and a sizable premium product portfolio. Nevertheless, its significant exposure to lower-end models remains a concern—particularly amid weakening consumer sentiment—making end-market demand a key factor to monitor.

    Apple ranked second with its production of approximately 60.2 million units during the quarter. In addition to ongoing production ramp-up for new iPhone models, output was supported by the launch of the iPhone 17e, resulting in 19.7% YoY growth.

    Compared with competitors that have already entered a margin-protection phase, Apple remains better positioned to absorb higher memory costs while maintaining profitability. TrendForce believes Apple is more likely to prioritize market share expansion during the current downturn as it lays the groundwork for future growth in recurring software and services revenue.

    Xiaomi, Oppo, and Vivo focus on preserving profitability as production plans face greater uncertainty

    First quarter production declined seasonally among the major Chinese smartphone brands, including Oppo (29.5 million units), Xiaomi (26 million units), and Vivo (22 million units). These three brands ranked third through fifth globally by production volume.

    While all three delivered strong market share gains in previous years, surging memory costs are now weighing heavily on profitability, creating significant uncertainty around their 2026 production plans. As a result, production targets may be revised downward if cost pressures persist.

    Transsion produced approximately 19.8 million units in 1Q26, roughly flat compared with the same period last year, placing sixth among global smartphone brands.

    The brand has been particularly vulnerable during the current memory price supercycle given its smartphone portfolio is heavily concentrated in entry-level and budget segments—where profit margins are already thin. Limited access to low-cost component inventories has further amplified the impact.

    Source: TrendForce

    NB: Counterpoint tracks sales, Trendforce tracks production. The production data may include inventory build-up not shown in sales while sales may include drawdowns not shown in production. The two analyses however agree on a market under significant supply-side stress. Profitability is a big concern and availability of components is critical. As noted previously in response to Counterpoint reports, the 2026 full year volumes will probably show the worst decline in decades.

  2. Asymco Bulletin 016 - June 7, 2026

    Bulletin

    Asymco Bulletin is a digest of all the work we have published for the week ending June 7, 2026.

    Coming Up: Post-WWDC Office Hours

    Office Hours Live Q&A, Tuesday June 9, 2026
    Day after Apple WWDC'26 Keynote

    Join us for our June 2026 Office Hours the day after WWDC'26 for a look into Apple's announcements, implications, and insights, and our live Q&A.

    To sign up, and for the latest live event information, visit: asymco.com/live. →


    Research

    42% of Apple Analysts rate it a Hold or Sell

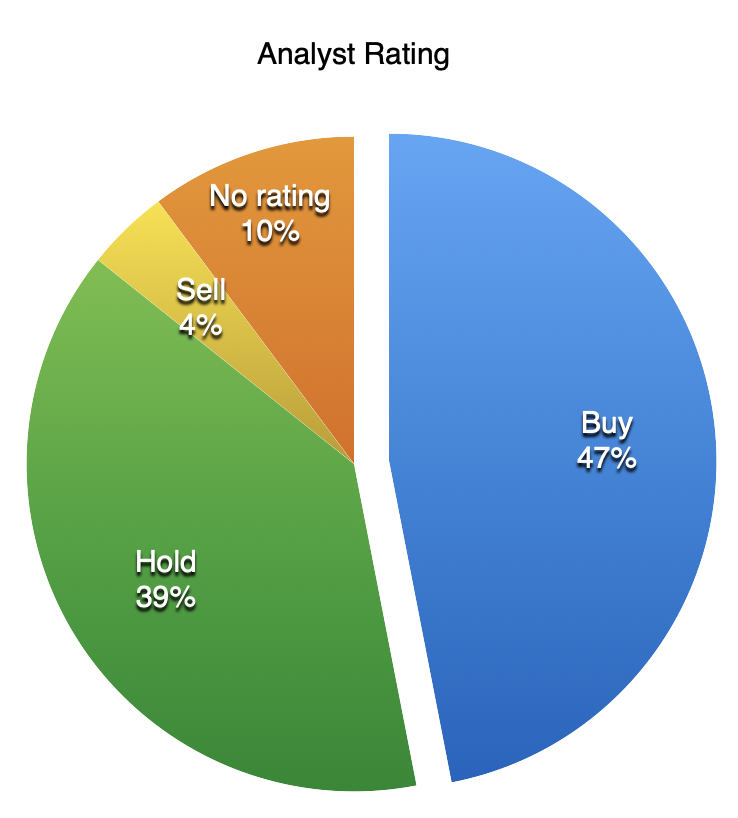
    Apple has compounded net income at 26.6%, revenue at 21.5%, and share price at 27.7% for two decades, thus doubling every three years. Yet despite this, 21 of 49 analysts rate it Hold or Sell, with another 5 having no opinion. Extraordinary claims require extraordinary evidence yet assuming the Apple flywheel is about to grind to a halt is still a majority opinion. →

    The Apple Ecosystem Approaches $2 Trillion

    The App Store ecosystem facilitated $1.4 trillion in 2025. Add Apple's direct sales and the Apple Ecosystem comes to $1.8 trillion; add browsing, social, and messaging activity and the Apple Economy reaches roughly $3 trillion. Seen another way, at a $4.57 trillion market cap, Apple is valued at only 2.5 times its ecosystem and 1.5 times its economic footprint. These third-party dependencies are a measure of platform resilience and a carefully worded caution to regulators about the downside of interfering with it. →

    How not to over serve; The machinery of vanity

    Part 4 of the Asahi Shimbun interview turns to the spec trap. Apple maintains improvement but is selective: it ignores refresh rates beyond what the eye can see, and invests instead in features nobody asked for, like Face ID and AirPods. The phone became a machinery of vanity because the supply of cameras created demand for image editing, not the other way around. Christensen thought Apple would be disrupted by the low end. The honest answer for why it isn't is: culture, held together by extreme diligence. →


    Nota Bene

    Morgan Stanley reiterates $330 price target with bull-case $440 → Morgan Stanley reiterated $330 with a $440 bull case if WWDC unlocks an AI re-rating. Apple does not respond to market fads, and a multiple above 40 is almost never experienced. Disappointment after WWDC is nearly guaranteed because it has always been a software and tools show. →

    Citi reiterated a Buy rating and a $315 price target → Citi reiterated its Buy and $315 target ahead of WWDC, expecting a revamped Siri to make Apple an edge AI winner. Edge AI is inevitable, but it was also inevitable two years ago. The target is already priced in, making the AI story a non-starter. →

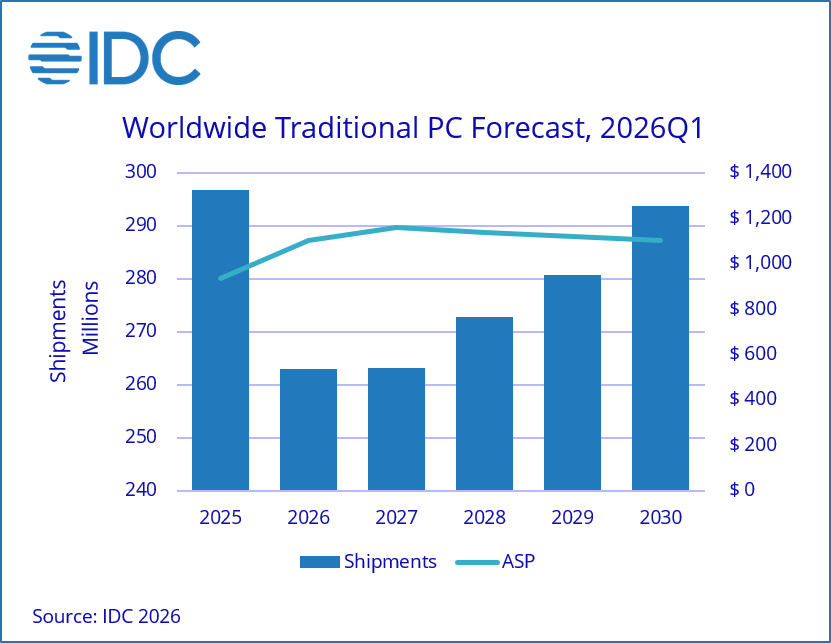
    Q4 PC shipments are expected to fall 20% year-over-year, 11.3% for the full year → IDC now sees PC shipments falling 11.3% for 2026 and 20% in Q4, with no recovery in volumes until after 2030. The MacBook Neo is the only thing keeping the broader notebook forecast from being worse. This is a multi-year opportunity for Apple that may reset PC market share dynamics permanently. →


    Asymco One gives you full access to our research, analysis, and commentary. Subscribe with code BULLETIN for a discount.

    Feedback: Have questions or comments? Reach out to us at contact@asymco.com. We'd love to hear from you.

  3. 42% of Apple Analysts rate it a Hold or Sell

    Research · 3 comments

    Another 10% do not provide a rating.

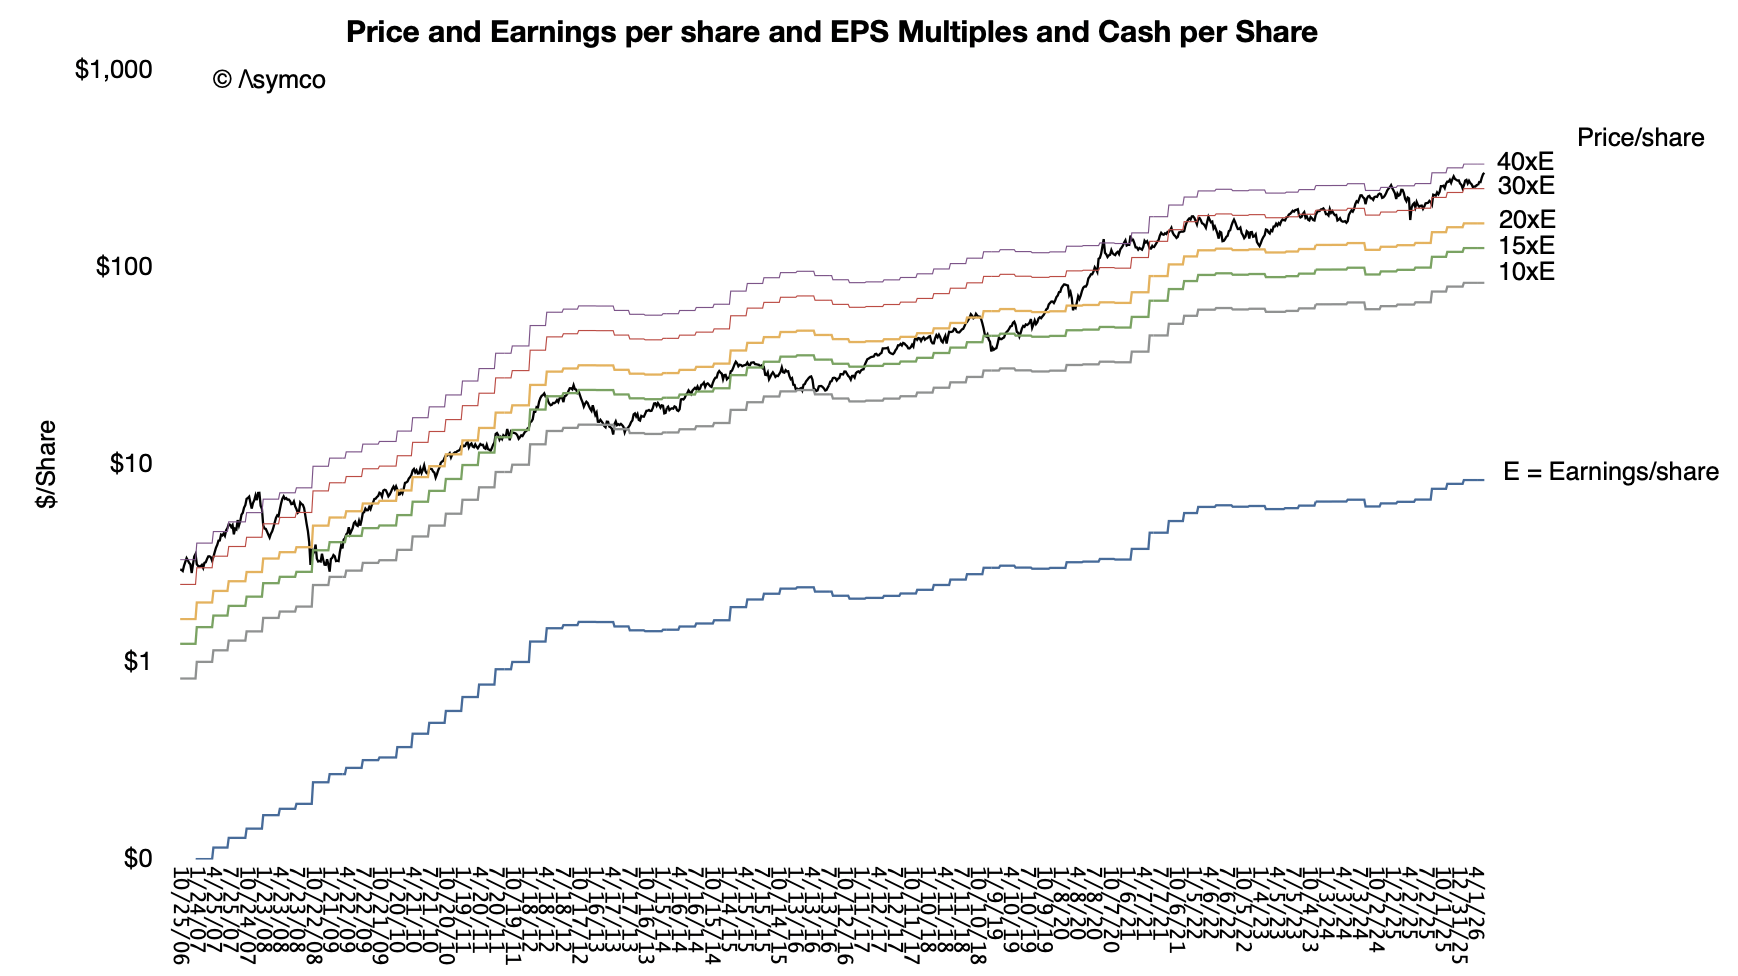
    Over the past 20(!) years, Apple net income has grown at a compounded annual growth (CAGR) of 26.6%, Revenue growth has compounded at 21.5% and share price has compounded at at 27.7%. That means the company has been doubling at least every 3 years for more than 20 years.

    The graph below shows share price and yearly earnings (and multiples of those earnings) since 2006. Note the vertical scale is logarithmic. The Price line has been growing at 27% or doubling every 2.6 years. The exercise of predicting the share price based on extrapolation is left to the reader.

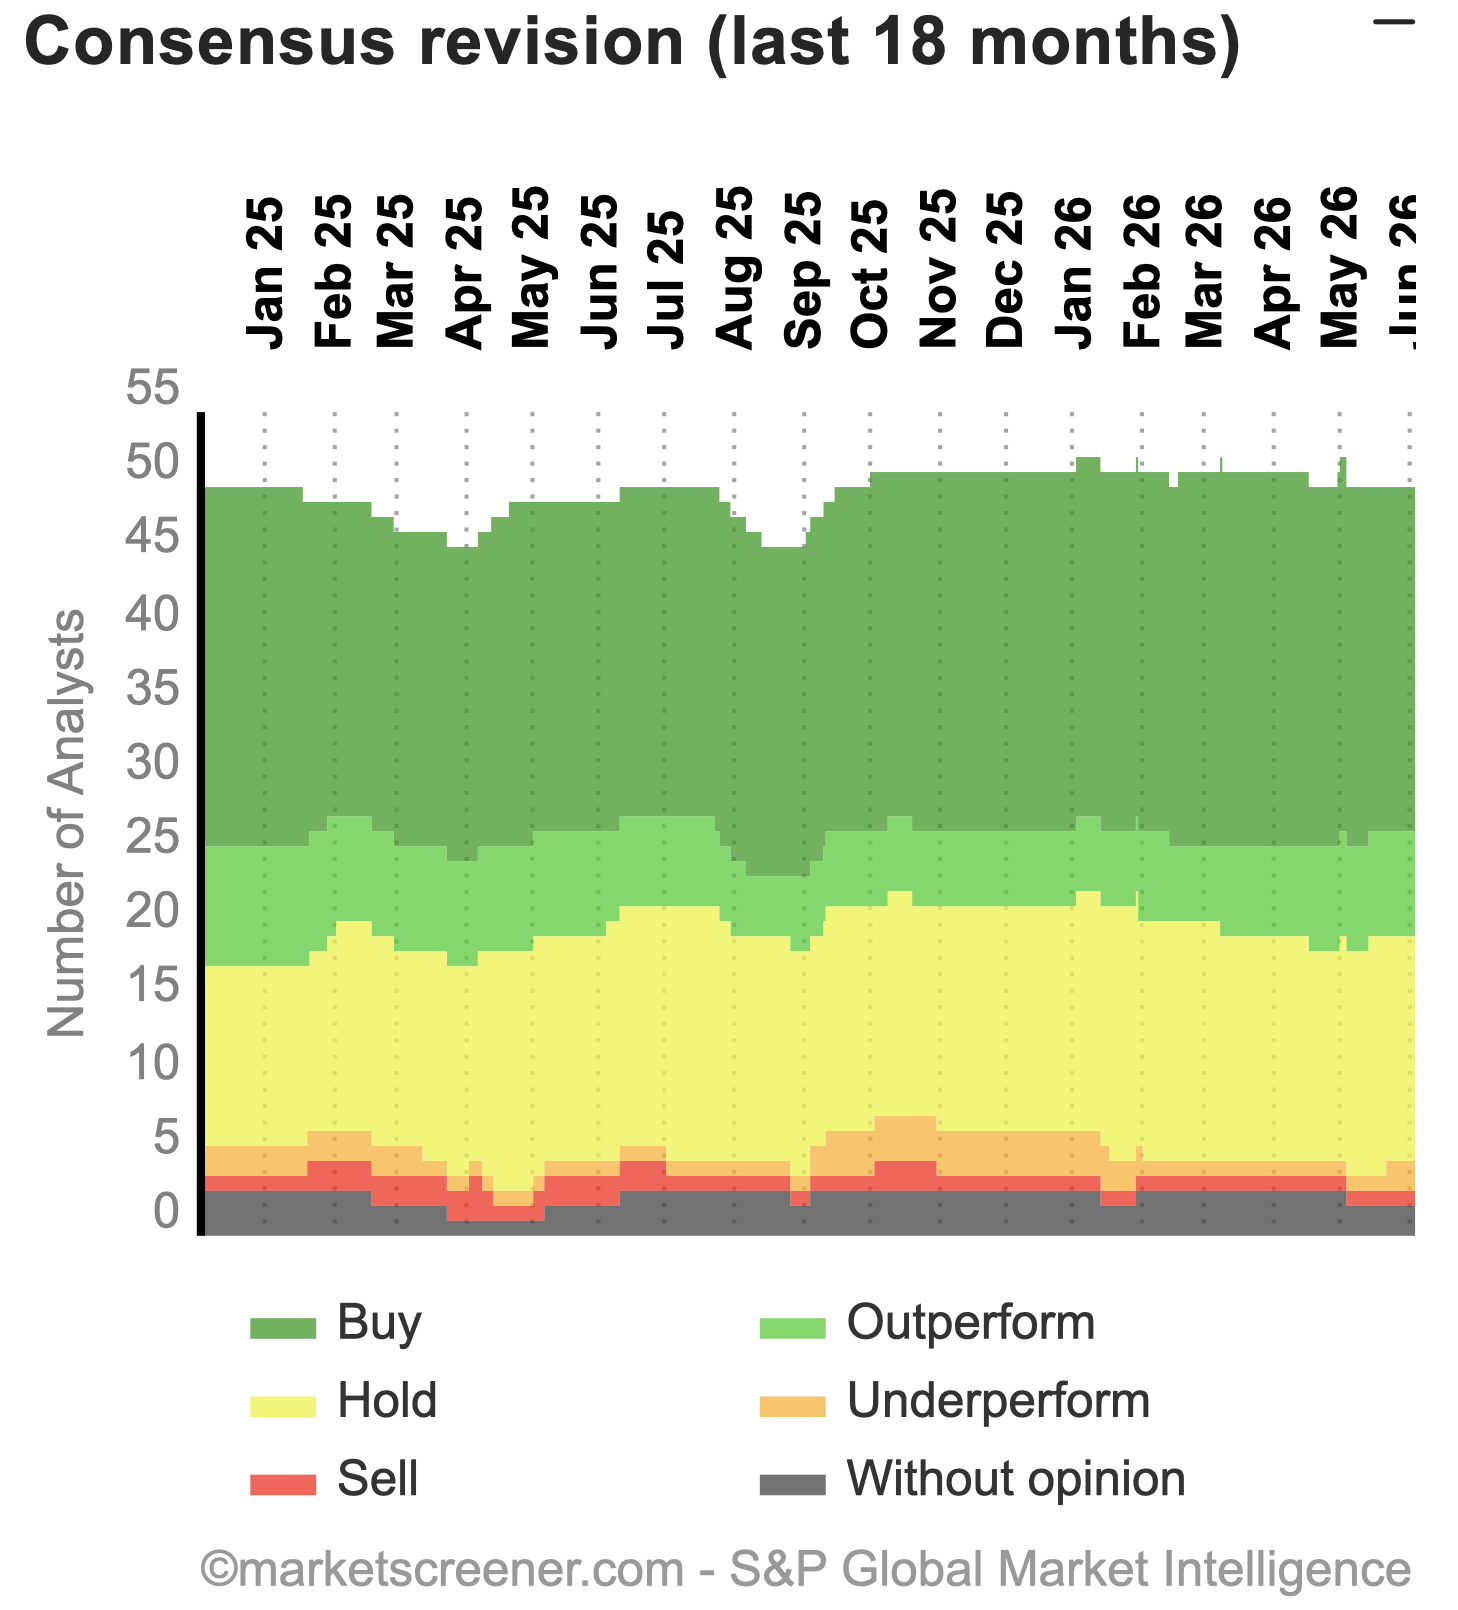
    In spite of this, data shows that 21 out of 49 analysts who follow Apple have the equivalent of a "Hold" or "Sell". An additional 5 follow it but have no opinion.

    It takes significant courage to predict a reversal of a 20 year trend. That a majority of analysis implicitly or explicitly believe Apple is on the precipice of failure may come as a surprise given the recent rise in price and optimism around AI. The graph shows the percent of Hold/Sell/Underperform/no opinion has been rising.

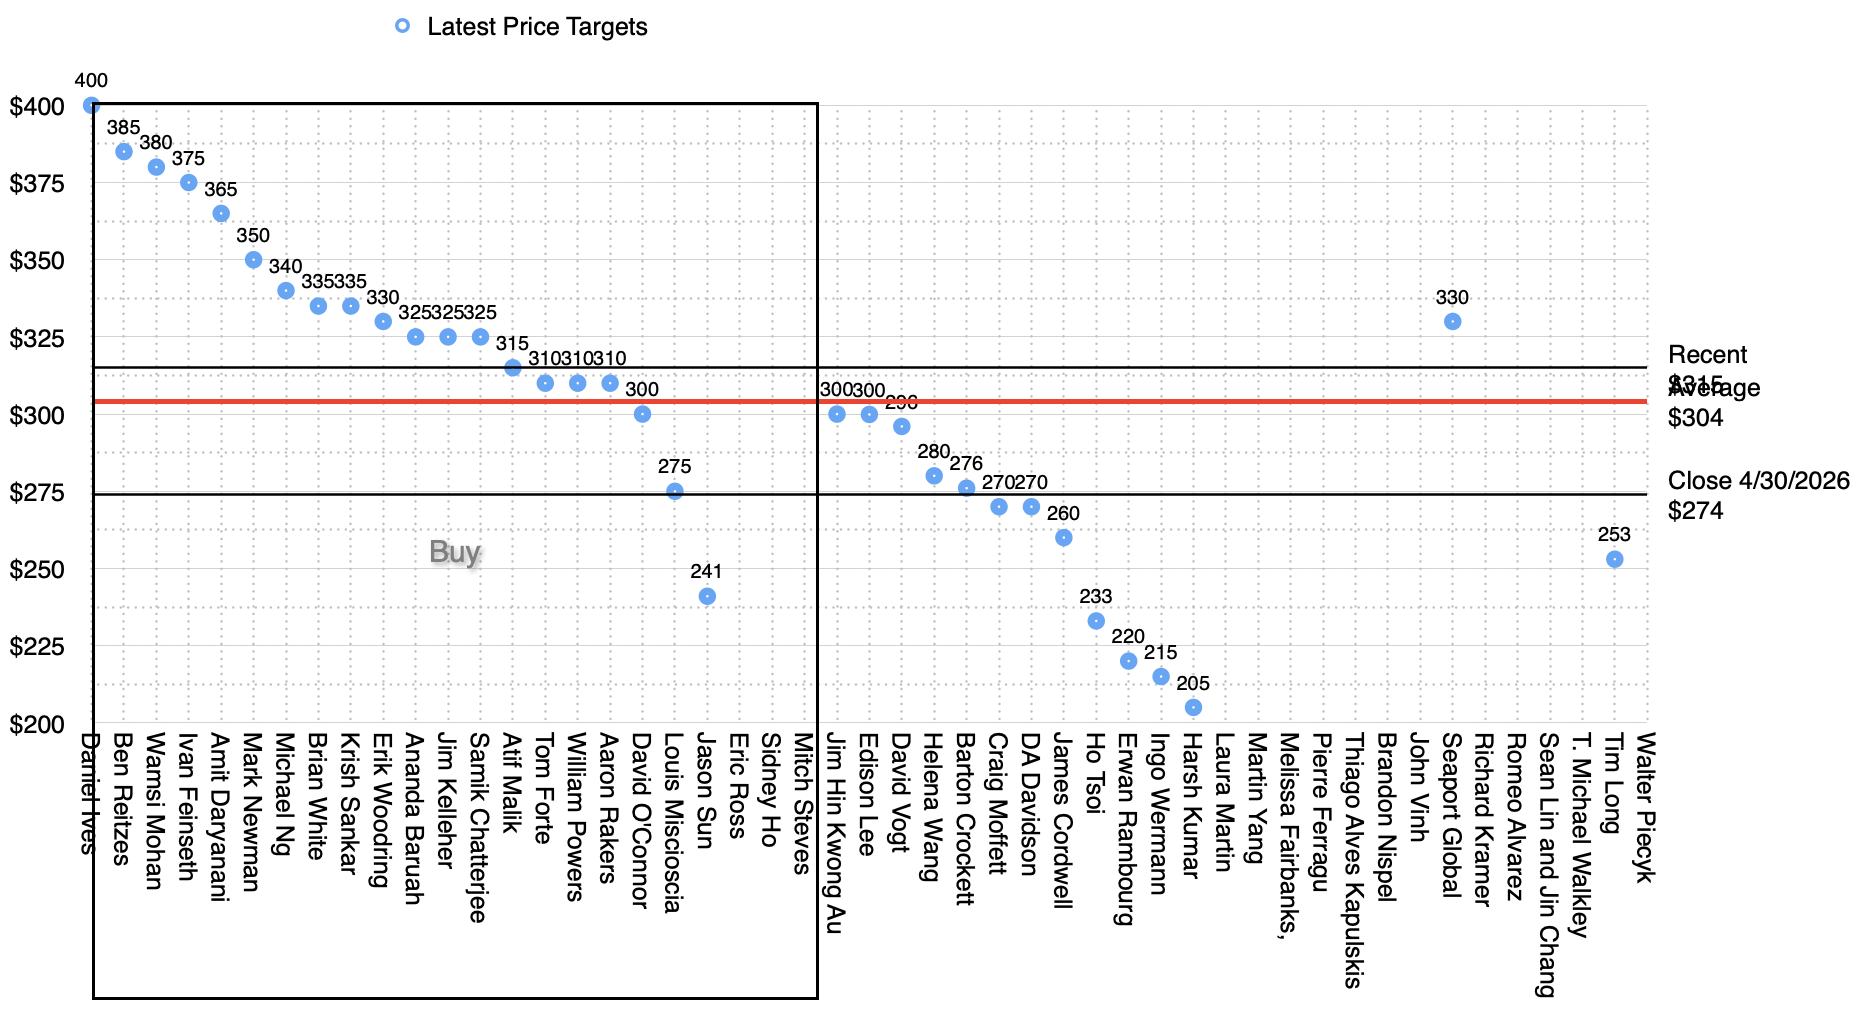
    The graph below shows the targets published recently.

    The targets are sorted by rating and then value. The "Buy" rated are encapsulated, the rest have all the other ratings. The Red line is the average of all ratings. Some of the ratings and targets, especially the lowest, are out of date.

    We will be discussing this and other Apple-related topics at our upcoming June Office Hours on Tuesday, June 9th, 2026 (day after the WWDC'26 keynote.) Sign up today!

  4. Q4 PC shipments are expected to fall 20% year-over-year, 11.3% for the full year

    Nota Bene · 7 comments

    If it wasn't for the MacBook Neo the fall would have been much worse.

    IDC now forecasts global PC shipments will decline 11.3% for the full year, with conditions worsening progressively through Q4, when shipments are expected to fall 20% year-over-year.

    Pull-forward demand masked the problem, temporarily

    The first quarter of 2026 offered a deceptively encouraging signal, with shipments growing 3% versus the same period last year. But that strength was largely borrowed from the future. Buyers, both consumer and commercial, accelerated purchases ahead of anticipated price hikes and product availability constraints.

    Pull-forward demand masked the problem, temporarily

    “The anticipation of rising prices and of limited availability of some system configurations due to memory and other component shortages has led some end-users to make purchases earlier than anticipated,” said Jean Philippe Bouchard, Vice President of Devices and Consumers at IDC. “We’re not seeing any relief to the memory shortage situation before the end of 2027, which means prices will continue to rise and PC manufacturers will struggle to maintain full product portfolios for the foreseeable future.”

    One notable wildcard is Apple’s MacBook Neo, which has driven stronger-than-expected notebook demand and prompted IDC to revise its notebook forecast upward.

    Source: IDC

    NB: The problem is a memory shortage: PC manufacturers are struggling to maintain product portfolios.

    “The introduction of the MacBook Neo is putting real pressure on the entire PC ecosystem,” said Jitesh Ubrani, research manager for IDC’s Consumer Devices Trackers. “We expect vendors to respond with a combination of new silicon, a more efficient OS from Microsoft, and aggressive promotional pricing.”

    “The competitive pressure from the Neo is providing a partial offset to broader price increases, keeping some low-cost notebook options alive. But the overall trajectory for average selling prices (ASPs) is firmly upward. IDC forecasts ASP growth of 17% in 2026, and even as memory capacity expands over the next two years, pricing is unlikely to return to 2025 levels,” Ubrani added.

    As the graph shows, IDC forecasts no recovery in volumes until after 2030. This is a multi-year opportunity for Apple and may reset market share dynamics permanently.

  5. Morgan Stanley reiterates $330 price target with bull-case $440

    Nota Bene · 3 comments

    AI or bust

    Morgan Stanley analyst Erik Woodring believes Apple’s upcoming Worldwide Developers Conference could begin to change that perception. The 5-star analyst reiterated his Overweight rating and $330 price target, arguing that a successful AI strategy could unlock a higher valuation for Apple stock, with a bull-case scenario reaching as high as $440 per share.

    He noted that Apple’s recent strength has been driven by its products and services business rather than AI. However, companies viewed as “AI winners” have often earned higher valuations over the past two years, and Woodring believes Apple could soon be seen as one of them.

    Why WWDC Could Be a Turning Point for Apple

    Woodring believes Apple now has more of the tools needed to compete in AI. He pointed to Google’s Gemini models supporting Apple Foundation Models, Apple’s strong focus on privacy, and what appears to be a renewed push around Siri and Apple Intelligence.
    Unlike many of its rivals, Apple is not spending heavily on building AI infrastructure. Instead, the company can use its massive base of iPhone, iPad, and Mac users to bring new AI features to consumers. That approach could help Apple grow its AI offerings without the huge costs faced by some competitors.

    The analyst also sees an opportunity for Apple to help ease some of the industry’s AI capacity constraints. A more capable Siri and improved Apple Intelligence platform could bring AI tools to millions of users through Apple’s existing ecosystem.

    For investors, the bigger story may be valuation. Woodring believes that if WWDC shows a clear path for Apple’s AI plans, the stock could earn a higher multiple. In that scenario, he sees shares reaching $365 to $385, with a bull-case valuation of as much as $440.

    Source: TipRanks Financial

    NB: Not much new here but a $330 target is not much above the $315 high recently reached. Perhaps this is his foreshadowing of upgrades post WWDC…

  6. IDC Forecast: The smartphone market is on track for its worst year ever

    Nota Bene · 2 comments

    AI-driven memory shortage continues to hammer sales; Android sales to drop 20%

    According to analysis firm IDC, smartphone shipments are headed for a 13.9% decline in 2026, a downward revision from the 12.9% decline IDC had anticipated for the year in February. It would also mark the steepest drop in smartphone history, the company said.

    “these pressures are compelling vendors to reduce shipments, raise prices and concentrate on higher price tiers — elevating smartphone [average selling price] to a record $550, up $100 from last year,” IDC senior research director Nabila Popal said in a statement.

    “2026 will be a defining year for the industry as [a] new reality of structurally higher costs take hold,” she added. “For consumers, it means the era of ultra-cheap smartphones is over. For vendors, it means only those that can adapt their strategies to this new cost environment and sustain demand at elevated price points will survive.

    The broader Android smartphone market is set to take the biggest hit, with IDC projecting a 20% year-over-year drop in shipments. Despite that, Samsung is expected to increase its market share in the space at the expense of smaller smartphone companies thanks to its midrange and premium device lineups.

    Apple, the research firm said, is also expected to perform relatively well, with shipments forecast to fall 5.2% on the year, an improvement from a previously anticipated decline of 8.1%.

    In its most recent earnings report, Apple announced iPhone revenue growth of 20% for the second consecutive quarter, thanks to its strong iPhone 17 lineup and improved sales out of China.

    But CEO Tim Cook also warned of supply constraints due to both the memory shortage and the dearth of iPhone processors.

    See also: The Smartphone Market is Cracking.

    Source: Yahoo Finance

    NB: I would add that Apple also announced that revenues for June quarter would increase at the same rate as they did for March quarter, thus for at least half the year the company will achieve 20% growth in iPhone sales. This is in sharp contrast to both what IDC and Omdia have been reporting.

  7. Bank of America increases AAPL price target considering agentic and on-device AI

    Nota Bene · 4 comments

    Upgrades keep coming but are they justified?

    Bank of America upped its price target on the tech giant, citing a potential boost from agentic artificial intelligence.

    Shares rose 0.5% in premarket trading.

    “In an agentic world, value accrues to the platform that controls user intent, personal context, app access, permissions, identity, authentication, payments, and trust,” analyst Wamsi Mohan wrote in a note to clients. “Smartphone is the scaled consumer device where these factors already converge. If AI assistants become the new front door to search, apps, commerce, scheduling, payments, and workflow completion, we think Apple should have meaningful leverage over model providers, app developers, merchants, advertisers, and payment networks.”

    Mohan raised his price target to $380 from $330 and reiterated his Buy rating on Apple.
    Delving deeper, Mohan said that the company's benefit in agentic AI comes from its semiconductors and iOS, as Apple's silicon can dictate what happens on a devices (which is important for latency, reliability, privacy and costs) and iOS will determine how the AI is used by the user. “Our analysis around token usage suggests Apple will need to rely on distributed compute (on device), Private Cloud Compute and third-party compute to deliver a robust AI experience,” Mohan added. “Removing the net cash neutral target, in our opinion, is a reflection of a new period of AI-driven investments to enable this agentic era.”

    As such, Mohan believes that the coming Siri redesign needs to be integrated into the iPhone and make it an agent that is capable of understanding intent, retrieving context, bringing up apps, and completing workflows. If this were to happen, an agentic version of Siri could boost fiscal 2030 revenue between $15B and $30B, or as much as $40B to $65B if users really became acclimated to it.

    Source: Seeking Alpha

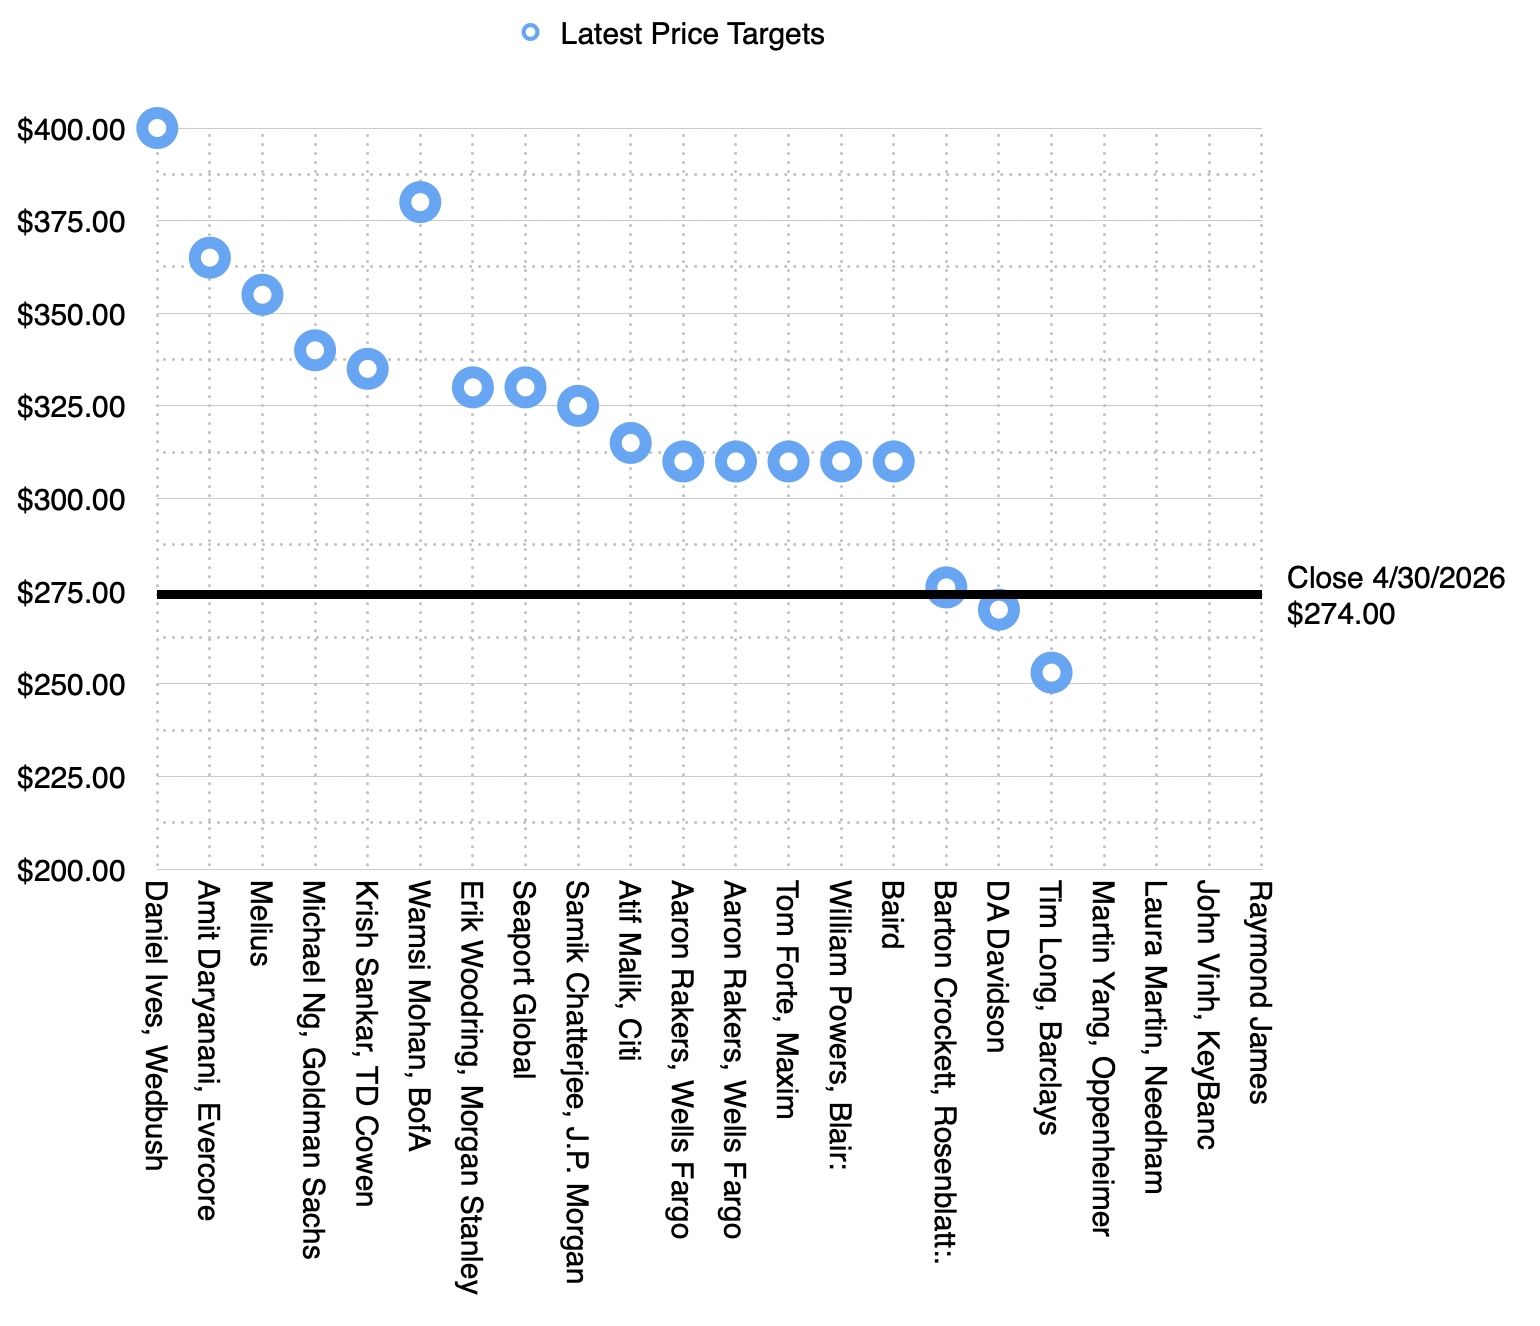
    NB: Updated price targets with BofA change highlighted.

  8. The problem with the P/E ratio

    Research · 1 comment

    Why the most common measure for valuation is inadequate in an age of AI

    Software and services companies like Google, Microsoft, Amazon, Meta are spending on Capital Expenditures at the rate of heavy industry manufacturing. This defies their description as "asset light" business models which depend on services, distribution or platform economics.

    The problem isn't just semantic. It is that for their entire existence, these companies were valued for their profitability and measured in terms of a P/E ratio and earnings growth. The situation has changed dramatically. Their revenues are up, the earnings are up and growth is up and share prices are way up. But not their P/E ratios. Why is this?

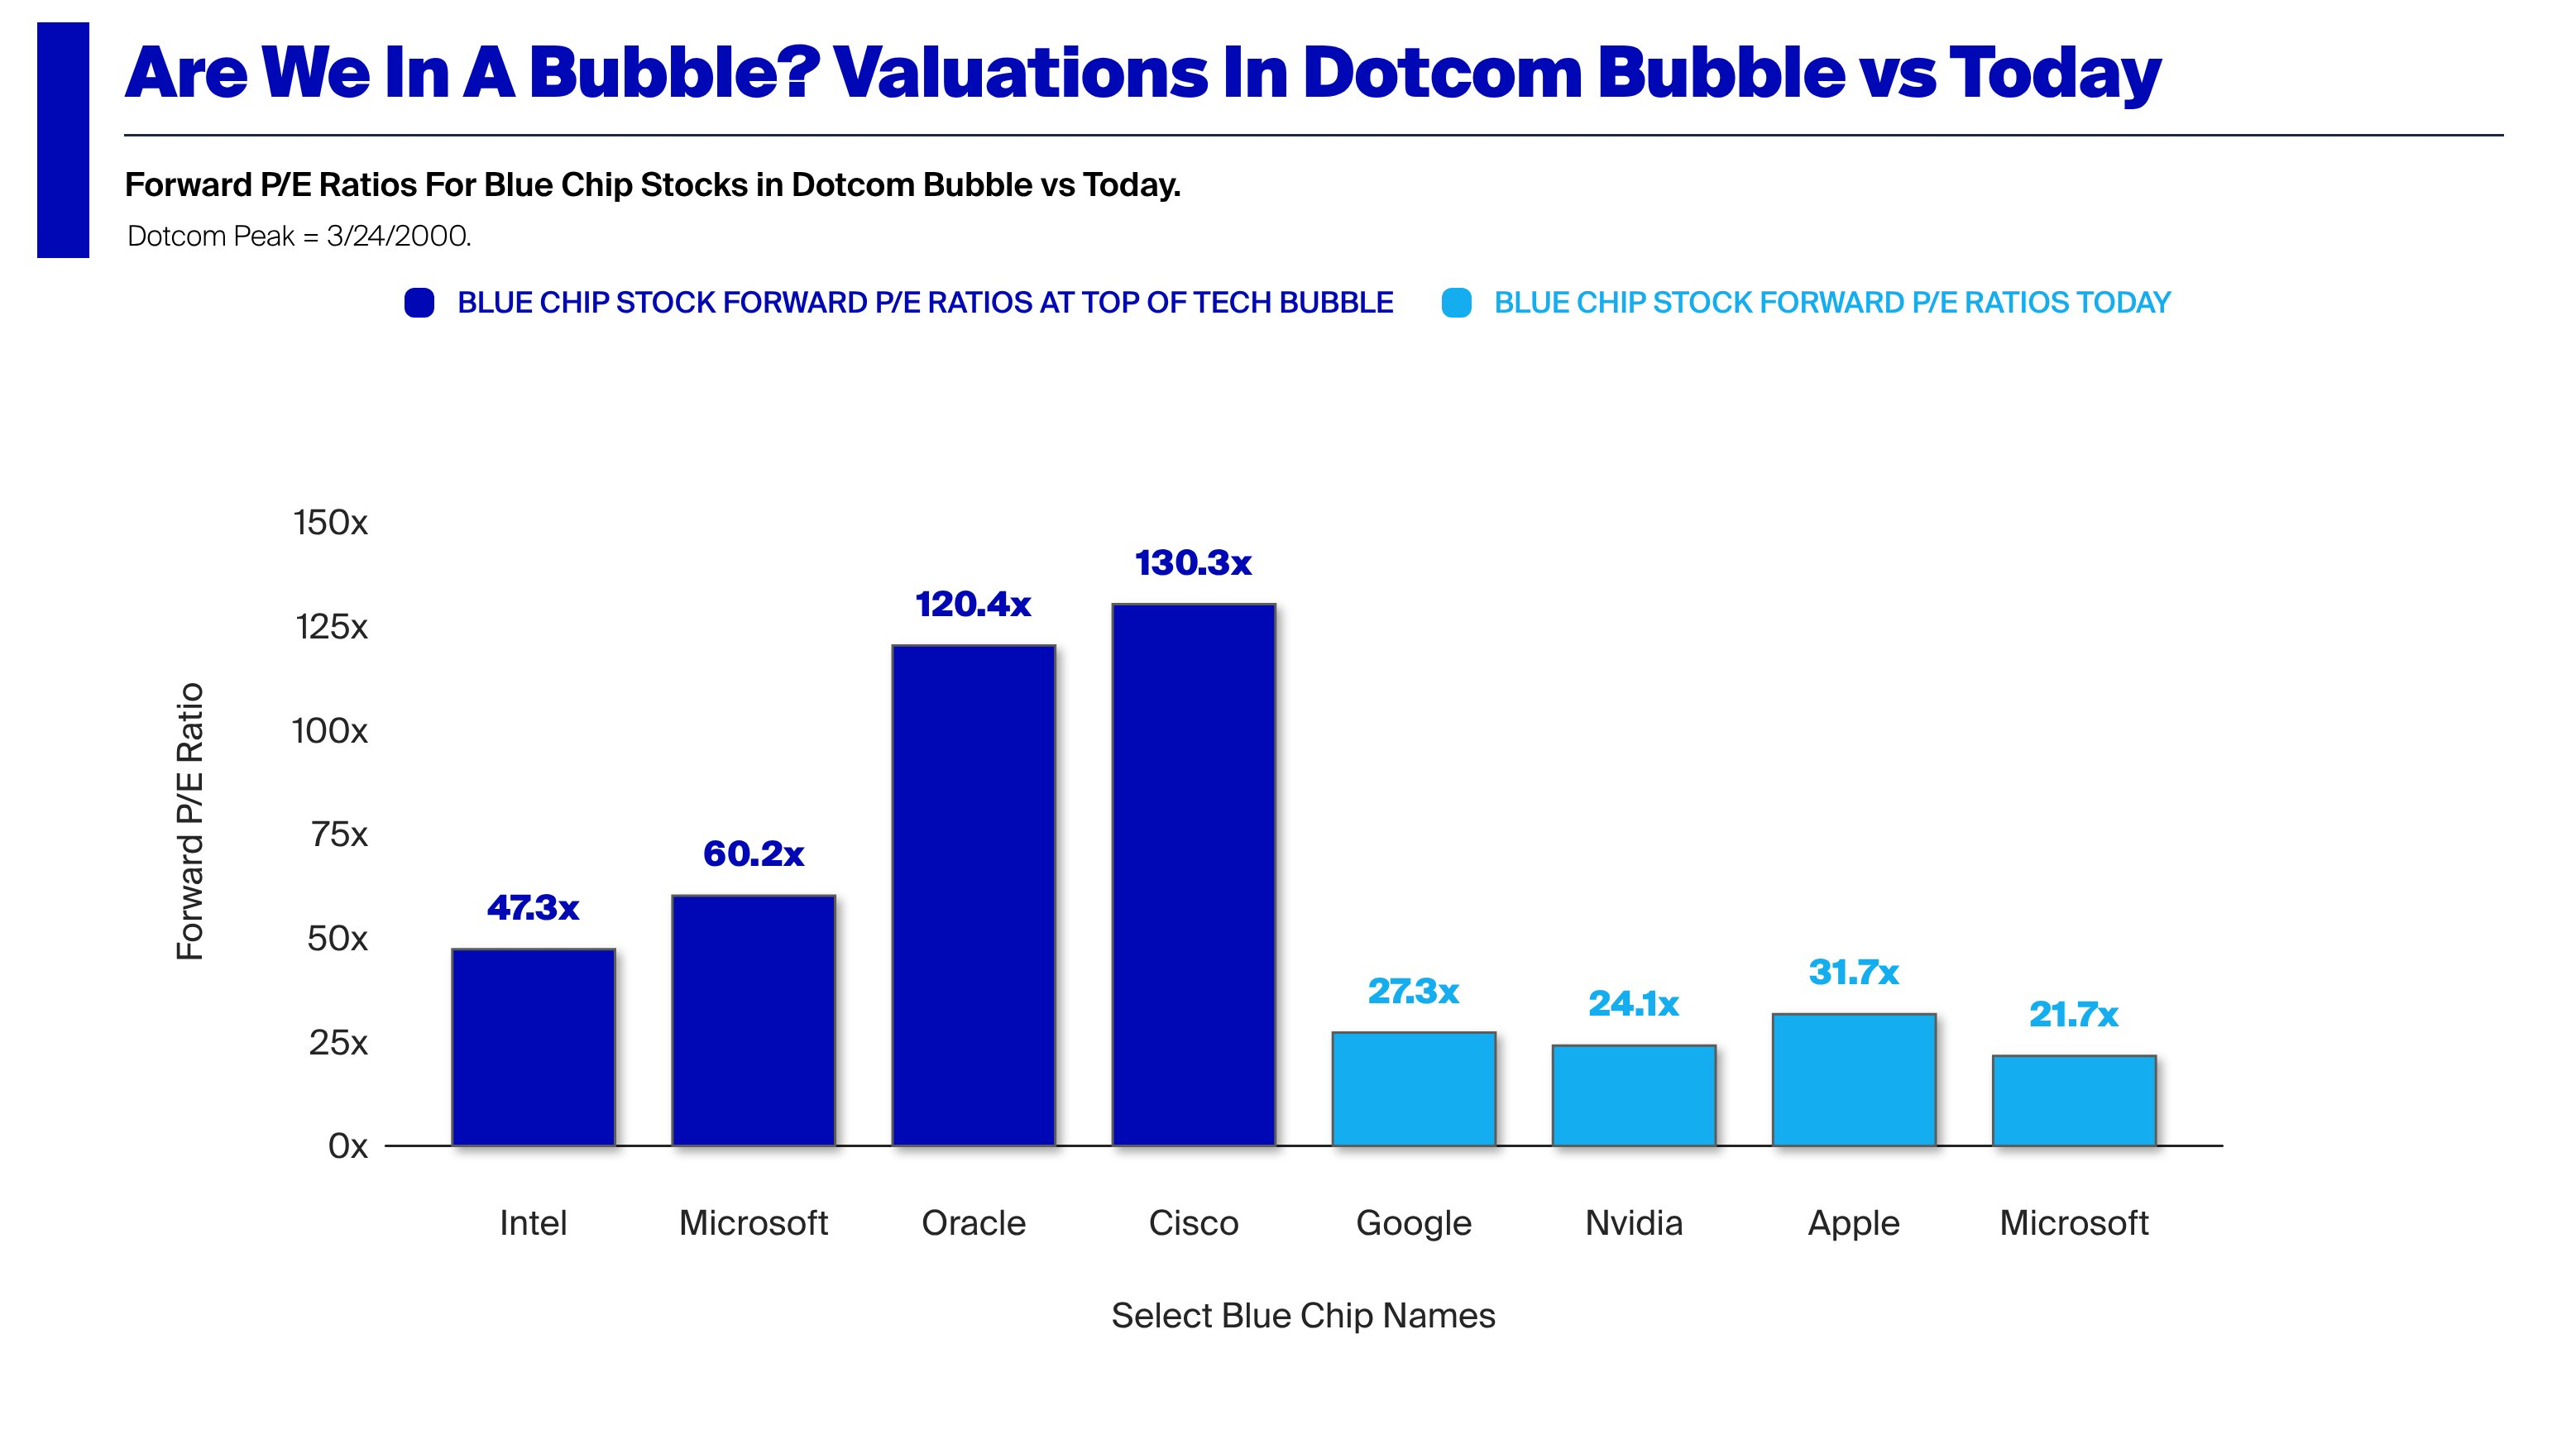
    Consider the graph below showing the (forward) P/E ratios of the Dot Com market leaders vs. the market leaders today.

    This even as share prices and value concentration have risen even faster than in the Dot Com era. Seen from the P/E basis, it does not look like we are in a bubble. Earning growth is way up so the share prices are not outrageous on that basis. That is contrary to 1999 when P/E ratios in the hundreds were considered normal. Expectations of an internet fueled boom were speculative. Expectation of an AI earnings boom seem well founded.

    But these companies could still be over-valued. The P/E ratio is not the full picture. It is in fact a simplifying shortcut which ignores significant pockets and omissions of value.

    For this analysis I'll use a sample including some of the largest market caps in the world with two exceptions. The exceptions are Lilly (LLY), Berkshire Hathaway (BRK-B) which are on the list but not in the top 10 (though in top 15) and Saudi Aramco and Broadcom which are in the top 10 but not on the list[1].

    CompanyMarket Cap
    NVDA$5,709,746,405,376
    AAPL$4,379,916,369,920
    GOOG$4,811,891,146,752
    MSFT$3,041,424,048,128
    AMZN$2,874,514,866,176
    TSM$2,166,463,135,744
    TSLA$1,664,912,326,656
    META$1,569,837,154,304
    BRK-B$1,044,046,610,432
    LLY$897,716,060,160

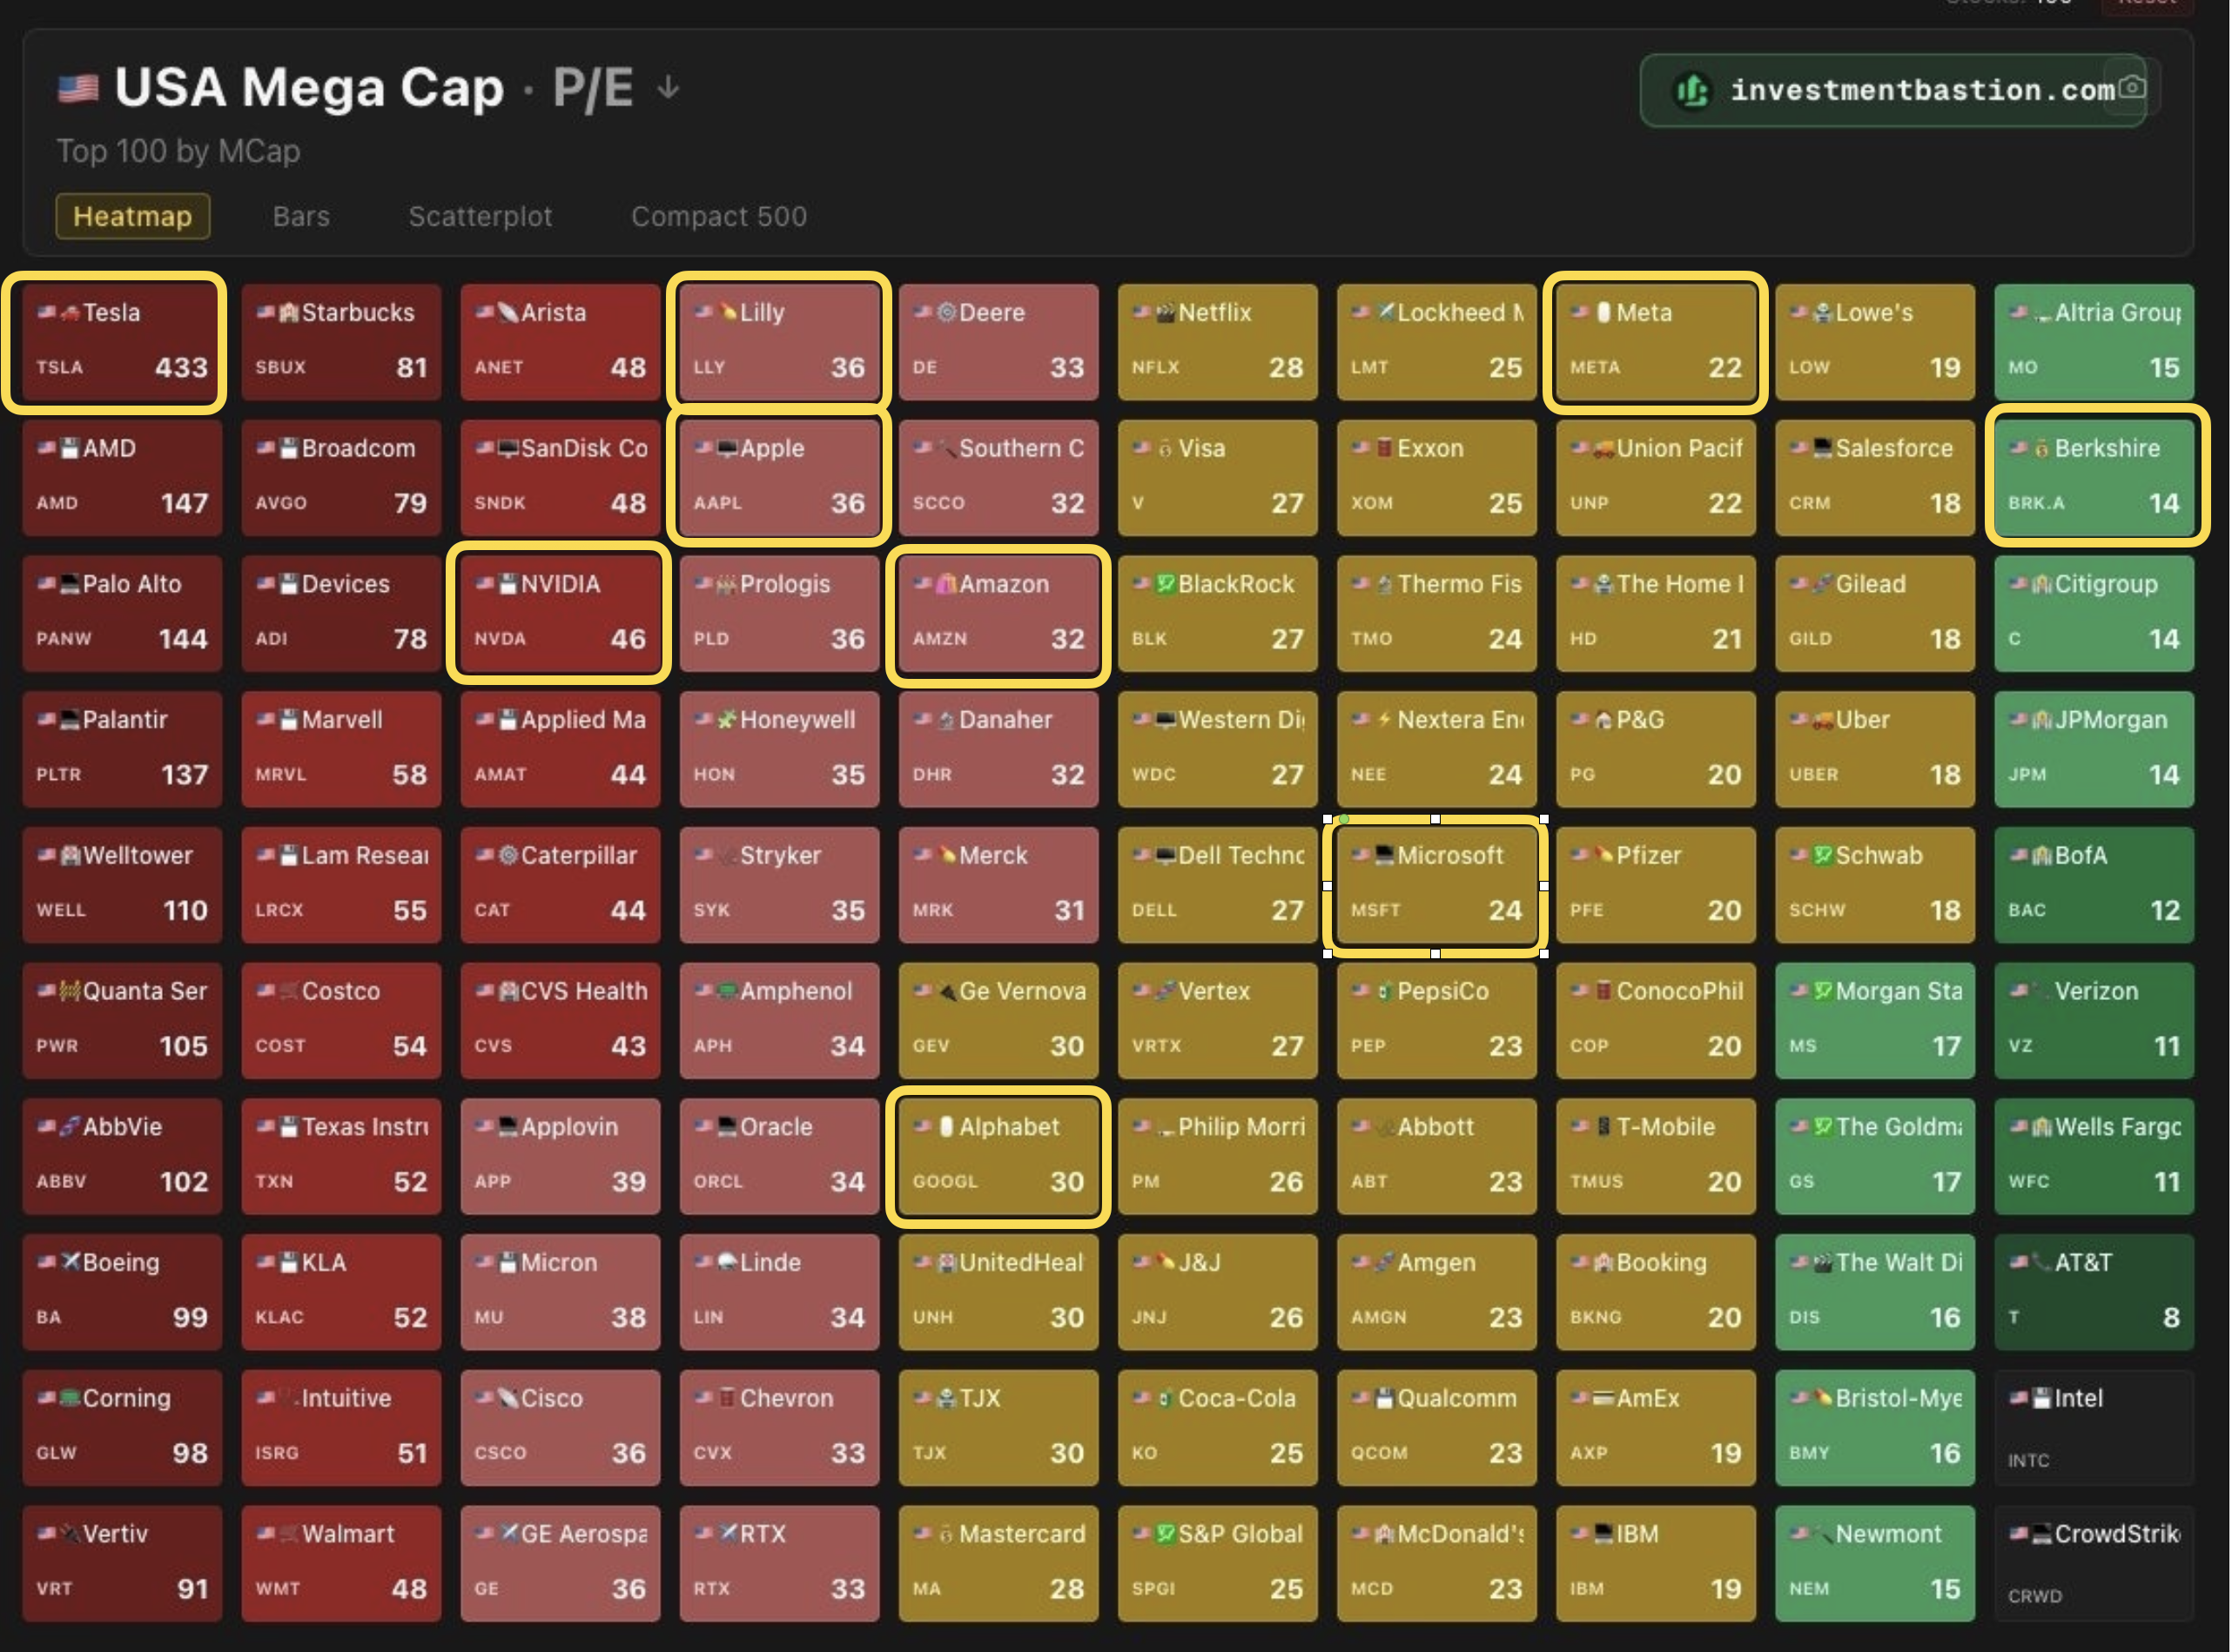
    The following diagram shows the P/E ratios of the sample relative to the top 100 US market caps[2]. Note that, with one exception, the companies are not in the dark red zone with above P/E of 60. The exception is, of course, Tesla, which, at P/E of 400+ is 14x the average multiple.

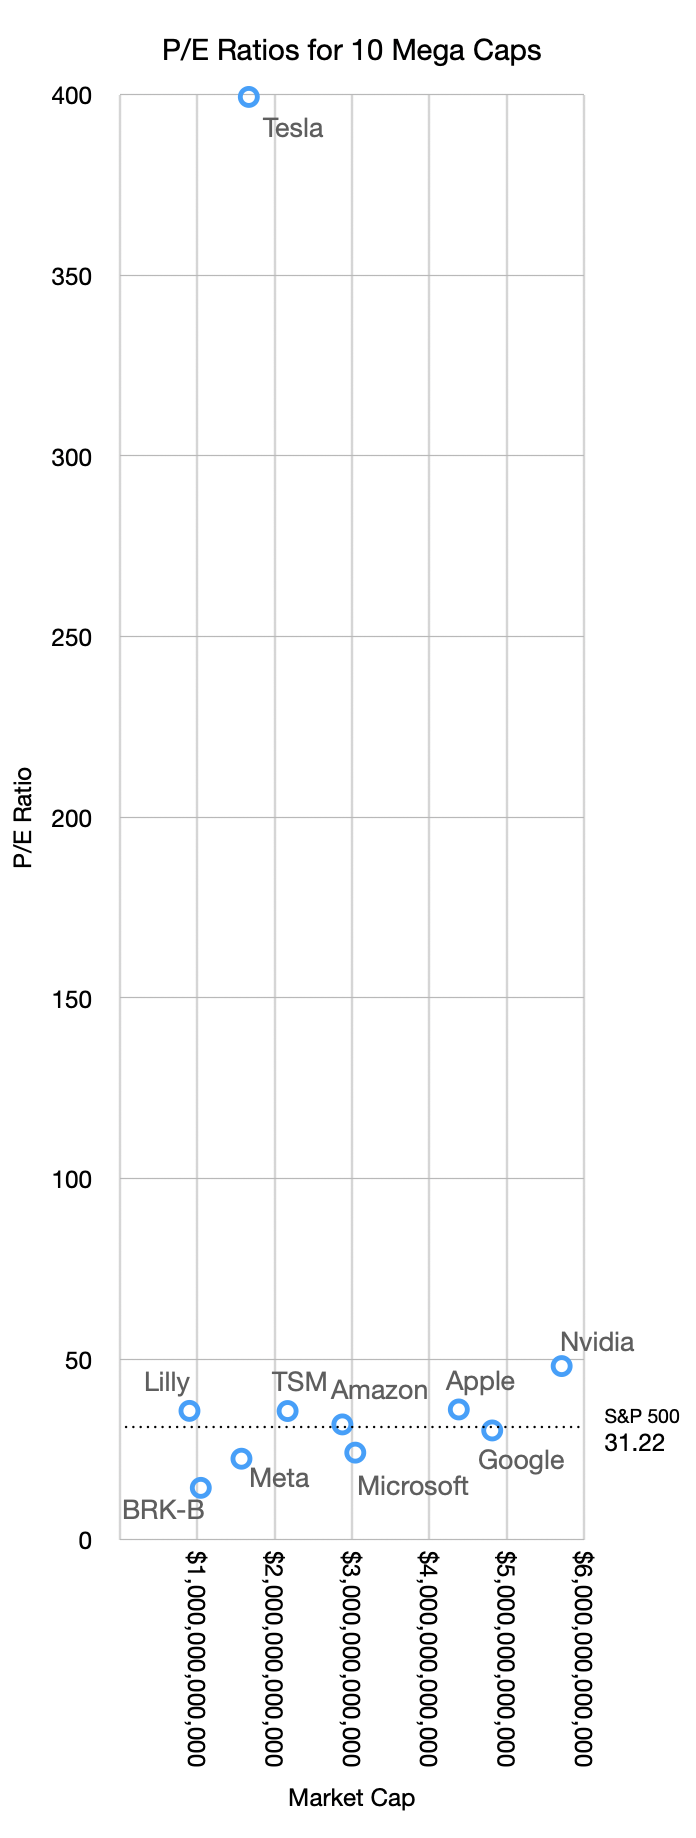
    Moreover, compared with the S&P 500, these P/E ratios are in-line with the median. The following graph shows the sample set with P/E ratio vs. Market Cap.

    Excluding the one anomaly the relationship seen is that higher market caps roughly correspond to higher P/Es. Nvidia has a market cap over $5.7 trillion with a P/E of 48 while Meta has a market cap of $1.5 trillion and a P/E of 22.5.

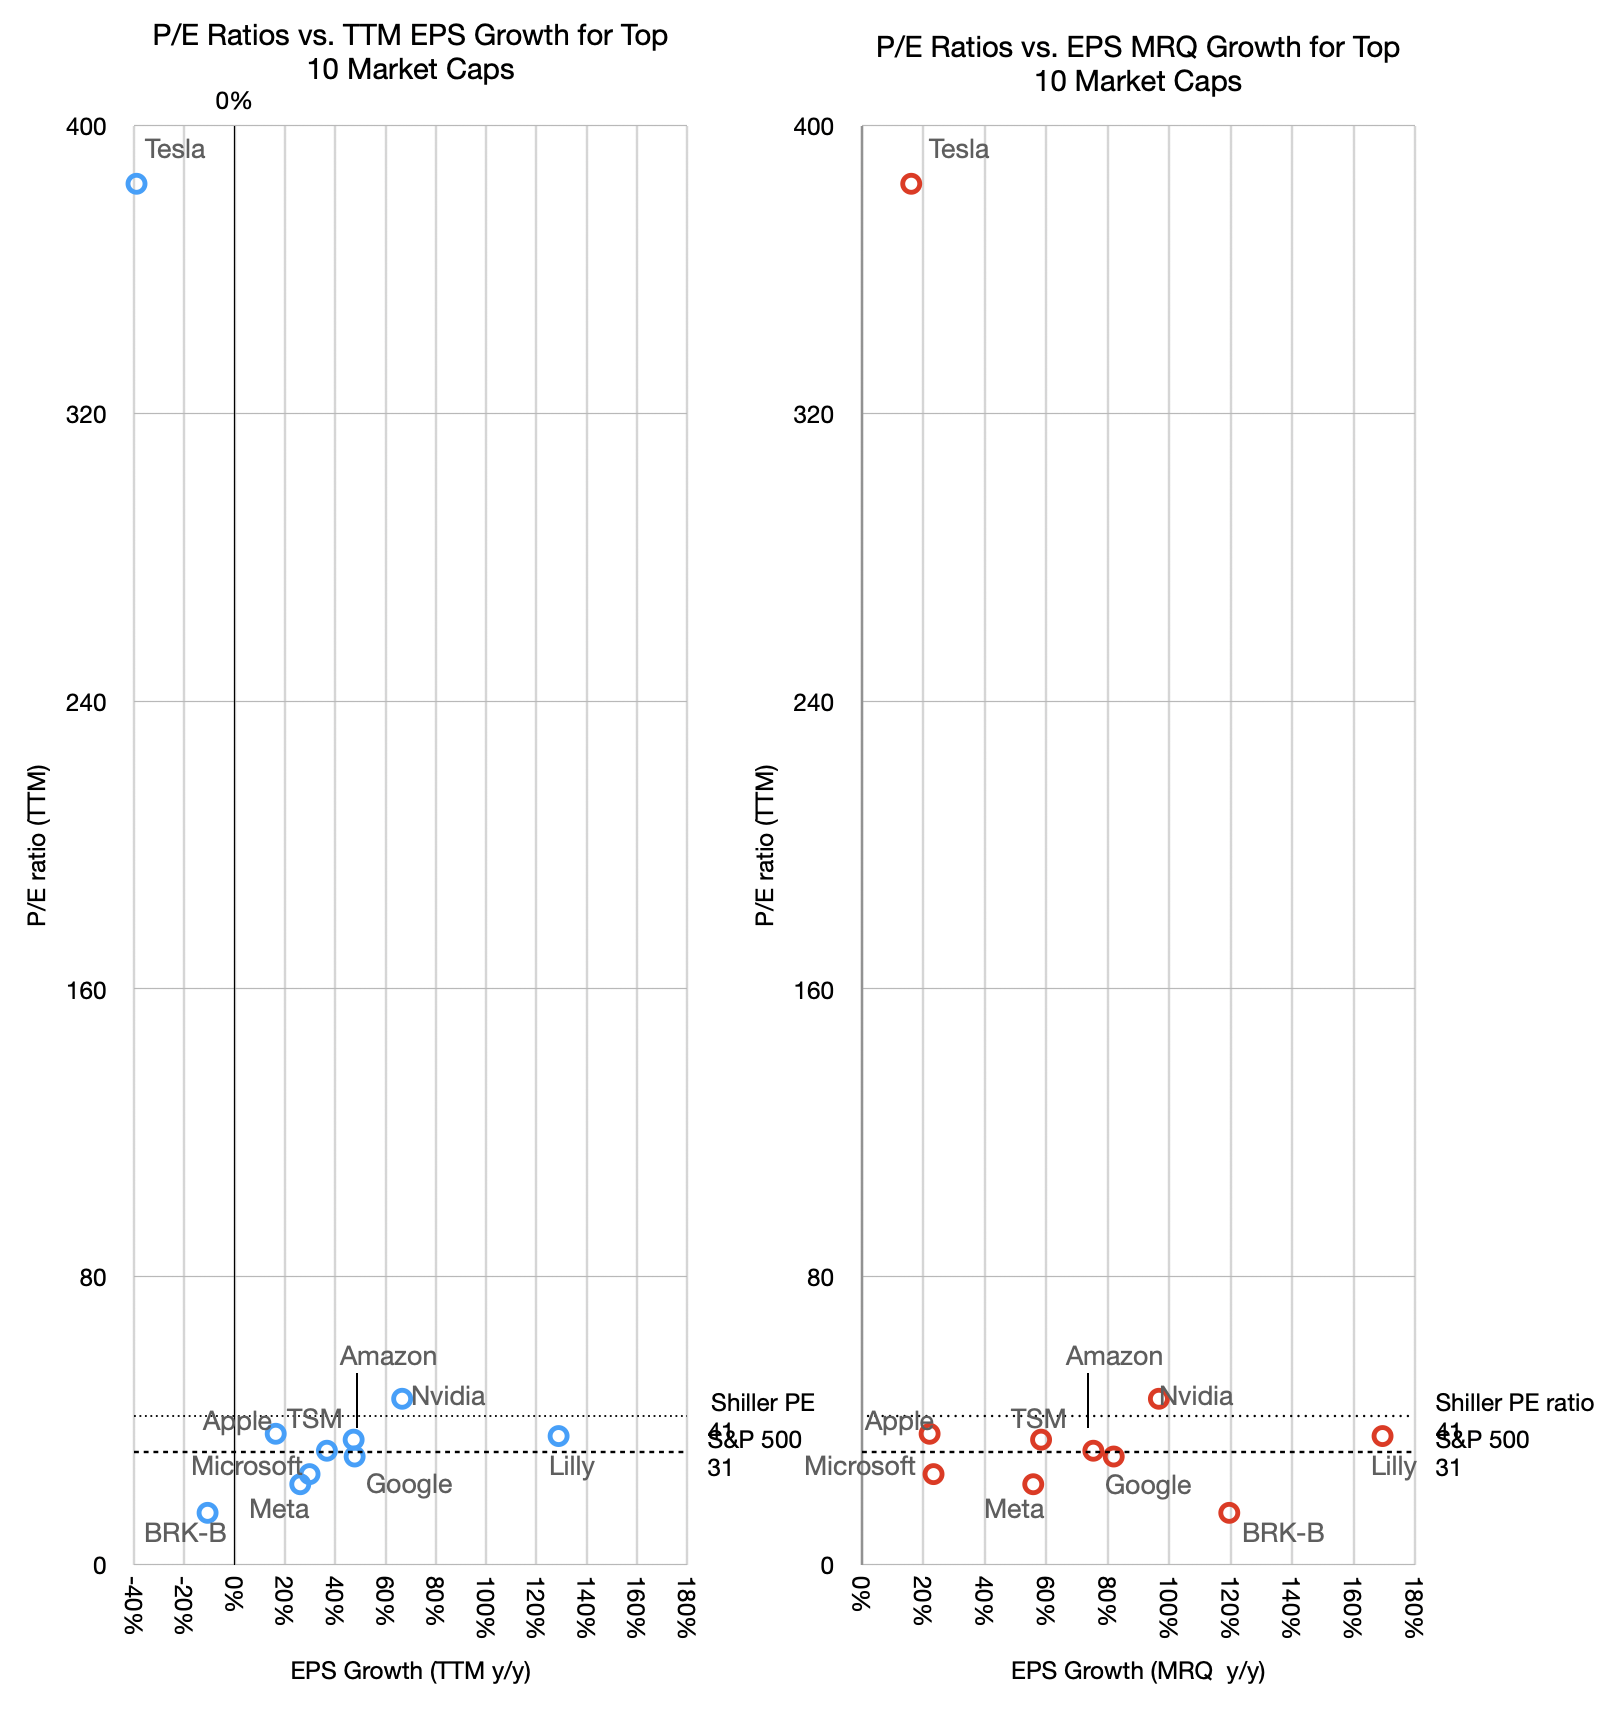
    Higher P/Es should also correspond to higher growth rates. The graph below shows the relationship between P/E and growth, both in the most recent quarter (MRQ) and trailing twelve months (TTM).

    There is a loose relationship between P/E and TTM growth but not with last quarter's growth. The one anomaly is even more prominent as it shows negative growth with exceptional valuation. Fundamentally however the relationship between P/E and growth is weak. Companies having widely divergent growth show similar P/E ratios. Alphabet for example has seen its P/E ratio in the 20s with growth in the 80s TTM and 50s MRQ.

    This might sound familiar. From 2008 to 2020 Apple was trading at a P/E ratio in the teens and low 20s while growing as fast as 80%. The logic was captured by my analogy of the goose that lays the golden eggs. Apple was able to create extraordinary products but the market considered such hits fleeting. It valued consistency over heroism. Getting on base vs. home runs. And so the P/E began to rise only once Services became more prominent. Regardless of how foreseeable this pattern was, it took a decade and is still ongoing for the pricing to catch up.

    But the situation with AI companies (that is, all the big tech companies but Apple) is that their earnings today are somewhat an illusion.

    An old maxim that says "earnings are an opinion while cash flow is a fact.[3]"

    This is because Net income can be manipulated by accounting abstractions, whereas cash flow is based on bank transactions.

    To wit: Net income (earnings) is calculated using accrual accounting, which relies heavily on judgment calls rather than bank balances. Companies recognize revenues the moment a contract is signed, even if the cash won't be collected for months. Or they can dial in a delay as they desire.

    Because of varying accounting policies, two identical companies with the exact same physical business can report vastly different earnings figures.

    Cash flow is objective and simply tracks the actual movement of money in and out of the business. Real dollars either enter the bank account or they don't. A company can look highly profitable on an income statement but still go bankrupt if its cash is trapped in unpaid invoices or unsold inventory.

    Finally, cash flow can be strongly negative while earnings are strongly positive. This is because investment in capital equipment does not appear in the income statement.

    Therefore true economic value is determined by the cash a company can actually distribute or reinvest rather than how it declares profitability based on accounting abstractions.

    AI companies are not necessarily hiding behind suspect earnings but their extraordinary capital expenditures are draining their cash and thus what investors have access to.

    Earnings seem to be soaring so the ratio P/E suggests a modest valuation. This is based on opinion or at least incompleteness.

    We should look at a better indicator. It's the EV/FCF ratio. We will look at this next.

    1. The top 10 ranking can change rapidly and it makes analysis difficult over longer time periods. The inclusion of LLY and BRK-B allow for visibility outside of the tech sector and they were in the list mid 2025. Saudi Aramco is in a completely different environment influenced by non-economic factors.
    2. TSMC is absent from the table as it is US only companies. It is notable perhaps that of the top 15, three are not US companies (TSMC, Samsung and Saudi Aramco). Furthermore the top Chinese company, Tencent is 25th, valued at $532 billion and the top European company is ASML at 21st and $610 billion.
    3. Attributed to economist Alfred Rappaport.
  9. Asymetric Episode 137 — E is Our Friend

    Asymetric Podcast

    Horace speaks carefully and with knowledge about opinions, facts and fantasies, and shares what he thinks John Ternus’s most important job is.

    Topics include:

    • Is a crash coming? 
    • The CapEx problem
    • AI and Apple
    • Convergence vs. fragmentation
    • Ternus and Apple's culture

    Now in Beta for asymco one subscribers

    Listen to Asymetric in your favorite podcast app.

  10. Apple was fastest growing Latin American smartphone vendor in Q1

    Research · 3 comments

    31% growth in a flat market

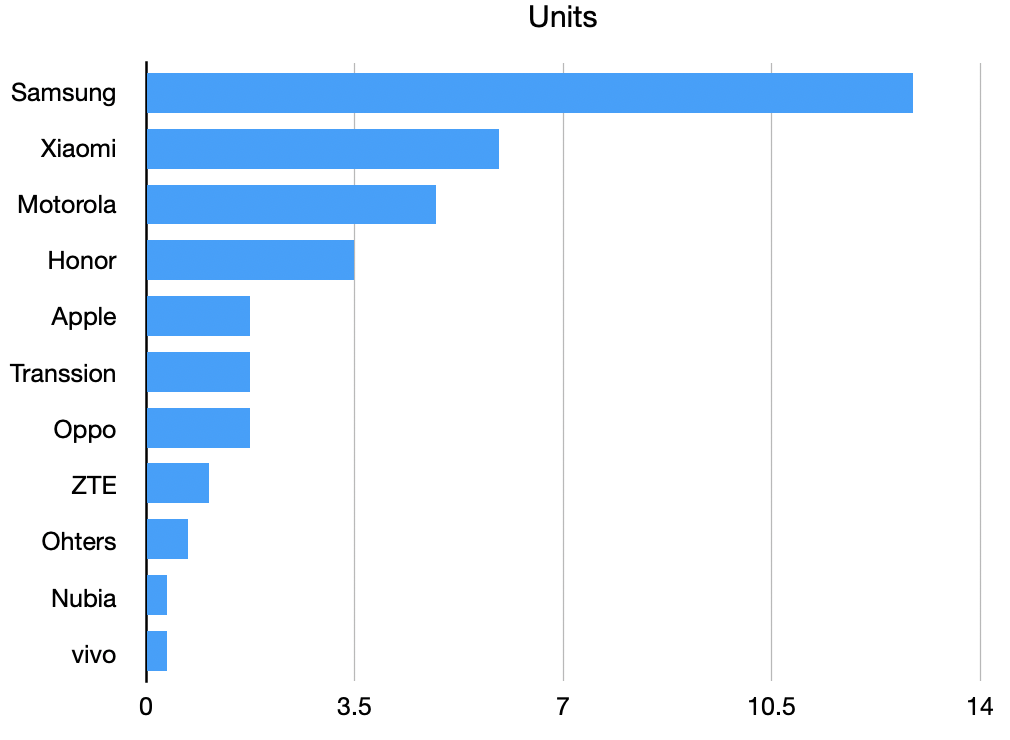
    The Latin American smartphone market grew 3% year over year in 1Q 2026 to 34.8 million units, supported by proactive inventory accumulation and the delayed pass-through of rising memory costs. Omdia analyzes the market’s uneven vendor performance, as Samsung and Xiaomi strengthened their leading positions, while HONOR and Apple saw sharp growth supported by entry-level and premium demand, respectively.

    Samsung led the region, shipping 12.9 million units (+9% YoY) and lifting share to 37%, its highest quarterly level since 1Q 2023, supported by strong performance of A‑series models across low‑end and mid‑high segments. Xiaomi held second, marking a sixth consecutive quarter of growth with 6.0 million units and 17% share, driven by double‑digit gains in Central America and Peru and solid traction of the Redmi Note 15 series in the mid‑high range. Motorola ranked third, contracting 5% YoY to 4.9 million units and 14% share, largely reflecting a 37% drop in shipments of US$100–US$200 devices, where G06 and G17 are key models. HONOR consolidated in fourth with 30% YoY growth to 3.4 million units and a 10% share, propelled by its Play 10 in the entry segment (below US$100), which approached half a million units sold for the first time.

    Apple completed the top five with a 31% YoY increase, supported by an exceptional performance in Mexico (+80% YoY) and robust reception of the iPhone 17 series.

    Source: Omdia

    NB: Apart from Nubia(?) with 1% share, Apple was the fastest growing vendor in a flat market. Note the price points…

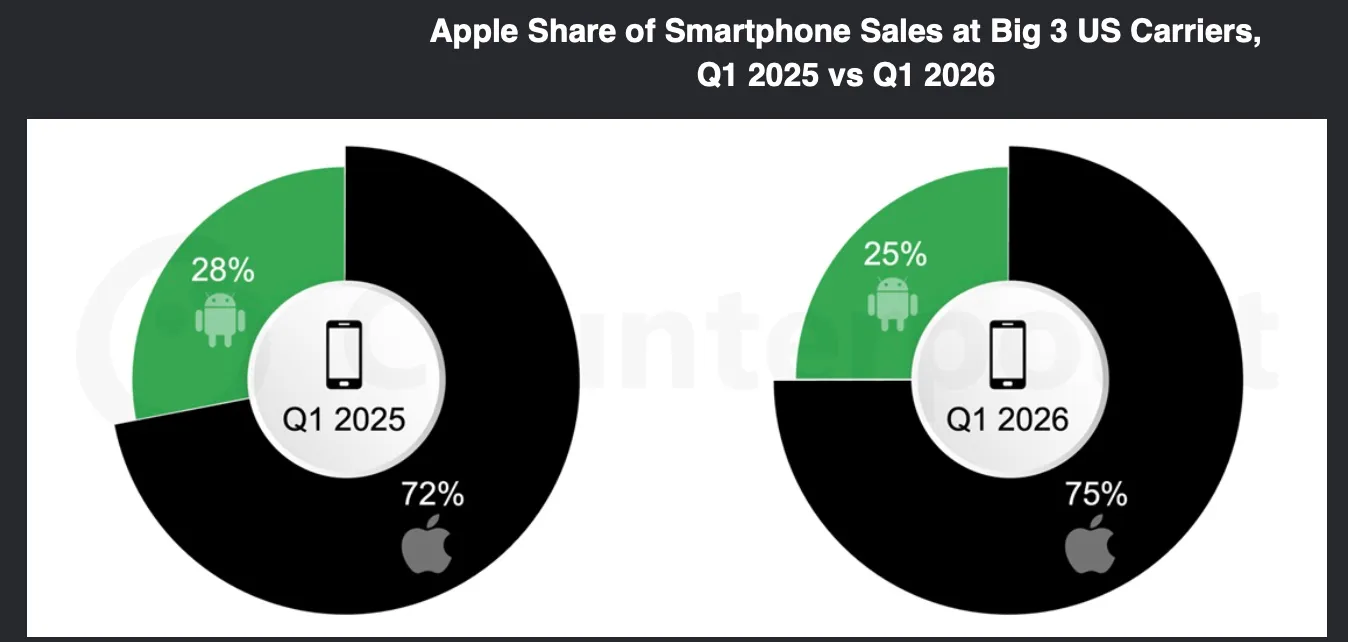
  11. iPhone Share of US Big 3 Carriers reaches 75%, 77% with Verizon

    Nota Bene · 2 comments

    Android down 14.4%. Small players getting crushed.

    Apple’s quarter one (Q1) 2026 iPhone sales volume in the US was up 1.3% year-over-year (YoY), outperforming the country’s overall smartphone market.

    That market declined 5.7% YoY, according to Counterpoint’s US Monthly Smartphone Channel Share Tracker. Apple’s share of volume grew by 4% YoY, as Android device sales declined 14.4% YoY.

    On the impact of the delayed launch,Graham said, “The premium smartphone space in the US is highly consolidated compared to some other markets, with Apple, Google, Samsung and, to some extent, Motorola comprising the vast majority of sales here. When one brand delays a flagship launch, it opens a window of opportunity to fill that vacuum. Apple did just that.”

    Apple grew its market share in each of the Big 3 US carriers. Its share grew the most at Verizon to 77% in Q1 2026.

    “If Apple can avoid significant price increases and continue to outpace its peers in promotional dollars, it will be tough for Android manufacturers to keep up in the year ahead, said Klaehne.

    Source: Counterpoint Research

    NB: What are the dynamics of the US market? The split between Apple and the rest of the market seems to be starker than ever. It's ask if there is a K shaped market emerging…