Recording and transcript of the June 9, 2026 Asymco One Office Hours, recorded the day after Apple's WWDC 2026 keynote. Horace Dediu shares his impressions of the event and takes questions from Asymco One subscribers.
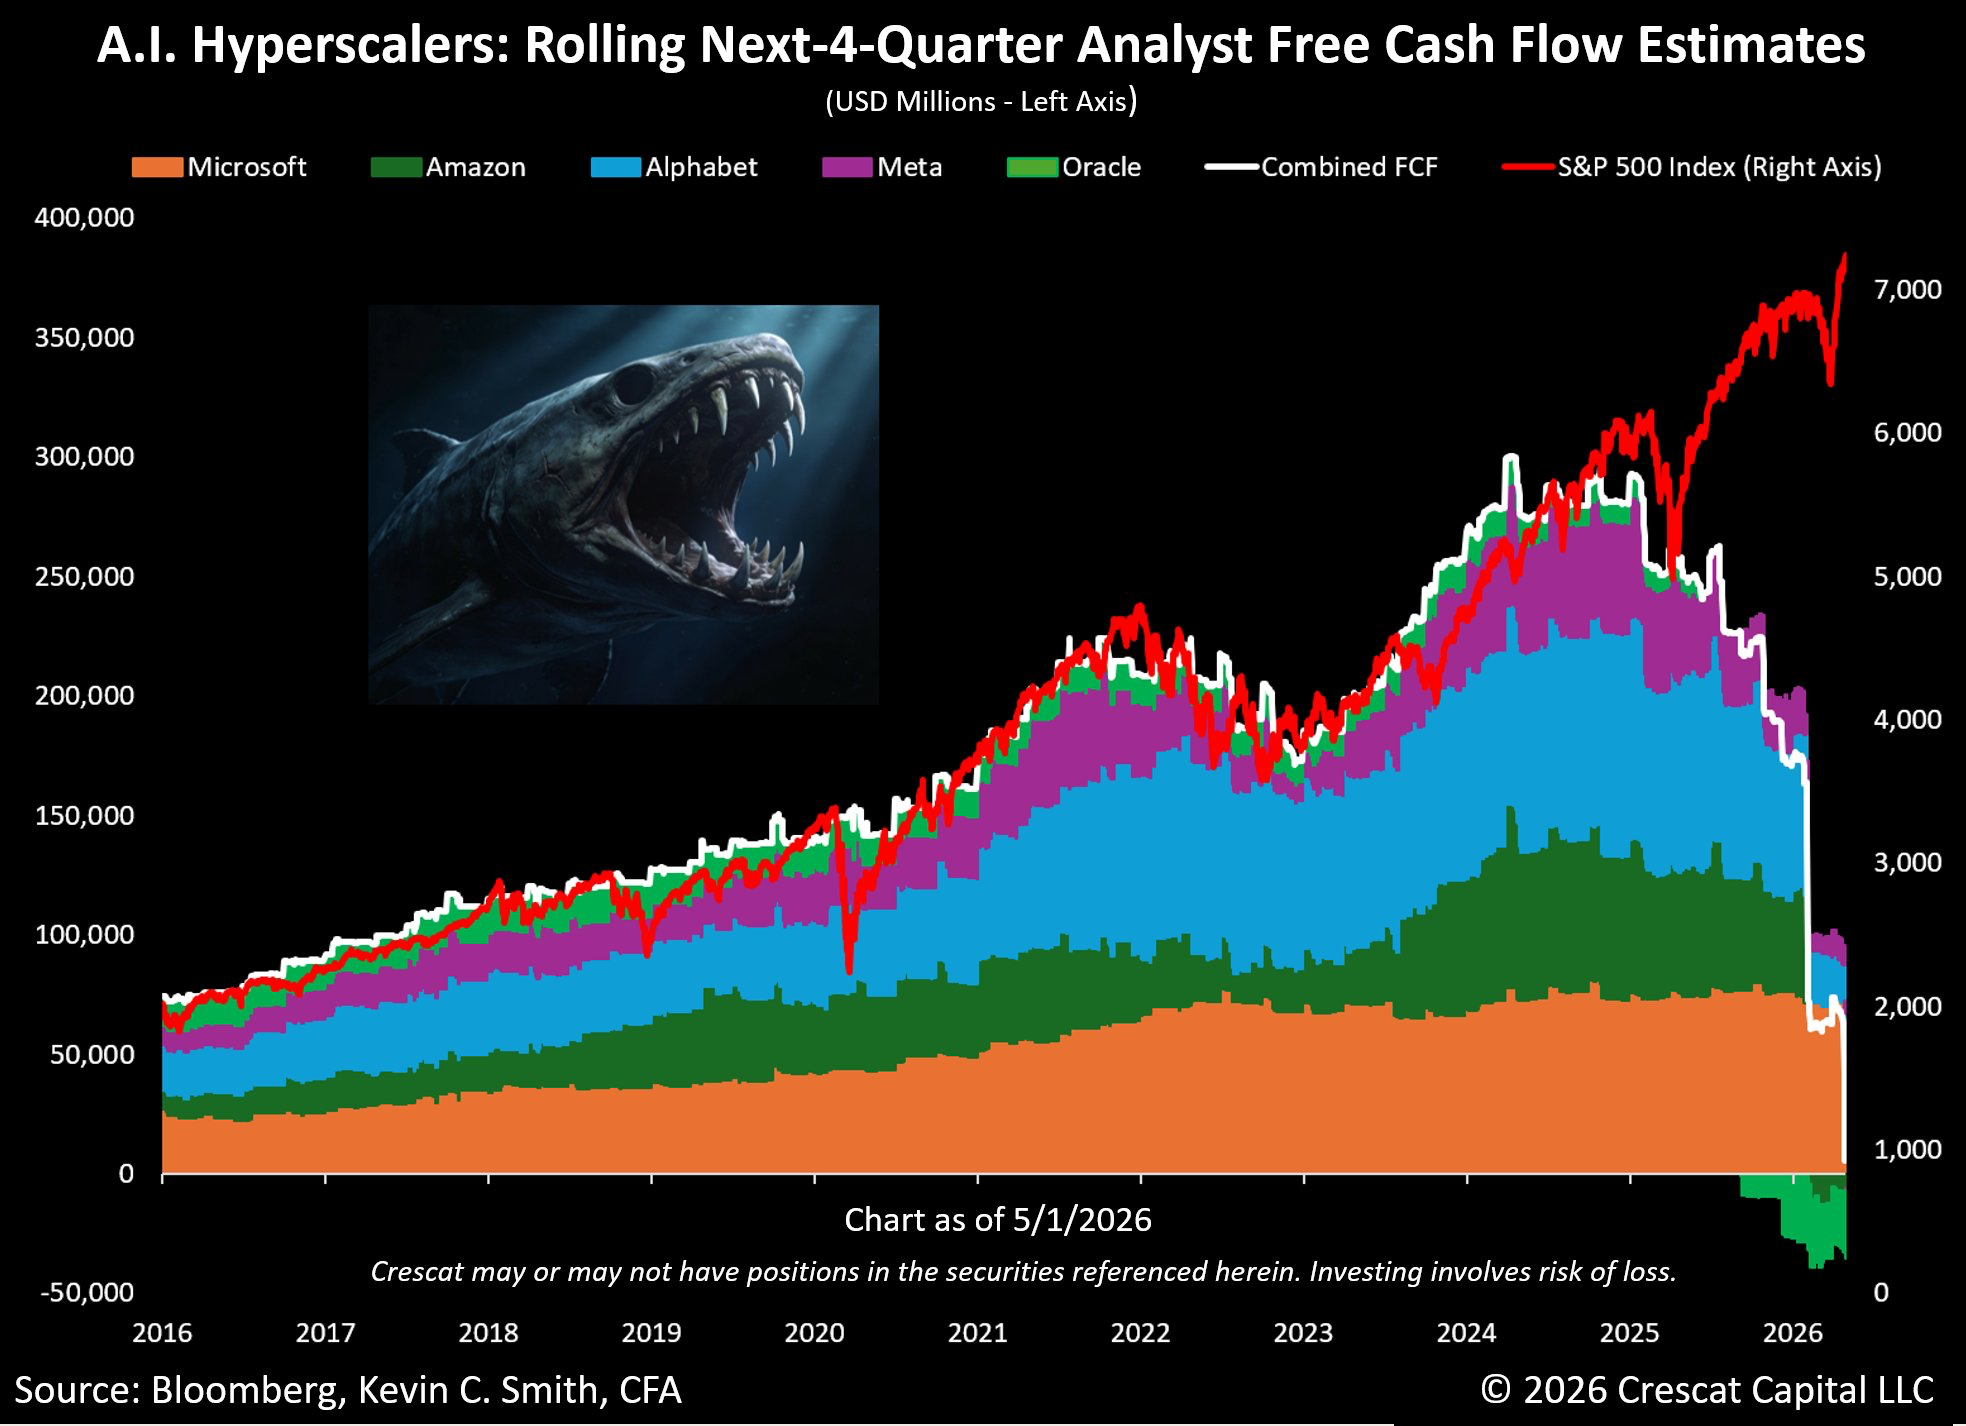
Alphabet generated $73.266 billion in free cash flow in FY2025, which sounds enormous until you look at what's coming. CEO Sundar Pichai has guided for 2026 capital expenditures in the range of $175 to $185 billion. For context, Alphabet's FY2025 operating cash flow was $164.713 billion. If capex hits the midpoint of that guidance range, it consumes essentially all operating cash the business generates.
The trajectory has been accelerating hard. In 2023, Alphabet spent $32.3 billion on capex. In 2024, that rose to $52.5 billion. In 2025, it hit $91.4 billion, a 74% year-over-year increase. The proposed jump to $175-185 billion in 2026 would be another near-doubling. Q4 2025 alone saw capex grow 95% year-over-year to $27.9 billion.
This dynamic is playing out across the peer group. Amazon already lived this story in 2025: FY2025 free cash flow collapsed 65.95% year-over-year to $11.194 billion as capex hit $131.8 billion. CEO Andy Jassy has guided for approximately $200 billion in capital expenditures across Amazon in 2026.
Meta and Microsoft are spending aggressively too. Meta's FY2025 free cash flow declined 19.39% year-over-year to $43.6 billion against 2026 capex guidance of $115 to $135 billion. Microsoft's Q2 FY2026 capex alone was $29.9 billion, up 89% year-over-year.
Patel's broader point is that tech insiders understand the technology better than financial markets, and that returns on AI infrastructure will ultimately justify the spend. The businesses backing these bets are not struggling — Alphabet posted Google Cloud revenue of $17.7 billion in Q4 2025, up 48% year-over-year, with a 31.6% operating margin at the Alphabet level. Full detail is in Alphabet's SEC filing.
Whether it's applied enough is exactly what Patel is questioning. If you believe AI infrastructure is a winner-take-most game and Alphabet and Amazon are positioned to win it, the FCF compression looks like the price of admission. If you think the returns won't materialize at the scale management expects, zero free cash flow at a $1.7 trillion market cap is a very different conversation.
NB: Even before these future investments are considered, for the trailing twelve months Alphabet's EV/FCF has his 73 vs. a P/E ratio of 29. If FCF goes to zero…
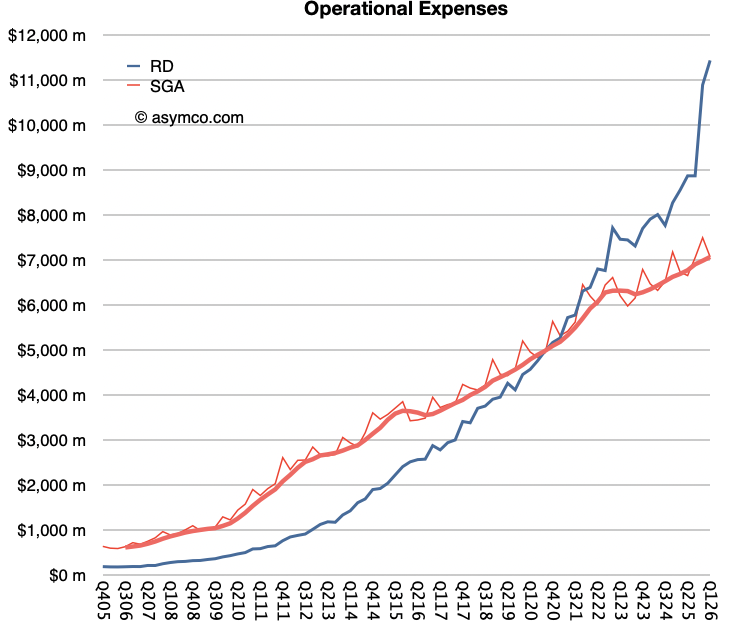
Apple’s R&D spending hit 10.3% of revenue in the March quarter, as the the tech giant ramps up investments in artificial intelligence.
The increase puts Apple closer to the rest of megacap tech on R&D, though the iPhone maker is still taking a very different approach when it comes to capital expenditures, according to CNBC. R&D spending was up from 7.6% in the prior period and 9% in the same quarter a year earlier. While sales jumped 17%, the fastest rate of growth for any quarter since 2021, R&D climbed twice as quickly, increasing almost 34% from a year prior, according to CNBC.
“That’s a sign that Apple is seeing a sense of urgency around new AI products,” said Gene Munster, managing partner at Deepwater Asset Management.”
Horace Dediu, founder of Asymco, agreed that a major question is where all that spending is going. Much of the increase, he said, is likely tied to talent, teams and experiments in training and modeling, rather than the kind of large-scale data center deployment underway at the hyperscalers. But he also said Apple is pushing across hardware, investing in silicon, optics, batteries, materials, sensors and smaller form factors.”
"AI is an obvious candidate, but R&D is not capex," Dediu said.
NB: Apple has been increasing its R&D spending from around 2% to 9% of sales on a 4-trailing quarter basis. It has overtaken SG&A which has remained around 7% since 2011.
Cash flow is a fact, earnings are an opinion and share price is a dream.
A company's total worth is the number of outstanding shares multiplied by their value. This product is called the market capitalization or Market Cap.
That's a simplification. If you want to be more accurate, you should take the Market Cap and net out cash and debt--these are not part of the future flows of cash that can benefit shareholders.
More precisely, there is another measure called the Enterprise Value (EV) which is the total price tag of a company, representing what it would cost to buy the entire business and pay off its debts. EV = Market Cap + Total Debt + Preferred Stock + Minority Interest - Cash and Cash Equivalents.
This is the precise and complete measure of the firm's value but we use the shortcut of Market Cap since In most cases the Preferred stock and minority interest are negligible and if cash equals debt then the result is EV =~ Market Cap. it's easier to calculate anyways as the shares outstanding and share price are easily available. Not so for EV.
To get a sense of how much you're paying for the company it makes sense to divide the Market Cap by the company's Earnings so you get an idea of how many years it will take to get back your investment. When dividing both Market Cap and Earnings by the number of shares it becomes the famous P/E ratio or Price per share / Earnings per share.
But if you want to be fully precise, instead of using Market Cap you should use Enterprise Value. In that case the denominator should be Free Cash Flow or FCF[1]. The ratio becomes EV/FCF. Free Cash Flow is a better measure than earnings because it takes into consideration depreciation, change in working capital and capital expenditures. It measures the actual cash a company generates after paying for its operating and capital expenditures.
EV/FCF takes into consideration unusual situations such as huge amounts of cash or debt or capital expenditures which removes shareholder access to what the company "earns" on paper. This why the adage of "earnings are an opinion but cash flow is a fact" exists.
I used EV/FCF years ago to value Apple because at a time when it held huge amounts of cash. This was before it began aggressively reducing its cash through its capital return program. The P/E ratio at the time was very low but excluding the cash, it was even lower. It was a huge red flag indicating that the company was being priced for liquidation, or as some analyst put it, priced like a steel mill going out of business. If at that time you did not believe that its demise was imminent you would have surely been richly rewarded.
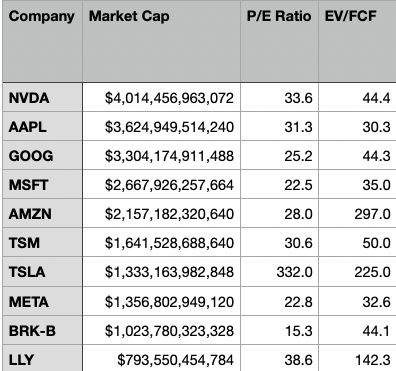
Today the anomaly that throws the P/E off is not Cash but CapEx. And it's not for Apple but for the other mega caps or AI "hyper scalers". Without worrying who is or isn't in the "Magnificent 7" I compiled the largest 10 market capitalization companies and looked at their P/E and EV/FCF ratios. At time of writing:
Company
Market Cap
P/E Ratio
EV/FCF
NVDA
$4,014,456,963,072
33.6
44.4
AAPL
$3,624,949,514,240
31.3
30.3
GOOG
$3,304,174,911,488
25.2
44.3
MSFT
$2,667,926,257,664
22.5
35.0
AMZN
$2,157,182,320,640
28.0
297.0
TSM
$1,641,528,688,640
30.6
50.0
TSLA
$1,333,163,982,848
332.0
225.0
META
$1,356,802,949,120
22.8
32.6
BRK-B
$1,023,780,323,328
15.3
44.1
LLY
$793,550,454,784
38.6
142.3
As recently as six months ago, there was a lot of talk about an AI bubble. Back then I looked at the data then and by looking at the P/E ratios convinced myself that the valuations were not "bubble" level. They were in the mid-thirties. These were not historical high especially when considering the growth these companies were experiencing (over 30%). Since then prices have come down significantly.
This is as the CapEx elephant in the room has been making itself known and there is renewed alarm at the scale of capital spending. This is reflected in the EV/FCF number but not in the P/E number.
The table above shows how much more elevated the EV/FCF ratio is relative to P/E for many of the companies. This "truer" measure of what you are paying as a share buyer is now reflecting in reduced share price and hence reduced P/E.
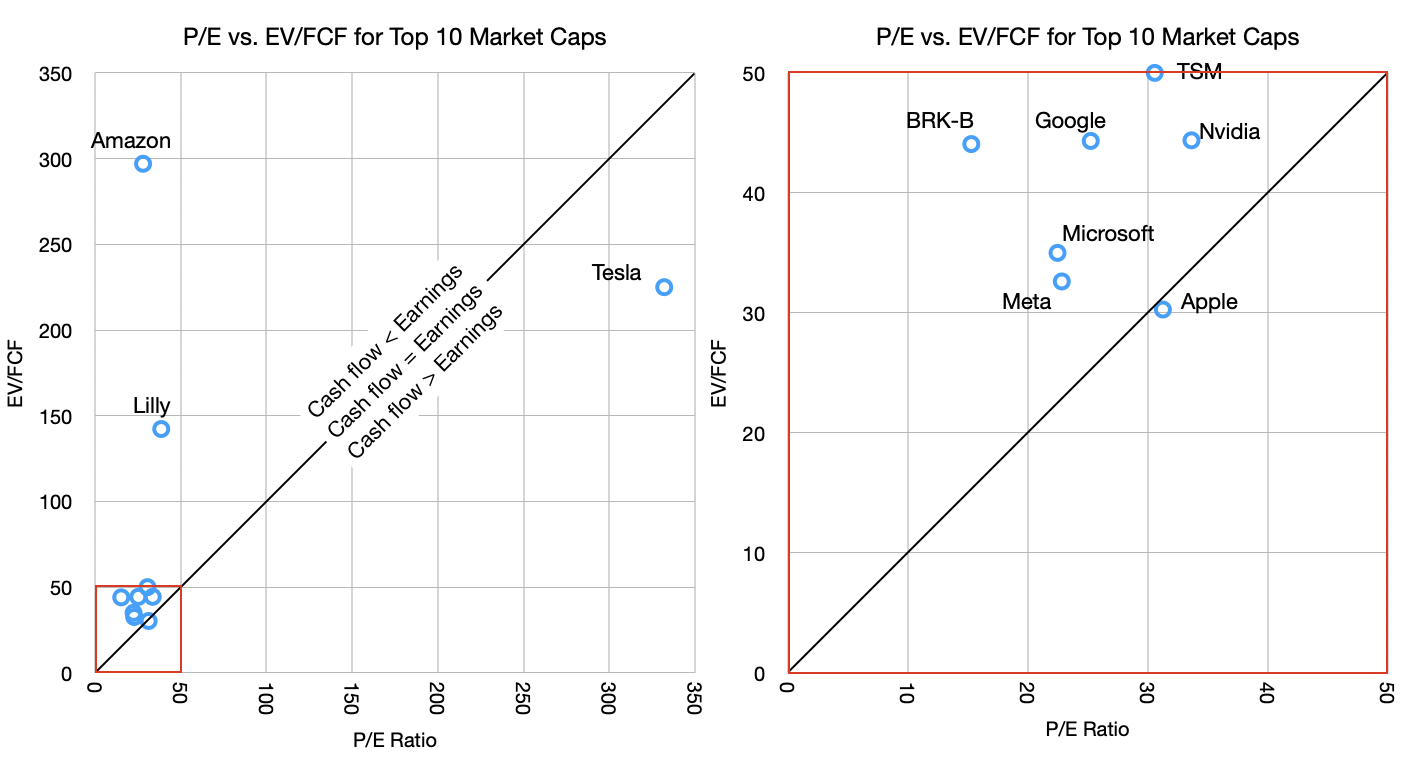
Of course, this is not true for Apple. Apple's P/E ratio and EV/FCF are nearly identical. To see this more clearly I put together these graphs.
The graph shows the P/E vs. EV/FCF for the companies in the table. The graphs are the same data but the one on the right is zoomed in on the lower left corner (note the red squares).
The reason for the zoom is that there are three outliers. Tesla, Amazon and Lilly. Tesla has absurd valuation on both P/E (300 to 400 range in last 6 months) and EV/FCF while Amazon has an outrageous EV/FCF value due to abnormal capital spending. Basically, Tesla has negligible earnings (and negative growth) while holding astronomical share price and Amazon is spending far above its median on CapEx. Amazon's 10-year EV/FCF is much lower, at approximately 55.
But let's ignore the outliers and concentrate on the other seven in the cluster. These are below 50 P/E and 50 EV/FCF thresholds.
Note that I drew a diagonal line representing the equation of P/E = EV/FCF. This should, under normal circumstances, hold for most stocks. Just like Market Cap should roughly equal Enterprise Value so Earnings should equal Free Cash Flow.
Most companies should not stray too far from this line. But what we are seeing, with the notable exception of Apple, is that most tech companies have cash flow far below earnings. This is again due to the CapEx elephant.
The argument goes that this is a temporary situation with that capital being wisely deployed for returns from AI. Presumably, these companies will swing to the other side of the line, where cash flows will exceed earnings, compensating for the capex that was denied to the shareholders.
This is where the old adage comes into play: Earnings are an opinion but cash flow is a fact. I added to that "and share price is a dream". Take the free cash flow and multiply it by a "dream" and you get the price the market sets. This dream is the multiple.
What makes the AI "bubble" interesting is how it's not fueled by debt[2] but by cash flow. Companies are turning over large portions (almost all and sometimes more) of their cash flows to investing in the dream of AI profits. All but one, of course.
There is something obviously contrarian in Apple's strategy. Perhaps it's not Apple that is odd but rather there is groupthink on behalf of the others. The question of who's right will rest on whether it turns out that AI is going to commoditize quickly or perhaps never, whether AI turns out to be modular or integrated, whether AI exhibits disruptive or sustaining competitive responses, whether it's an infrastructure subject to regulatory corrosion or whether it will migrate to the edge and iterate freely, whether it's a new experience or simply better existing experiences, whether it creates new markets or just makes existing ones more efficient.
These are not new questions. They have been applied to all software and hardware innovations of the last 40 years. We have a lot of history to inform us.
Ben Thompson of the Stratechery interviews Horace on the Stratechery Plus Podcast to discuss Horace's journey to become an influential tech analyst: early career in research, business school under Clayton Christensen, and his time at Nokia during the rise of the iPhone.
The conversation further explores Disruption Theory in the context of both smartphones and AI, why Christensen misjudged Apple, and whether AI could challenge today’s tech giants. It also marks the launch of Dediu’s new paid service Asymco One and reflects his continued conviction in Apple Inc. at its 50-year milestone.
“Given Apple’s free cash flow and we are about to embark on one of its most lucrative product rollouts since the big screen iPhones in 2014 - there is a case for Apple’s stock regaining some ground,” Melius analysts wrote in a note to clients.
Lately, Apple has announced the iPhone 17e and a refreshed iPad Air, a new MacBook Air, a MacBook Pro, new Studio Displays, the MacBook Neo, and an updated version of its over-the-ear headphones, the AirPods Max 2.
Apple shares were modestly higher in premarket trading but have lost some 8% year-to-date. Over the past 12 months, shares have gained 12%.
NB: Free cash flow (FCF) is the amount by which a business's operating cash flow exceeds its working capital needs and expenditures on fixed assets (known as capital expenditures). It is that portion of cash flow that can be extracted from a company and distributed to creditors and securities holders without causing issues in its operations. As such, it is an indicator of a company's financial flexibility and is of interest to holders of the company's equity, debt, preferred stock and convertible securities, as well as potential lenders and investors. It has come recently into vogue when the bill for AI infrastructures has come due...
The table above shows the P/E ratios vs. the EV/FCF ratios of the top 10 largest market caps in the world.
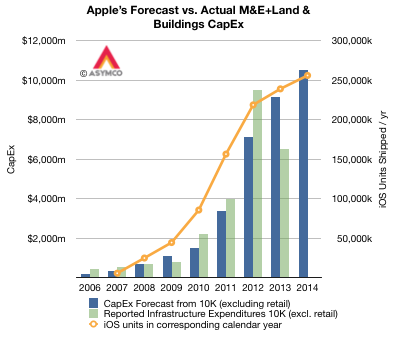
Based on the analysis of Capital Expenditures (as forecast by Apple in their annual 10K report) I concluded "iOS unit shipments should be between 250 million and 285 million."
The answer turned out to be 247 million. ((Including an iPod touch estimate of 9.5 million)) Including Apple TV the total would probably be around 251 million.
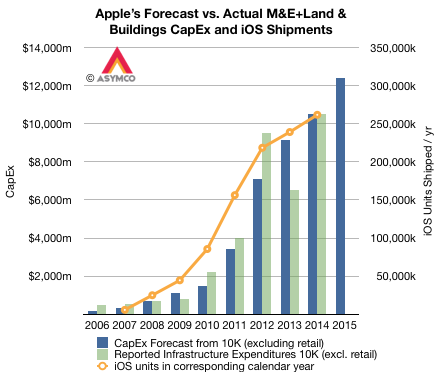
Since last year, I adjusted my model by observing corresponding iOS unit shipments for the calendar year corresponding to each fiscal year. Since the calendar year is offset by one quarter (FQ1 = CQ4) looking at calendar year means looking forward one quarter post-spending. I believe this is more accurate as spending generally happens in advance of production.
The resulting pattern is shown below:
The company is currently anticipating spending $12.4 billion on non-retail CapEx. The spending for last fiscal year was almost exactly what was anticipated in the previous 10K. If we calibrate production (with a 3 month shift) to the 2014 benchmark, then 2015 calendar year would see about 310 million iOS units.
The big question is whether this will include Apple Watches. To answer this we have to make many guesses:
Does the company have a deliberate production plan for Apple Watches? What is the lead time? How quickly can production be ramped given channel and demand?
Do Apple Watches require significant capital expenditures? Do Apple Watches require capital intensity similar to iPhones and iPads? How unique are the watch cases, straps and computing cores? What are the demands of the digital crown, the sapphire crystal, the display?
The capital budget of $10.5 billion in F2014 had to cover the ramping of the iPhone 6/6Plus as well as some of the new Macs, iPads and the Arizona sapphire plant ((Note that some of that would have been in 2013 and at about $0.5 billion, the plant was about 5% of CapEx)). It also had to cover some of the new campus ((The construction cost of $1billion/yr would amount to about 8% of the capital spending (non-retail) )). In previous years the capital budget also covered data center construction ((Including vast renewable energy infrastructure)) which may not be present in the future budget.
The non-retail capital budget is anticipated to increase by 18%. There are more moving pieces next year than usual, but directionally at least, CapEx remains a strong indicator of future iOS growth. Especially as it's given to us a full year in advance.
One of the paradoxes of the "post-industrial" era is the aversion to application of capital to growth opportunities. Generally speaking, capital has become trapped in bank accounts as opposed to equipment which could be used to produce value. This aversion is rooted in many dysfunctions, chief among them being the misunderstanding of the purpose of the firm.
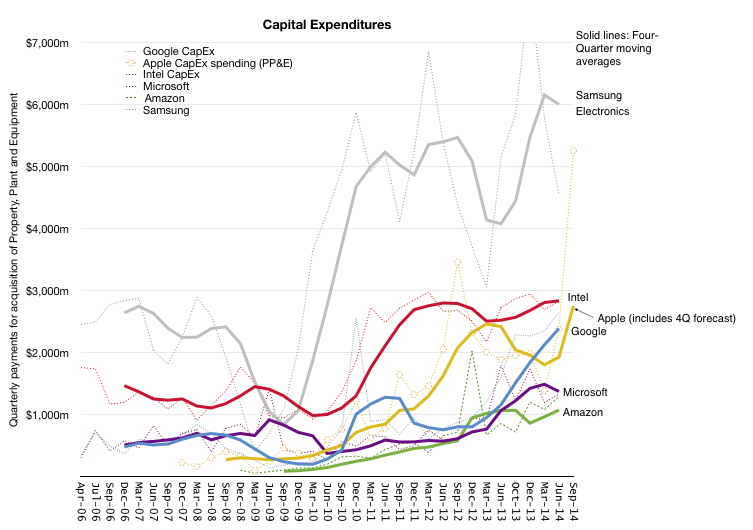
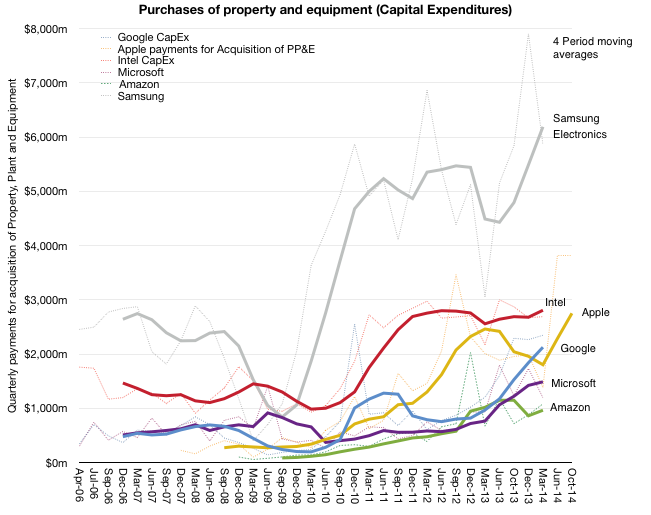
But there are exceptions. Illustrated below are the patterns of spending in property plant and equipment (capital expenditures) by companies that still recognize that there are opportunities to be obtained by investment in the means of production.
The highest spenders in this cohort are Samsung and Intel, both of whom spend mainly on semiconductor production equipment. Apple has been a big spender on production equipment and, to a lesser degree, on data center infrastructure. As the graph shows, Apple's spending has been nearly at the same level of Intel but with recent volatility, suggesting shifts in production processes ((I'm assuming that the 5S/5 required a surge in spending followed by a throttling back for the 5C with the iPad processes wild cards)).
Companies such as Microsoft and Amazon have been increasing their spending but since their assets are mostly data centers ((Amazon also accounts for its distribution warehouses and web site development costs as capex)) they have been considerably below the "manufacturing" investment level.
The interesting story emerging is Google. Its spending must include data centers primarily but the level is now reaching that of Intel and Apple. It actually spent more than Apple for the last four quarters. There might be a lot more need for infrastructure to support its users, but the revenues have not risen as rapidly as this line item
The question of what Google spends on is interesting. There are many projects which require capital including announced fiber networks but nearly $10 billion/yr. in capex is a staggering amount and I'm curious if its explainable as sustaining their current strategy or something emergent.
In October 2013, at the end of its last fiscal quarter, Apple stated:
The Company’s capital expenditures were $7.0 billion during 2013, consisting of $499 million for retail store facilities and $6.5 billion for other capital expenditures, including product tooling and manufacturing process equipment, and other corporate facilities and infrastructure. The Company’s actual cash payments for capital expenditures during 2013 were $8.2 billion.
The Company anticipates utilizing approximately $11.0 billion for capital expenditures during 2014, including approximately $550 million for retail store facilities and approximately $10.5 billion for other capital expenditures, including product tooling and manufacturing process equipment, and corporate facilities and infrastructure, including information systems hardware, software and enhancements.
These 10K (fiscal year annual) forecast figures for capital expenditures are shown in the following graph. Note that they also include the fiscal years from 2006 to 2012. Note also that the graph includes the actual expenditures (in green).
From 2006 through 2013 the sum of the forecasts was $23.445 billion while the sum of the expenditures were $24.662 billion. With the exception of a carry-forward in 2012, the forecasts are broadly in-line with expenditures, with about 5% more spent than forecast.
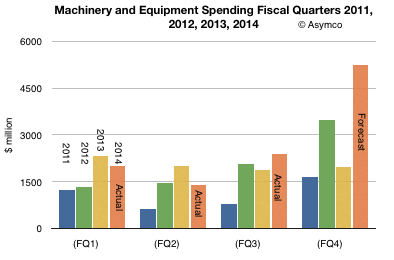
This pattern of accuracy in spending makes a $10.5 billion expenditure during the current fiscal year believable. In other words, taking the forecast at face value, and given that three quarters of the fiscal year have already passed, what does it imply for the current and last quarter? The following graph shows what Q3 spending should be relative to previous quarters (and 2011, 2012 and 2013).
The FQ4 (CQ3) "budget" for PP&E should therefore be $5.255 billion. This would be the most Apple has ever spent on PP&E in a single quarter.
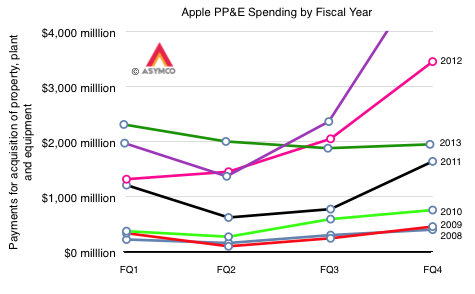
Shown another way, each fiscal year's spending from 2008 to present looks like this:
2014 is shaping up to be a bigger "ramp" in spending than any previous year. We have also noted how iOS device shipments correspond to these CapEx figure.
The relationship is shown in the first graph. I super-imposed iOS unit shipments for the calendar years because capital expenditures tend to result in production in the following quarter and Apple's fiscal year is shifted one quarter earlier than the calendar year. The iOS units shown for 2014 is based on shipments to date and a forecast of shipments for Q3 that is in-line with company guidance ((37.2 million iPhones, 14 million iPads, 1.9 million iPods touch which result in net sales of $40.18 billion and corresponds to the top of the guidance range of $37 to $40 billion)) and a modest forecast for Q4.
The metric of Capital Expenditures (excluding retail) is a good "rule-of-thumb" for predicting iOS growth, but it's not perfect. Obviously we've seen issues between forecasts and actual spending on a quarterly basis, but there is an overall relationship which makes sense: Apple spends on tooling and infrastructure in terms of data centers to support iOS growth. So far, a growth in CapEx has resulted in a growth in iOS.
It's therefore reasonable to assume that calendar 2014 will see at least 250 million iOS devices sold. How much that figure will vary will depend to some degree on the confluence and substance of product announcements this fall. ((My best guess is now 255.8 million.))
In The Capitalist's Dilemma, Clayton Christensen and Derek van Bever introduce a powerful new theory which explains the relative paucity of growth in developed economies. They draw a causal relationship between the mis-application of capital in pursuit of innovation and the failure to grow. ((and, indirectly, in the increase in inequality and hence the destabilization of socio-political institutions))
In particular, they observe that capital is allocated toward the type of innovations which increase efficiency or performance and not toward those which create markets (and hence long term growth and jobs.) This itself is caused by a prioritization and rewarding of performance ratios rather than cash flows and that itself is due to a perversion of the purpose of the firm. ((That being the creation of customers not shareholder returns))
For this statement of causality to be confirmed we need to observe whether it predicts measurable phenomena. For instance, we need to see whether companies which create markets apply capital toward market-creating innovations and whether companies which create value through efficiencies or performance improvements hoard abundant capital.
Over the entire global economy, the pattern of capital over-abundance is easy to see. The amount of cash or securities on balance sheets is extraordinary and unprecedented (estimated at $7 Trillion, doubling over a decade). However, growing cash is not a perfect indicator of inactivity. Cash is the by-product of earnings after investment. So if operating profits are growing and investment is growing, but not as fast, then it's possible to grow cash while still growing investment.
The better measure is investment in capital equipment or, more specifically, purchases of plant, property and equipment. ((Operating expenditures can also be measured but they cannot grow inorganically due to most of the costs being related to skilled employment which has supply constraints.)) Indeed, on a global scale, capital expenditure as a percent of sales is at a 22-year low.
CapEx is a good proxy for non-financial "investment". It's also a measure that can be easily obtained as companies report this activity in their Cash Flow Statements.
So the best method for assessing the theory's predictive power is to look at market creators and measure their investment in PP&E. At the same time we need to look at market sustainers and measure their (probable) lack of investment in PP&E.
So here is my first attempt:
It's an admittedly small sample of companies that are not that dissimilar. But within this group, over the time frame of about 9 years, we can see how capital expenditures are growing. ((Note that Apple's data extends to the end of their fiscal year and reflects their forecast given last October in the 10-K filing)) This sample shows that for a few companies, the amount spent on capital equipment grew dramatically. Especially since they are in businesses that might be thought of as not capital intensive.
Consider Amazon: an Internet company if there ever was one. Their purchasing of capital equipment (in which they also classify software) went from 373 million in 2009 to $3.8 billion in last four quarters! The average spending was $84 million in the four quarters ending September 2009 and $964 million in the year ending March 2014. Amazon is investing in data centers and distribution centers and they are growing that asset base with an eye toward future growth.
In contrast, consider Intel. Intel is in the most capital-intensive corner of the technology industry: semiconductors. They still manufacture their own so their investment in "fabs" continues. But Intel failed to create a market for mobile devices. The number of ARM processors shipped in 2013 was about 10 billion units while the number of Intel processors shipped was around 400 million.
So despite being an innovator, Intel did not create a market. They still increased their CapEx but only by a factor of 2. Is this because Intel did not invest in market-creating innovations? Had they invested in market-creation, would they be increasing CapEx accordingly?
Now look at Samsung. Samsung has grown CapEx by a similar factor to Intel (from pre-recession $2.5B/quarter to average of $5.5 during the last three years). Did Samsung create markets? Much of the expenditure went toward supplying components to itself and Apple (and others). In that regard, they did not create the market but filled it and optimized it.
Then there's Google. Google increased CapEx from an average of $476 million/quarter in 2006 to $2.125 billion in the last four quarters. That's an increase of 347%. Google spends almost all CapEx on data centers and we can see a pattern where CapEx growth anticipates service growth. However, the growth is not as pronounced as Amazon's.
Microsoft also grew CapEx. Their investment mirrors that of Google: data centers. Microsoft increased from an average of $508 million/quarter (very similar to Google) in 2006 to $1.5 billion today. That increase is about 200%, slower than Google but in the same trend. Did Microsoft create a market since 2006? In terms of cloud computing and software as a services, yes. Their spending growth reflects infrastructure that supports a new business model.
Finally there's Apple. In this time frame Apple did create the iPhone and iPad and their growth went from less than $200 million/quarter in CapEx to over $2.5 billion/quarter. The increase is nearly 10x over 25 quarters.
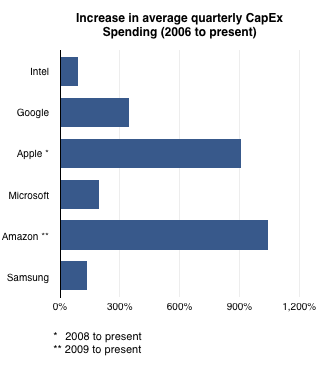
To summarize, the following graph shows the increase in average quarterly spending (over a four quarter period) between 2006 and the present for these companies.
The degree of "market creation" may be visible to the naked eye: Apple and Amazon did clearly create markets and they show highest CapEx growth while Intel and Samsung did not and they show the slowest CapEx growth. Google is continuing the expansion of a new market as is Microsoft and their CapEx growth is roughly proportional to these efforts.
At least from this small sample the theory seems to hold. CapEx and market creation are at least correlated. Much more analysis needs to be done, especially to discover the anomalies, but from the perspective of some of the most valuable and rapidly growing large companies, their commitment to capital expenditures is evident.