Asymco

Asymmetric Intelligence

installed base

  1. Office Hours — Apple Fiscal Second Quarter 2026 Review: The Presentation

    Office Hours · 2 comments

    A transcript of the May 1, 2026 Asymco One Office Hours, recorded one day after Apple's Fiscal Q2 2026 earnings call. Horace Dediu presents his analysis of the quarter and takes questions from Asymco One subscribers. Hosted by Horace Dediu and Farshad Nayeri.


    Horace Dediu: So I'll do a short presentation, and then we're going to open it up for questions. We are speaking approximately one day after Fiscal Second Quarter 2026 earnings call. Let's dig into it and see if we can understand it even better.

    First, I think that there was a comfortable beat from already a highly elevated expectation.

    So we had a range of estimates— I collected those from Yahoo and TipRanks, each one had about 30 [analysts], probably a lot of overlap between them. So we had a range of about 105 to 115 in terms of revenues in billion, and then we had EPS in a range of about 1.6 to about 2.15.

    And not only did it beat the consensus, but also you can see what happened a year earlier, which is the circle at the bottom of the graph. So the beat was from already a pretty high growth rate expected from the year before.

    So we have a measure of how each of us, myself included, performed relative to the actual results.
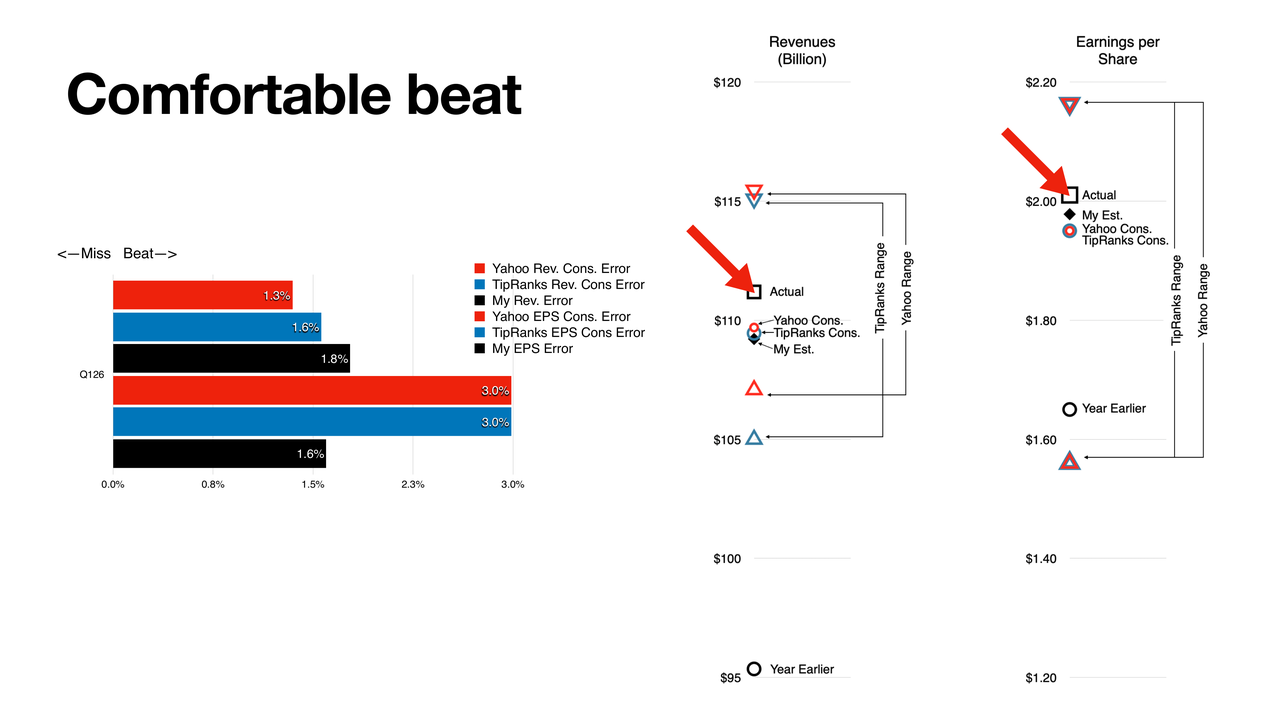
    I was about 1.8% under revenues delivered, and 1.6% on EPS. And then you can see red is Yahoo and blue is TipRanks.

    So speaking for myself, I was perhaps a little bit too conservative on my revenues, and I was a little bit more accurate, relatively speaking, on EPS. Roughly speaking, again, I think these are not big errors, 1% to 2%. Worst case, 3% on the consensus basis.

    Now, on the segments, these are the actual growth that we ended up with, iPhone almost 22%, 16% on services, 8% on the iPad, which is impressive. 5.7 on the Mac, we'll talk about that a little bit, and 5% on wearables and growth.
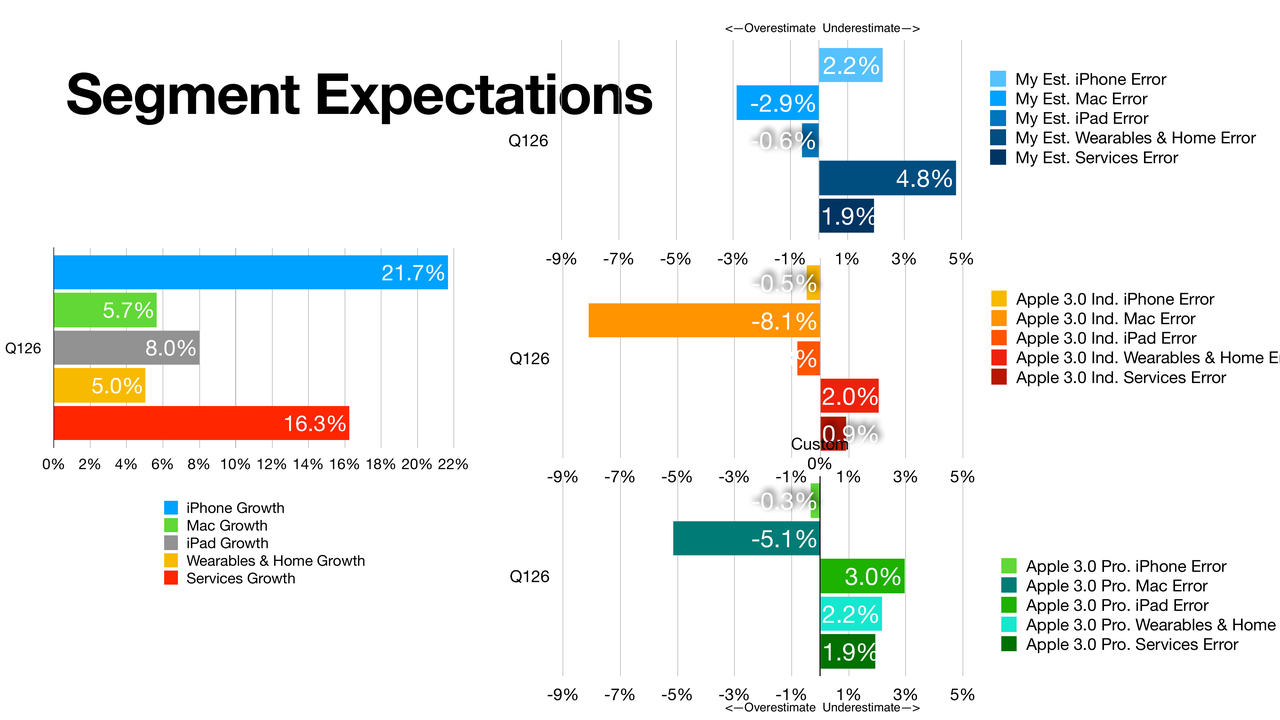
    Segment level, again, the worst case, you're looking at an 8% overestimation on the Mac. The Mac— I think a lot of people, once they saw the Neo come out, once they heard about the Mac mini stockouts, when they heard about the Claude bots, you know, everybody buying up all these Macs, there was an expectation of a big boom in the Mac, but those all happened fairly late in the quarter. My expectation was a little bit over, but not as much. I was off about 3% on that estimate. So although we saw 5.7% growth, some people expected double digits. Also, the pros had the same fault there.

    Overall, though, I think these are pretty impressive. I didn't break out the geographic segments. China grew extremely well. Rest of the world, that grew very well. Management also pointed out that they're doing very well in developing markets. So overall, regionally, there were some extraordinary performances. But as we see here, just the iPhone was incredible, 22%. Very similar to performance in the previous holiday quarter, where, again, unprecedented growth, or at least in the near history of the product.

    And we'll get into some reasoning why that is. People talk about super cycles, people talk about the assumption that we have these giant surges once in a while. Well, here's how to look at it.
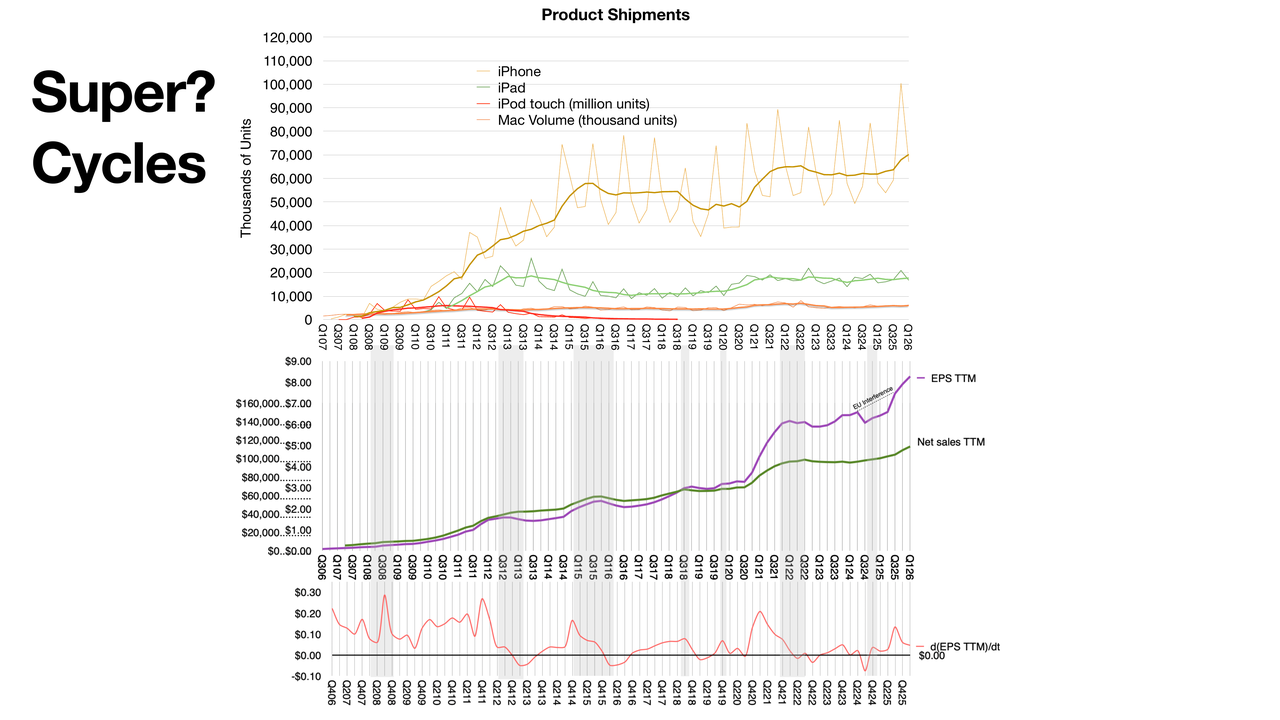
    There are two graphs here. The bottom graph shows in green the net sales, but trailing 12 months, so it's smoothed out, so we don't see the spikes on the holidays. That's the green line. Above that, we have the EPS line. Now you'll see how they tracked very similarly for a while, and then they began to diverge. That occurred around COVID. It also occurred during the surge in services, especially subscriptions and services. But still, there's a similar pulse, if you will, a cyclicality to it.

    I mean, part of that has to do with the introduction of a new form factor. This has been true all the way back since 2012. When a new iPhone comes, especially a new, distinctive-looking iPhone, people will go out, especially in China, buy it for showing off that they have the latest, which there's nothing wrong with that. But then the second year usually is not the same, the phone is not new, it's the same form factor. That has to do a lot with tooling. That's a long, old story, that the tooling is depreciated on a two-year schedule, so you're going to produce roughly the same look a couple of years in a row, and then by the next cycle, you'll see people upgrading or replacing their older phones. So you're going to have this— I guess what they used to call a super cycle.

    And you see it also in the upper graph, where I try to separate out of sales just the phones. Now this is an estimate because we have no unit sales for the phones since 2018, so some of that is an estimate. But you'll see again, once you smooth out the cyclicality, you'll see these surges once in a while. Now, again, this is a valid observation, but I don't think it's the main driver. The oscillation isn't huge, it might be significant, but it's a blend of many things.

    The bottom graph is particularly interesting. The gray areas are when the stock price fell. And the red line represents the derivative of EPS. And you'll see how, when that is about to dip, there's usually a stock price sale going on. I wouldn't say it's predictive, but it's an interesting pattern to go through.

    So what's happening now? You'll see from the iPhone, there's a new surge happening. Now, when Tim has been asked this question, he says that, well, the iPhone 17's really nice, people really love it, and that's a good answer, but the fact is, it's a distinctive-looking product. Some say it's the orange color, but it's certainly attractive. So we're seeing this pattern, a nice surge.

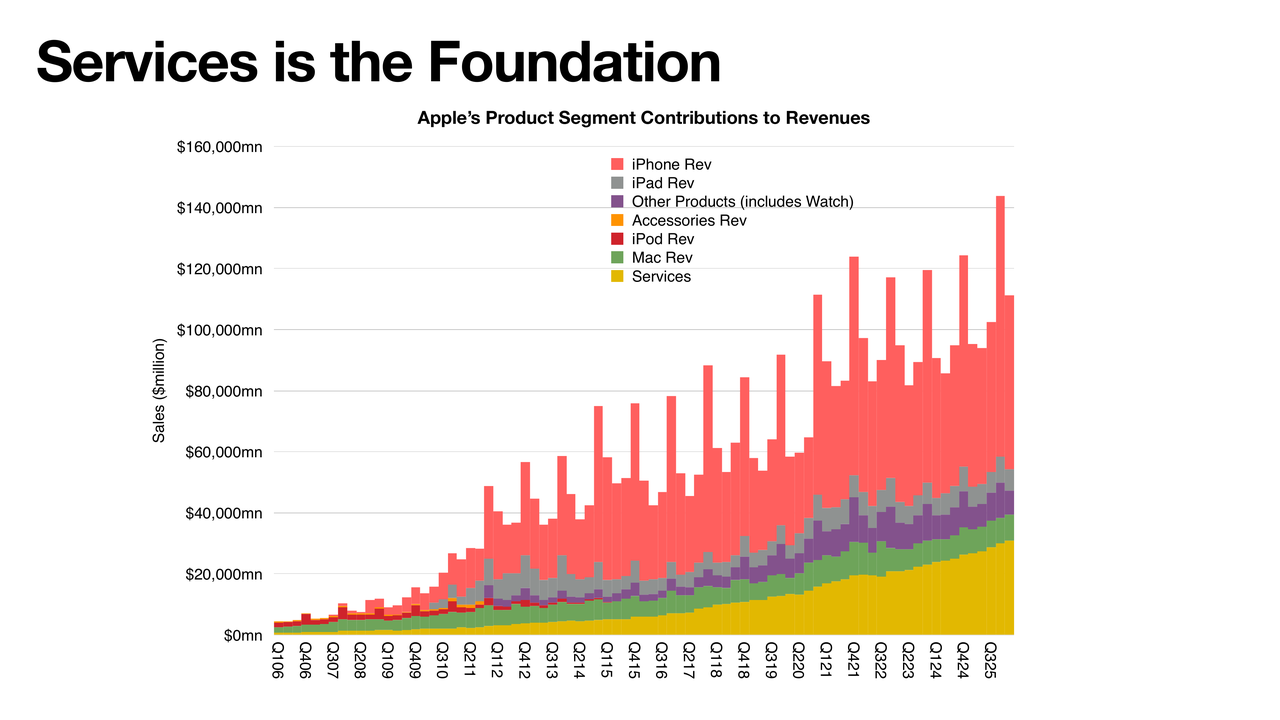
    We'll get into the guidance in a minute, and that actually demonstrates that we're in some kind of an acceleration. But here's the thing, underneath all that, services is just absolutely steady growth, compound growth, and as a result, it just lifts the whole story.
    What Are the Mobility Design Surfaces?

    Here, services is at the bottom. Normally, in a graph like this, you want to put the oldest products at the bottom and the newer ones at the top, but I wanted to highlight the fact that services is foundational, in the sense of showing how it holds up everything else.

    Most people put it the other way, they say the iPhone holds everything up, but services is looking more and more to be the thing that keeps people in the ecosystem. There's a lot of value there. There's a lot of things people depend on there, and I think it's one of the reasons people don't switch. So it's another one of these stories that people aren't appreciating enough. It's been years and years of pounding the table on services, but here you see it, just how important it is. It's the tide that lifts all the boats, and the boats being all the products.

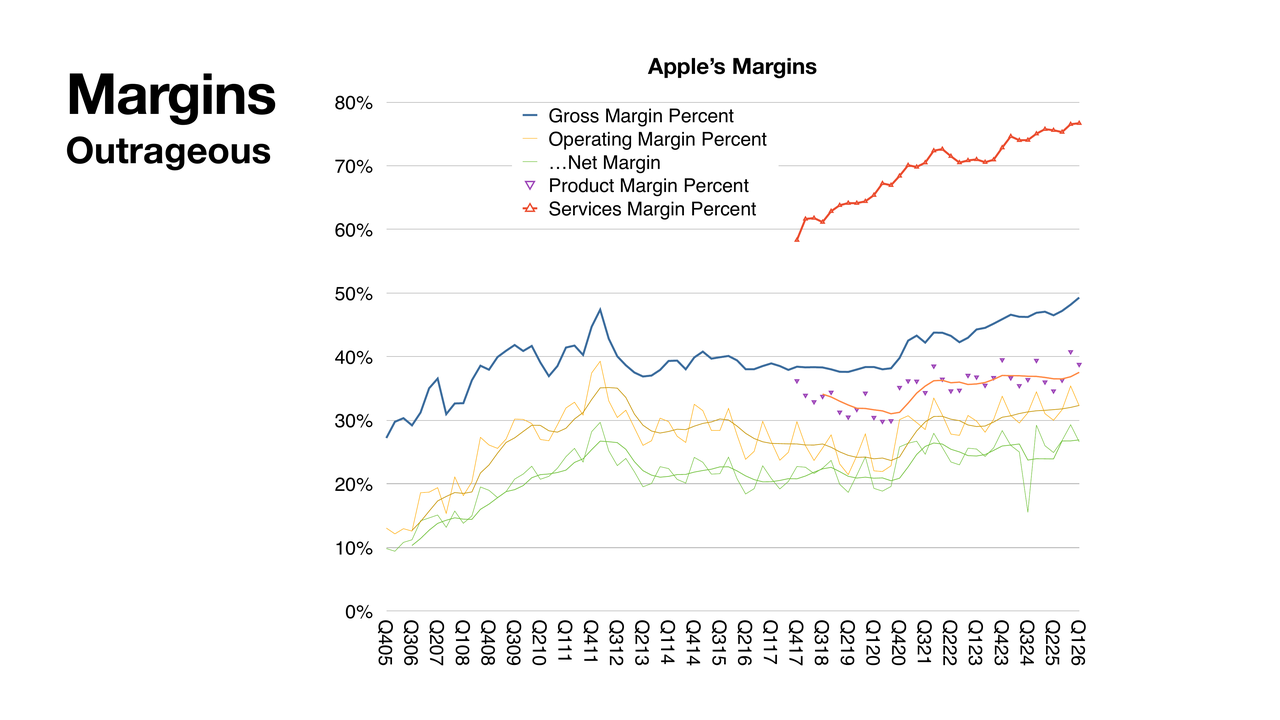
    So let's now talk a little bit about margins. Unbelievable, unbelievable margins. We just hit almost 50% on gross margins. Gross margin here is the blue line. And that's composed of two subcategories. We have services in red at the top, and we have products with the purple triangles.
    The great memory panic of 2026

    And although products margins are exceptional— they're right around 40%— those services, again, are pulling the whole average up, and you can see that bend in the curve in the blue line, where we were very steady around 40%, but as services took more and more; it just pulled the whole curve up.

    And we also see here operating and net margins, which also are going up, naturally. There is a little bit more operating expense. We'll get into that, which maybe decreases the slope of the bottom line. But this gross margin is absolutely incredible. We just haven't seen anything like this since 2010-11. We saw that surge back then, and then it sort of leveled out, and everybody was happy with 40%, and now we're flirting with 50. I just cannot believe it.

    Just one more thing. I remember being an analyst decades ago, when I was looking at different companies in hardware and software, in phones and computers and so on, and everybody was really impressed by Microsoft, because Microsoft, had an 80% gross margin, because there was very little cost of sales. That's exceptional. An 80% margin business is a money printing machine. And everybody was impressed and jealous of Microsoft that they could pull that off. Of course, Microsoft, a software company, is going to have extraordinary margins, right?

    And so for a phonemaker like Nokia, there was something to be jealous of. And here we are with Apple services, a significant component on the business, approaching also almost 80% right now. And it's still rising. I just can't get over how impressive this is.

    R&D Acceleration

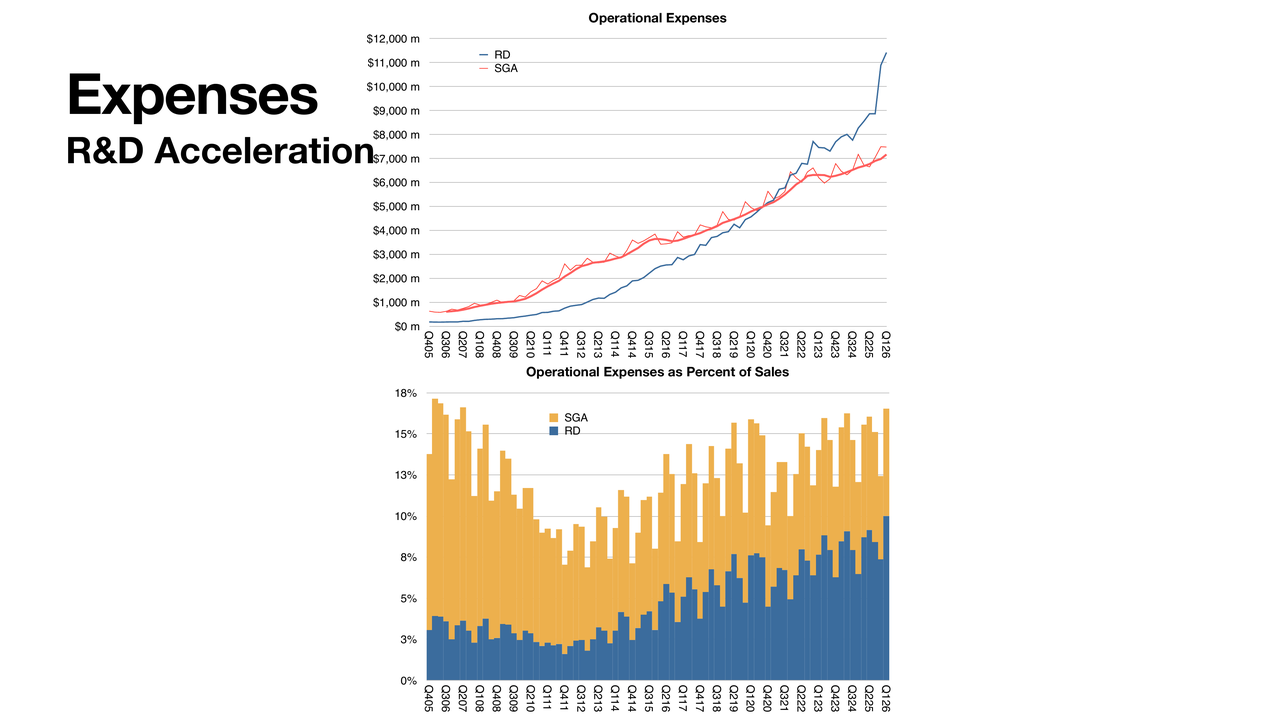
    A little bit about the difference between gross and net— you have to take out the operational expenses, and this is what we have here. It's interesting what's happened. Obviously, you see R&D overtaking on the absolute basis. So R&D overtook SG&A already in 2021. And now it's just [going] almost vertical.
    Why won’t Apple become a cloud company?

    By reading a little bit the guidance, I think it's going to taper a bit into the next quarter. But what we see is a significant R&D increase, also as a percent of sales, which you're seeing below in the graph below, but in a stacked fashion. In that sense, the two of them together are now approaching— haven't yet reached— a percentage of sales that was in evidence around 2007 and 8, when the iPhone was just emerging. But you'll see back then, R&D was tiny, SG&A was huge as a percent of sales. So much so that R&D—this is during Steve Jobs era, R&D was like 2% of sales. And now it's approaching 8%, which is extraordinary. Because that's an engineering company that's doing breakthrough work.

    And that's something that Apple's not recognized for doing. There's a negative side of spending a lot on R&D. The positive, though, is that Apple is doing a lot of fundamental research now. This isn't fixing products, this isn't updating OS. This is engineering that is really driving what might be considered breakthrough. And that's something— and I've said this to the media when interviewed about Ternus and the succession— I said, the new CEO will need to be— this is before he was announced— I said [the CEO] would need to be someone who is acceptable to engineering, because Apple is an engineering company today. Fundamentally, culturally, operationally, it's an engineering company, and it is being now led by an engineer.

    Steve Jobs was not an engineer. And none of the other CEOs were engineers. Tim Cook was an operations manager. He was excellent in a fundamental part of the business. And that is acceptable to engineers, culturally speaking. But the thing is that John is an engineer's engineer. He understands the culture of engineering and will understand how to motivate and retain talent, as well as to allocate capital effectively, not wasting it on pipe dreams. Engineers have a tendency to try to chase dreams, by the way, so you got to be harsh sometimes to shut things down. So, keep an eye on the R&D— it's a great story.

    However overdoing it can be a problem. There are downsides to an engineering-led company where, again, it turns into kind of an engineering welfare state. Engineers tend to get projects and do a lot of navel-gazing, which needs to be managed carefully.

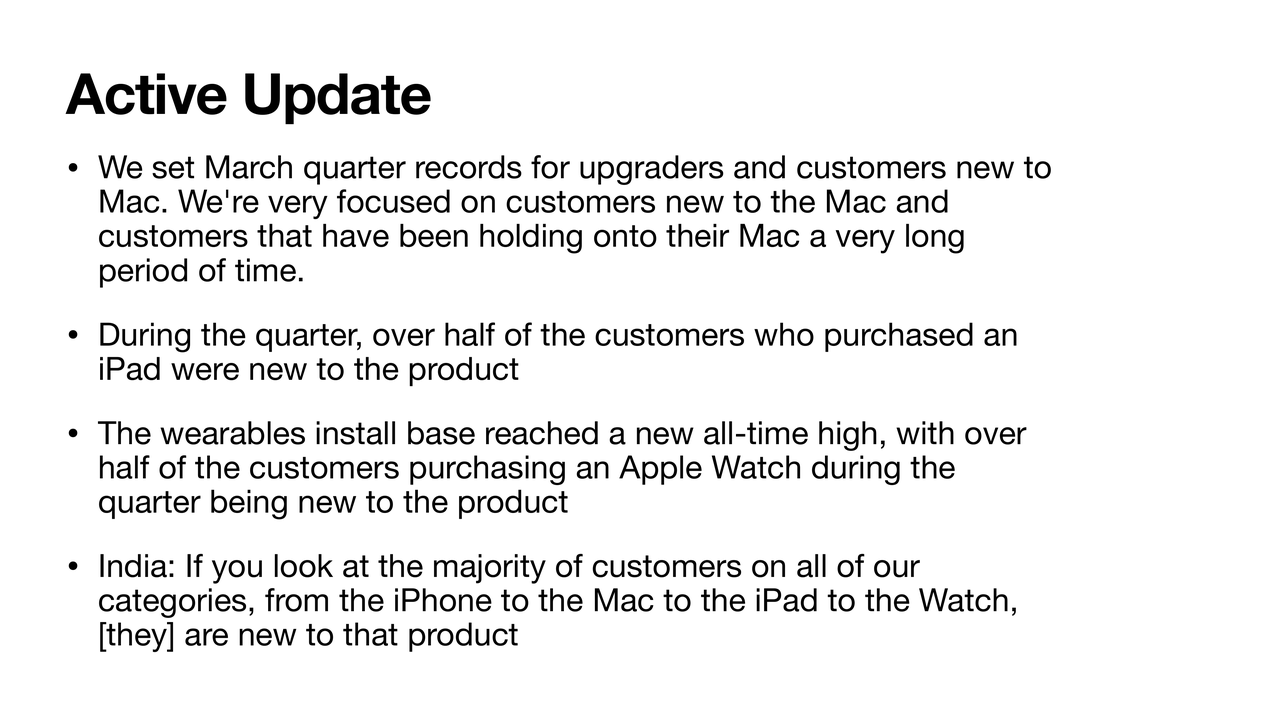
    Now, let's just touch on ACTIVE. Active is the number of users, the fundamental measure of the value of the company. It's not counting iPhones. It's counting users, and these are the comments from management, just so we capture them. They come every quarter. Sometimes some products are mentioned, sometimes they're not.
    Margins or revenue: which matters more?

    So here's what we have exactly on the topic. Record upgraders and customers new to the Mac. They mentioned that Mac lifespans have been long, which is good and bad. They talk about the iPad, half the customers being— over half— new to the product. Same with the Apple Watch, this has been going on for a while.

    So this is going to be important when we measure installed base, because if we see every quarter an estimate for the number of watches, or Macs, or iPads, you just take half of that and allocate it to the installed base, and the other half is growth of the installed base. So there's an interesting way to measure that, and I've been applying it. We're going to keep an eye on this.

    And finally, there was a mention with respect to India during an answer to the question. The citation is that the iPhone, Mac, iPad, watch, all of these have a majority of customers that are new to the product in India. As you would expect, part of the developing market story. But this drum is still getting beaten. And that's a positive. Always want to look forward to that every quarter.

    So let's jump in now to what I thought was the most unexpected comment during the call. I've pasted in here exact, verbatim the comments from the CFO. I need to point out a few things here, and I've highlighted these things in bold.
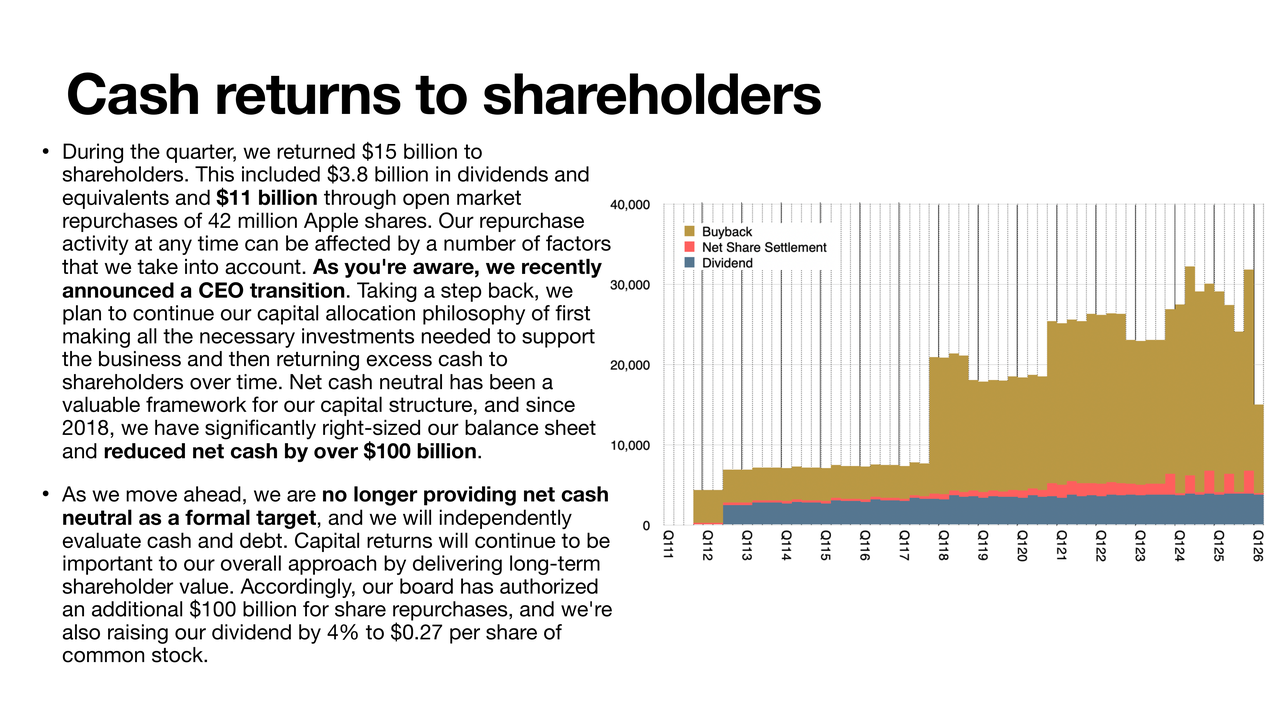
    One is the dividend. The dividend number is 3.8. Last quarter was 3.9, so that's not a surprise. However, open market purchases were only $11 billion. Now, that is represented in the graph by the buyback, and that is this mustard color. And you'll notice it is extremely low. The previous quarter, we were over 25 on buyback, so we're less than half that. This is an anomaly. You'll see that it does not match the rest of the graph at all.

    The blue area is dividends. The reddish area is net share repurchases, or settlements. And there's a pattern to both. Dividends has been growing in a predictable fashion, very steady. Buybacks have been somewhat steady, but up and down a little bit. During the last few periods, we've seen something unprecedented.

    Now, you'll see that the 11 from last quarter was offset by a much higher number the previous quarter, but on balance, we're still down. And there's also these comments that say that they are abandoning the net cash neutral position. And I'm wondering if it's already started, because this $11 billion caught me by surprise.

    I've highlighted that "our repurchase activity at any time can be affected by a number of factors that we take into account." So this was essentially explaining why sometimes there's a difference in the amount of purchases, right? And then in the middle of that commentary, he says, "as you're aware, we recently announced a CEO transition." Why does that comment fit in the middle of a paragraph, talking about the general theme?

    I read this as it suggests that already the CEO choice is deciding how much to allocate to capital returns. And it appears— and again, I could be wrong— but it appears that John is probably against the idea of huge returns to shareholders in capital form. So keep an eye on this. This was, I found, very, very strange and out of character in a way. Very out of character of a Tim Cook presentation. I'm not judging it, I'm just pointing out that it isn't normal.

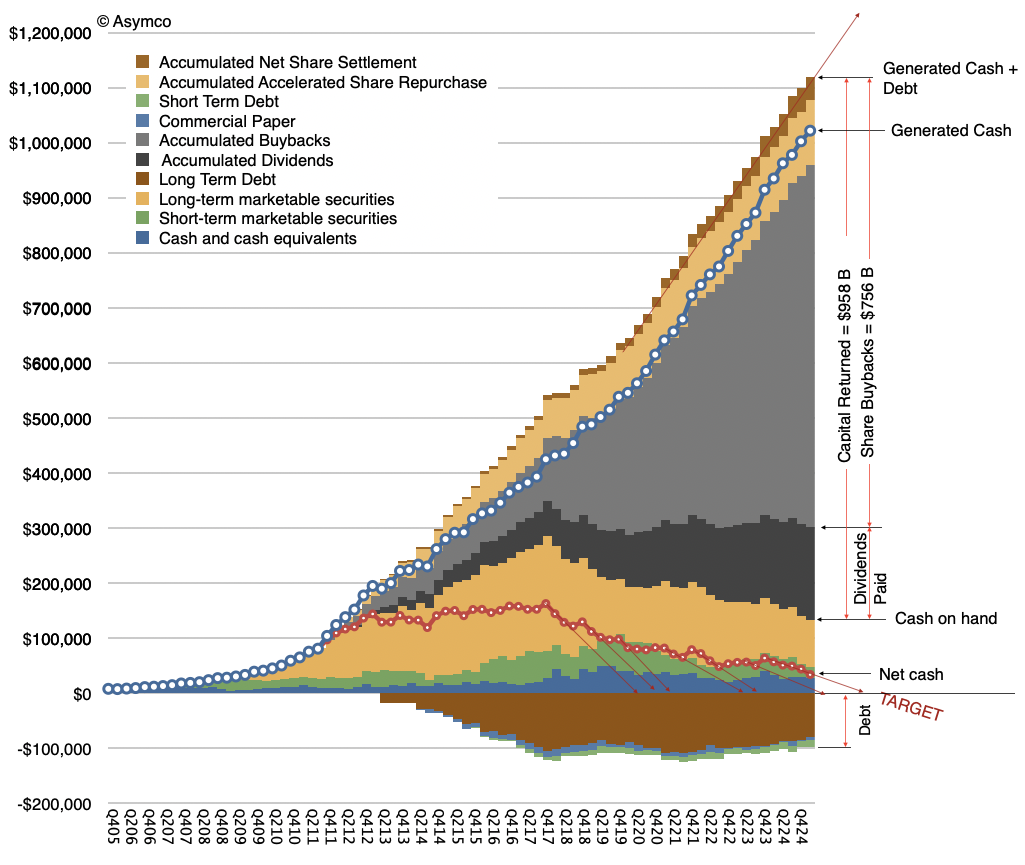
    So here's the bottom line. This is the graph representing what's happening with the entire cash position and return of capital. The debt has decreased slightly, and it has been decreasing. And that's a good thing. As interest rates go up, you don't want to hold debt. A lot of that is fixed rate, but they're not taking on more. It seems like they're paying it down.
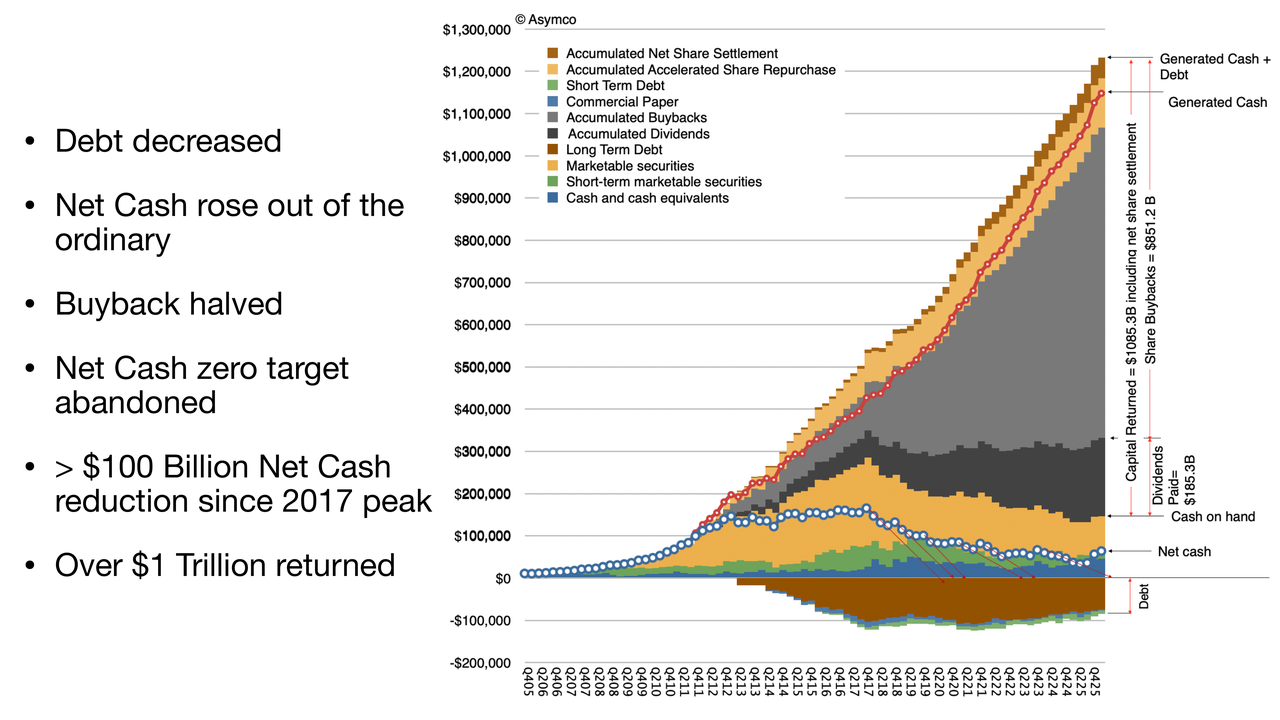
    Net cash, which is the blue dotted line, has now been increasing two quarters in a row. Now, it's increased in the past, but never for long. It's had only one tick, during the holiday period. Here, where we're seeing two ticks— holiday and the quarter after.

    Now, if you'll notice here, I'm going to try to zoom in. Those red lines represent what I would say were the trajectories to get to net cash zero. So that blue line, since they announced it, they kept missing the target. You would see that, another year goes by, and there's a notch up. Overall, the trend is down, but they haven't kept that path down all the way to zero. And that is now completely abandoned.

    Again, we'll have to figure out why. The buyback, as I mentioned, halved— at least more than halved— to 11. Net cash zero abandoned, $100 billion net cash reduction. You'll see that this blue dot line has gone down by about half. It was down even further than that until it came back a bit. So that is going from about $160 billion net cash to the current $62 billion, which is why we get to 100 reduction. And $1 trillion overall return, which is, again, something they mentioned. In fact, they're at $1.085 trillion. And still $100 billion will be allocated further. Whether they actually spend it is another matter, but that's been approved.

    So now— is this good news or bad news? I don't think it matters. I think at the end of the day, the value of the company doesn't change because of this. The value might be captured in the share price, or it might be captured as a percentage of the company that has been increasing.

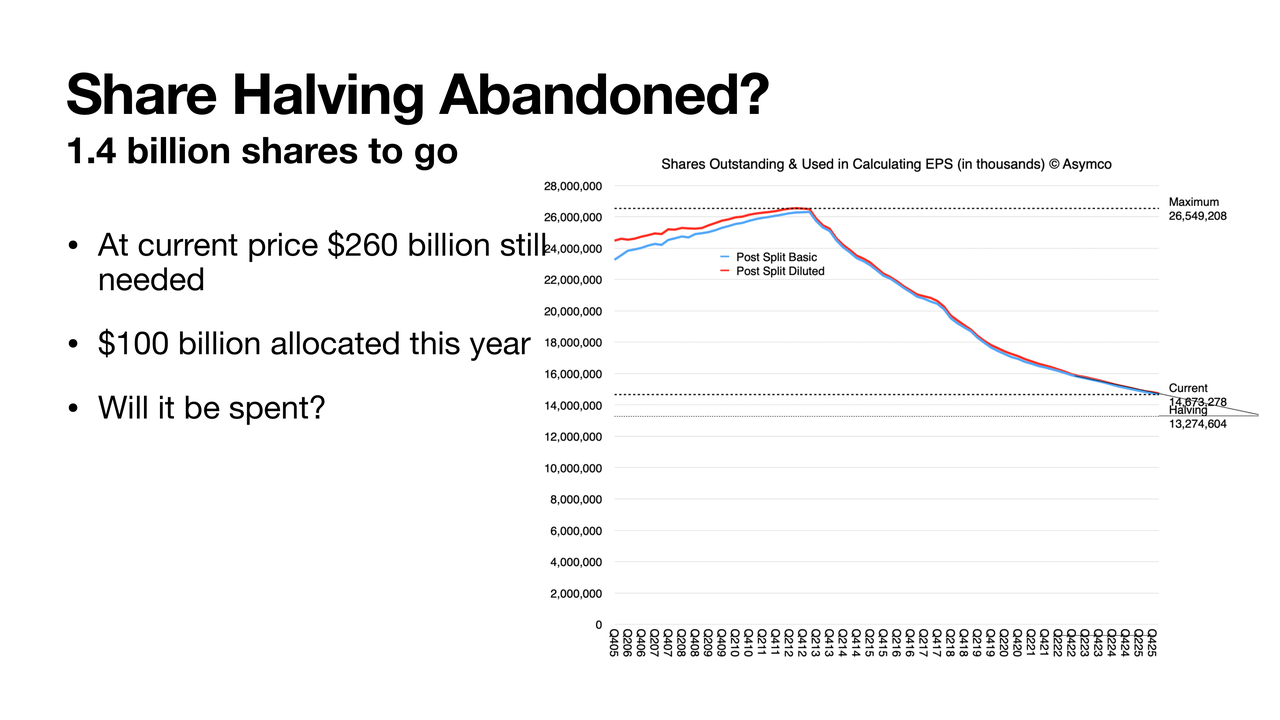
    In fact, let me just pop into the next slide. What does this mean? Are we never going to reach what I call the halving? Well, we were at the maximum 26.5 billion shares. And now we've reduced that to about 14.6. Half would be 13.2. So we're still going down. But there's 1.4 billion shares to go before it's half of what the max was. Now, this is an arbitrary figure. I just thought it was an interesting target to have. And as you can see, it's getting asymptotic as the price goes up. It should be harder and harder to get there. But we have $100 billion allocated. $260 billion at the current share price would need to be spent to get to half. But probably we're not going to get there. I really don't— if I were a betting man, I would say we're probably going to see this taper.
    Let's look a little bit at guidance. This is based on what management already communicated. So if you put in the numbers they gave us, you will get revenue growth of 16%, coming at about— well, they guided 14 to 17, so I'm estimating 16 conservatively right now. That gets you to $108.7 billion. If you put in the other numbers— the margin, the OI&E and the tax— and do something about this share reduction. (We're still going to probably see a share reduction.) We're going to look at EPS 1.92. Which is another 22% growth. This is what we had last quarter as well.
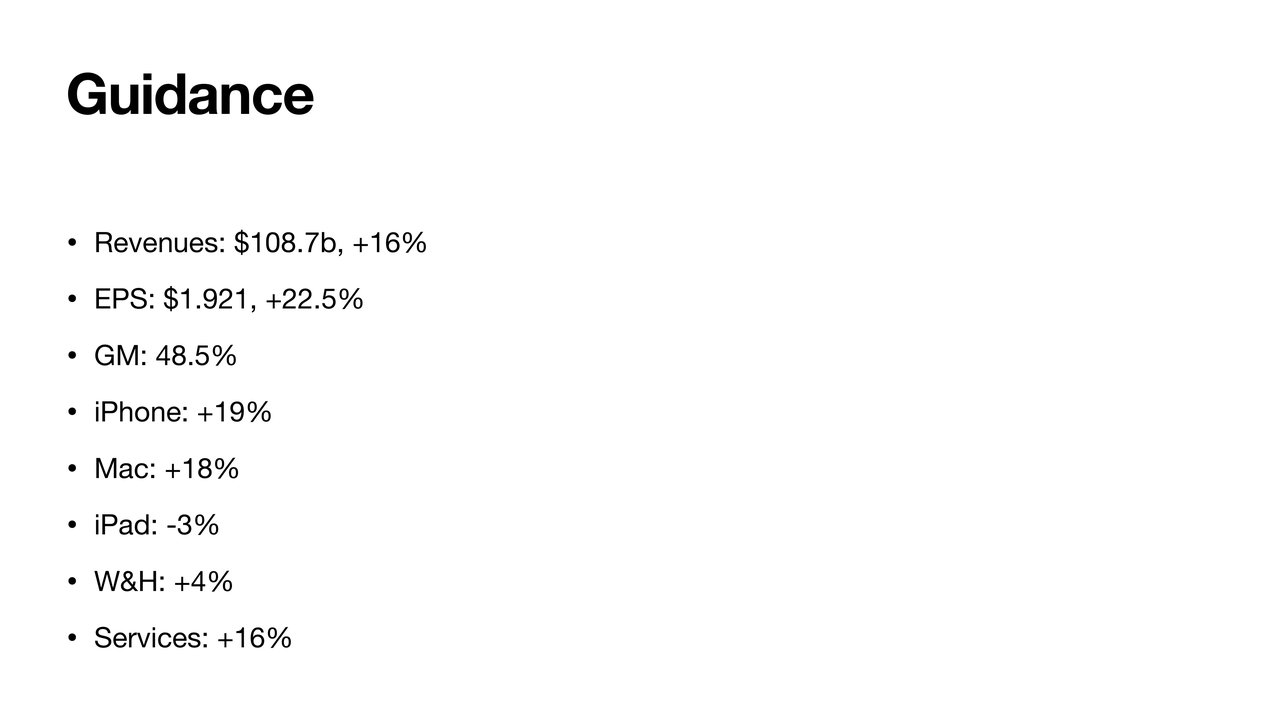
    I'm putting gross margin at the top of the guidance. [Last quarter] they went over. They guided high, and even so they went over, so I'm going to assume they're going to still hit towards the upper end of the range. I'm exactly at the upper end of that range.

    If those things are true, the iPhone almost necessarily has to grow about 19%. Now, here, I'm dialing the Mac way up to 18% growth, because I do think they're going to get a lot more Mac Neos into customers' hands. Now, that's a lower price point, but it will drive sales. So yeah, I could be a little bit high on this. If I am, then iPhone needs to go a little bit higher because I still think they're going to get the revenue there.

    They did warn that iPad is facing a tough comp, so I'm putting iPad down 3%. Wearables and home, 4%. It was 5% last time, so maybe consistency there. And Services, just the same as before, 16%, could come in a little bit less. But if it does, again, it's going to be put into something else like the iPhone.

    So overall revenue growth, I think 16% is very much being telegraphed. And as I always say, they already have April on their books. They're communicating exactly at the end of April. They're not going to lie to us and withhold data from April. They know about a third [of the quarter] already, so that's why this guidance is so useful.

    And, as you saw with my error analysis, nowadays, people's estimates are very close. There's a lot of consistency. We're not off more than a couple percentage from each other. That's just because they're so accurate on their guidance.

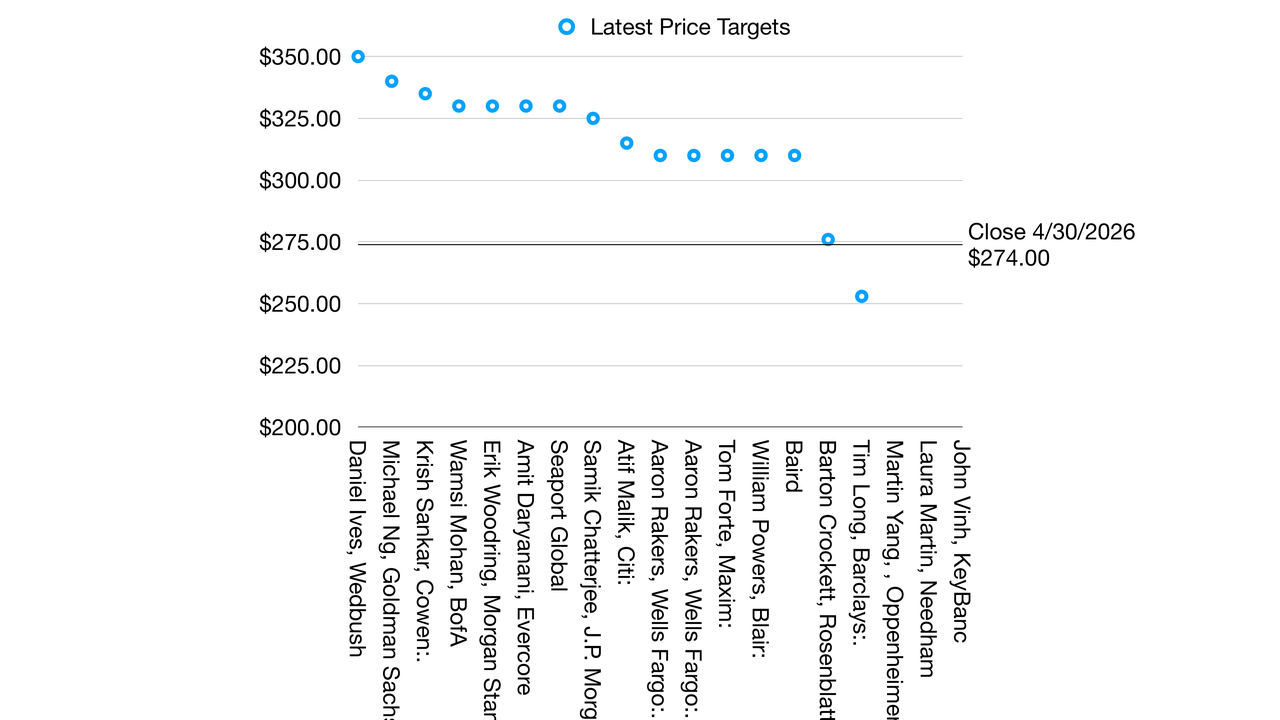
    And speaking of analysts, one more graph. This is just some of the latest price targets. I'm just trying to bring everything together that came out today. This is all very brand new. A lot of targets moved up. Not that it's all that important, but people are getting more and more excited. Almost all the targets from anybody who has a positive— effectively a buy rating— is now above $310 as a target. There's two who are negative, that are at 270 and below. This is Barclays and Rosenblatt. And then there's a few which have no ratings. So they're typically neutral.
    Big shoes to fill: will the haters spare John Ternus?

    But overall, all these numbers are higher than they used to be. Now, again, I don't use that very much, but it's worth keeping an eye on things just to get a sense of how the sentiment is out there. And it looks like the stock is responding positively today. Not by much— 3% or so, last I checked. But that's the story today.

    So given that, this is my first take on the quarter. Love to take questions.

    -- End of Presentation --

    Editor's Note: This presentation is made available to non-subscribers for a limited time. Subscribe to Asymco Oneforfull access to this and other content.
    Recording of Q&A Section

  2. The Composition of Active Devices

    Research · 8 comments

    Measuring the future

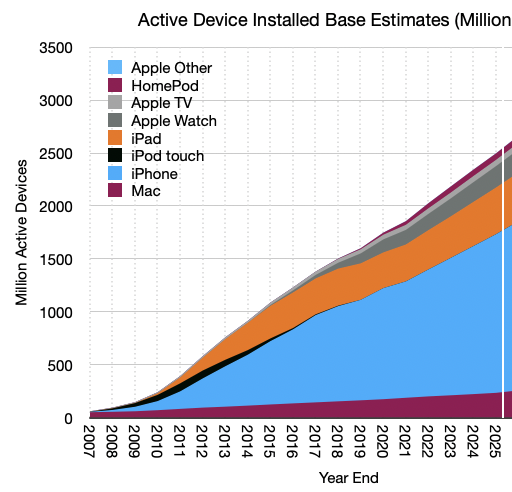
    In January this year Apple reported that there were 2.5 billion active Apple devices in use. This figure has been getting updated for years and I've been reporting its trajectory and other measures that are correlated to it. For instance the number of Apple subscriptions, Apple Services revenues and other historical indicators such as iCloud accounts and Apple Music.

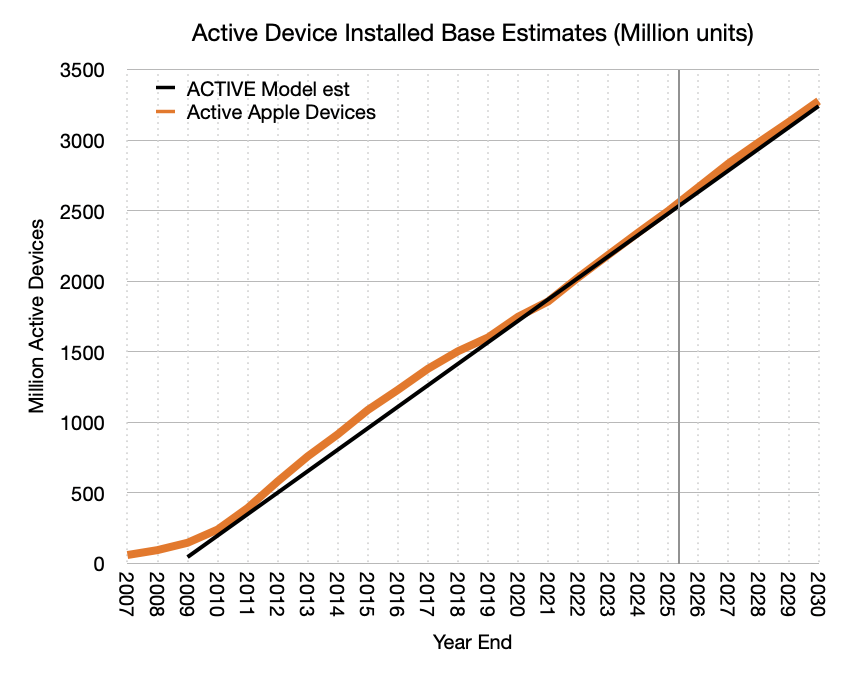
    Simplifying, I published the "ACTIVE" model which makes some basic projections of this total device count and it's shown below"

    One element of the analysis that has eluded me was the more precise composition of this total "devices". In other words, which devices and what is their mix. We have seen numbers for iPhones but not for other types of devices. I should note that this is not easily derived because we have neither the units sold (only revenues) and we don't know how long they stay in use. The measure of active population implies that the products are bought, used and eventually retired.

    The only clue we have, beside quarterly revenues--and even there wearables and home are not separated by product--is that management occasionally mentions that "more than half" of buyers of a specific product are "new to the product". It's not much to go on.

    But there are other data sets we can tap. StatCounter provides a share of platforms in use by aggregating browser identifying data for a moderately large set of web sites. That may help with share of base but not with how much the total base is. Various other analysts do try to summarize some of the installed base for particular dates.

    Combining all the available data and some interpolation, I set out to do is to provide a yearly count of the population of Apple devices for each year since 2007. Then to try to forecast this population to 2030. The result is shown below:

    The following is a summary for the components for the end of 2025 in millions:

    Year-endMaciPhoneiPadWatchApple TVHomePodOther
    2025233150044220358.561.750.5

    This history looks like this:

    What about the future? Let's dig in.


    This is a future five years away. Is this growth rate and consistency in mix a reasonable assumption?

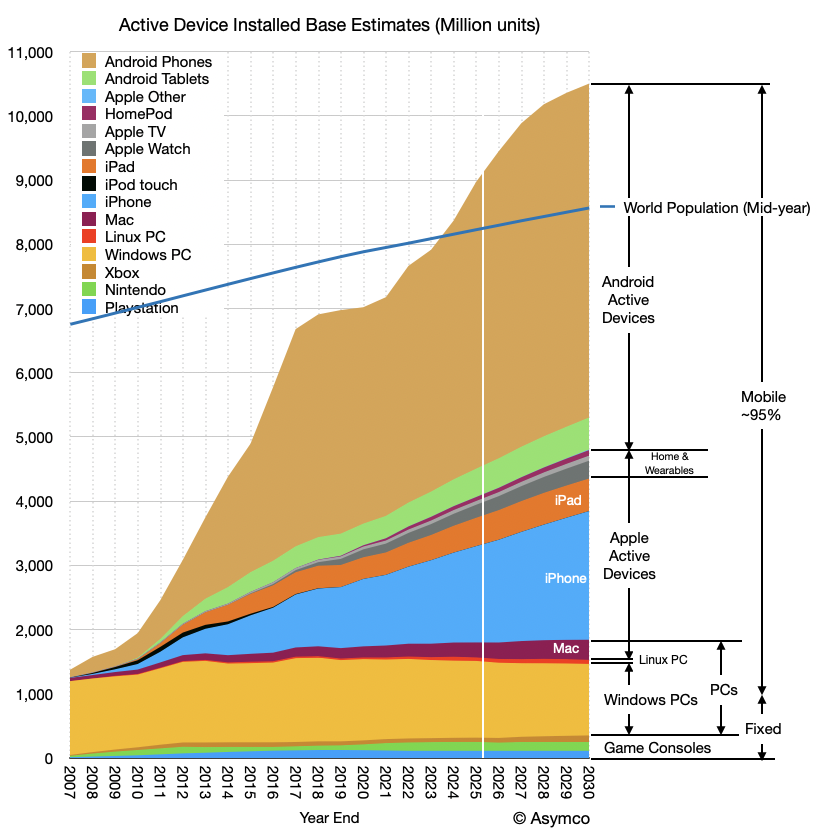
    To answer, we should zoom out and look at not just Apple's device base. The following graph shows also Android phones and tablets, Windows, Linux (PC) and Game Consoles.[1] It contrasts mobile and "non-mobile" computing and shows the total global population (blue line).

    I have several observations:

    • The total device population now exceeds the total human population. The total number of phone lines was already higher for some time[2] but what are shown here are "computers" insofar as they have CPUs and operating systems that can run third-party apps.
    • Given the device count exceeds human count, how much higher can this total go? The forecast shows a slowing of growth within the next five years but this is not a certainty. The attach rate of devices/person could well exceed 1.2 to 1.3 and go to levels seen in wealthy countries (above 2.) If that is the case then the device total may exceed 16 billion at saturation. This has implications for how far current strategies and business models can run.
    • The composition of device types is fairly constant and form factor substitution is rare. New categories beyond phones and current wearables are hard to anticipate but even if they emerge, the evidence suggests they are additive. Evidently the phone did not so much displace the PC but build on top of it. The potential for wearables and home devices to explode is there but it's hard to image these stealing "share of pocket" any more than phones stole "share of desk or share of backpack". If they do explode, they will add to the total via higher attach rates. 3x human population (24 billion) is possible with new wearables and home[3].
    • AI holds many promises but how AI is accessed is not necessarily requiring of or benefiting from new device types. The smartphone is still the best AI device imaginable[4]. Ambient or passive computing can be provided by existing wearables but, as the graph shows, these are augmentative to phones. If AI introduces a completely new form factor, the impact will take decades to diffuse. As the graph shows, the mobile era is now approaching 20 years with the next five years foreseeable with some confidence. The next 15 years will be discussed in a future post.
    • Android typically captures non-consumers who eventually churn into Apple devices. This means that as long as non-consumption exists, Android grows and as long as Android exists Apple grows. If and when Android growth stops then the dynamics will change and Apple might change strategy to accelerate churn.[5]
    • Google and Apple will be the primary distributors for all software and services into the foreseeable future. Try as they might, challengers face over 9 billion in installed base. Note well how entrenched Windows has been on the desktop even as (free) Linux and (better) macOS alternatives have harvested usage. This rigidity has held over the 1.5 billion addressable market for 30 years now. For additional evidence consider the dynamics, or lack thereof, of the game console business.
    1. It excludes servers and early phone platforms such as Symbian, Blackberry and Linux phones.
    2. According to ITU Facts and Figures 2024, there were 112 mobile-cellular subscriptions per 100 inhabitants globally in 2024
    3. Households are 1/3 human population and vehicles are only about 1/7 so Home and Automotive don't move the needle much.
    4. AI is, if anything, putting the "smart" back in "smartphone".
    5. This might be what is happening with the Mac Neo, decades after the PC market saturated. Perhaps pieces have finally fallen into place but apart from Chromebooks, it's been very difficult to challenge the Windows PC head-on. (Though the iPad was possibly designed to displace some of the PC usage, it hit mainly with non-consuming very young or very old and PC use was unaffected.)

    —

    Join me for a live discussion of this research and more at Asymco Office Hours Live Q&A on Friday, May 1, 2026.

  3. Monday Notes: Neo still sinking in

    Nota Bene · 5 comments

    260 million Mac users? Huge room for growth.

    It’s a massive untapped opportunity for Apple, whose Mac installed base of 260 million units lags far behind the iPhone installed base of 1.5 billion units. Mohan believes the total addressable market for the Neo could be $32 billion for 2026. If Apple can capture just 10% of that market for budget laptops, and do so with a 19% operating margin, the company can boost earnings per share by an incremental 3 cents, according to Mohan.

    “We see Neo driving meaningful adoption for first-time Mac owners with a distinct customer base relative to the Air and Pro models,” Mohan wrote.

    The Neo will dramatically disrupt competitors in the market for budget personal computers, Seaport analyst Jay Goldberg wrote in a Monday note, as the $500 to $700 price tier is one of the most profitable segments for PC makers. Both Mohan and Goldberg have a buy rating and $320 price target on Apple’s stock, implying over 20% of upside from current levels.
    Read: Apple turns 50. Here’s how it can shake its midlife crisis.

    As Apple expands into the budget computer market, the company is also looking to seize share from its smartphone competitors during a period of memory crunch. Artificial-intelligence infrastructure is gobbling up so much memory that many suppliers have sold out their capacity through at least next year. That has an impact on makers of consumer hardware that also count memory as a key component.

    Apple has been paying a premium to buy up memory chips in what Goldberg believes is a “is part of a deliberate strategy for the company to tighten conditions for its competitors.”
    This strategy forces competitors to either raise prices for customers or reduce the memory content in their products, according to Goldberg. Meanwhile, he believes Apple intends to maintain both the memory content and pricing of its phones, allowing the iPhone maker to gain share even as the overall phone market shrinks by roughly 10%.

    This strategy “will not come cheap for Apple,” Goldberg warned, noting that Apple’s product gross margin could sink to the low-30% range from the high-30% range seen a year ago.
    “That said, we think the company can make up for some of this lost ground through its share gains,” he wrote, as new Apple users are likely to subscribe to Apple’s higher-margin subscription services to offset the hardware costs.

    Mohan expressed similar sentiments, arguing that the Neo could lead to a stickier overall installed base for Apple and “increased services use over time.”

    Source: MarketWatch

    NB: Two analysts, two stories. The Neo will move the needle and the supply crunch will hamper competition…

    As I wrote before, the key metric is the number of Mac users. 260 million is a reasonable assumption. Over 350 million Macs have been sold in the last 20 years. If we assume half are new to the platform then 175 million have been added. The base in 2006 was probably in the 50 to 60 million range putting the total today at 250 million.

    It's a long way to go to 1 billion Mac users and I don't know if it will ever happen given that most will have to switch from Windows and the lock-in is strong regardless of a better and cheaper alternative being available.

    Nevertheless, a doubling of the Mac user base is certainly a worthy and achievable goal over the next decade.

  4. Morgan Stanley has a stark message for investors in Apple

    Nota Bene · 1 comment

    Run for the hills

    Morgan Stanley just published survey data that makes a strong case for owning Apple stock. The firm's AlphaWise Global Smartphone Survey was released March 22. It shows iPhone upgrade intentions hitting an all-time survey high.

    The data support the bank's above-consensus iPhone forecast. Morgan Stanley keeps its overweight rating and $315 price target unchanged. The stock closed at $247.99 on March 20. That target implies roughly 27% upside from that level.

    The headline number is a blended global iPhone upgrade rate of 37%, up 2 percentage points year over year. That is the highest reading in the survey's history. The driver is China, where upgrade intentions surged 9 points year over year to reach their own all-time high in the survey.

    On the switching side, Apple's net switching rate improved to 11%. That is a five-year high. Apple was the only major smartphone brand in the survey with a positive and improving net switching rate.

    Samsung, Xiaomi, Huawei, and others were all negative. That positions Apple to gain market share in 2026 even as the overall smartphone market faces pressure.

    Together, these data points support Morgan Stanley's FY26 iPhone shipment forecast of approximately 260 million units, which sits 3% above Street consensus.

    The most surprising result in the survey may be the level of interest in a foldable iPhone. Morgan Stanley found that 27% of global iPhone owners are “extremely interested” in paying for one. In China, that figure rises to nearly 40%.

    Morgan Stanley expects Apple to more than double the global foldable smartphone market within 18 months of launch. The base case puts foldable iPhone revenue at approximately $40 billion. The bull case reaches $60 billion.

    The foldable iPhone is expected to launch in fall 2026 alongside the iPhone 18 Pro lineup. If the survey data translates to actual purchases, the FY27 revenue impact would be significant. Morgan Stanley's FY27 iPhone revenue estimate is already 14% above Street consensus. The foldable is a big reason why.

    Apple Intelligence ranked seventh globally as a reason to upgrade to an iPhone.

    Willingness to pay for Apple Intelligence fell. Respondents said they would pay approximately $8 per month for an unlimited subscription, down from roughly $9 per month in the prior year's survey.

    Morgan Stanley flagged this as a risk worth watching. AI features remain important to smartphone buyers broadly. But Apple appears to be lagging Android competitors in consumer perception of its AI capabilities.

    Morgan Stanley laid out the key variables investors should watch this year:

    iPhone upgrade cycle. Record upgrade intentions suggest the aged iPhone installed base is beginning to refresh. Replacement cycles are expected to contract by 0.2 years in 2026, which supports shipment volumes.

    Foldable launch execution. The survey demand signal is encouraging, but first-generation foldable adoption is inherently uncertain. The revenue upside is large if execution is strong.

    Memory cost impact. Unprecedented memory price inflation is expected to push global smartphone prices higher. Morgan Stanley sees this as a bigger headwind for Android competitors than for Apple, given Apple's pricing power. But the June quarter gross margin guidance will be the first real read on how Apple is managing the cost pressure.

    Apple Intelligence revamp. The 2026 Siri upgrade needs to meaningfully improve consumer perception. The current trajectory is moving in the wrong direction.

    Morgan Stanley's $315 price target is based on 8.5x EV/Sales on FY27 estimates. That implies approximately 32x FY27 EPS of $9.74. Its revenue forecast sits well above the Street even as its EPS estimate is broadly in line with consensus.

    The survey does not guarantee an upgrade supercycle. But the data points in that direction. An aged installed base, record upgrade intentions, strong switching dynamics, and a new form factor in the back half of the year make for a compelling setup.

    Morgan Stanley thinks the market is not fully pricing that in yet.

    Source: TheStreet

    NB: the byline: Morgan Stanley just changed the Apple conversation …

  5. Survey shows iPhone improved retention, purchase intent, growth in services, service pricing, product mix, foldable upside

    Nota Bene · 1 comment

    Attach rates for iCloud reached about 42%, while Apple Music stood near 30%

    The iPhone ecosystem is showing signs of increased customer loyalty and steady demand, while its high-margin services business remains a key support to profitability, according to UBS analysts.

    The bank, which maintains a 'Neutral' rating on Apple with a 12-month price target of $280, cited findings from its Evidence Lab survey of roughly 4,000 iPhone users globally. The data suggests that iPhone “stickiness” continues to improve, even as replacement cycles remain relatively stable.

    UBS said the average age of iPhones in use globally was largely unchanged year-over-year at about 33 months. Outside China, device age edged slightly higher to around 38 months, a trend the analysts said could push some upgrade demand into 2027.

    At the same time, customer retention strengthened, with the global iPhone retention rate rising about 200 basis points to roughly 74%. Gains were particularly notable in the United States and China, where retention increased by 200 and 700 basis points, respectively. UBS belives that this indicates Apple is maintaining share despite a competitive smartphone market.

    Purchase intent also improved across regions, with more surveyed users indicating their next smartphone would be an iPhone. The UK recorded the largest increase, while China also saw a meaningful rise despite what UBS described as a challenging competitive backdrop.

    The report highlighted continued growth in Apple’s services ecosystem, particularly iCloud and Apple Music. Attach rates for iCloud reached about 42%, while Apple Music stood near 30%, trends UBS said should help sustain services gross margins above 75% through fiscal 2026 and 2027.

    Higher-tier iCloud usage is also increasing, even as Apple raises base storage on newer devices. Among iPhone 17 users, 77% reported subscribing to mid- to high-tier iCloud storage plans, compared with roughly 60% across the broader installed base. UBS noted that additional services uptake carries incremental gross margins of at least 90%, helping offset potential pressure from rising memory costs.

    On the hardware side, consumers are also opting for higher storage configurations. UBS wrote that 56% of iPhone 17 users purchased models with more than the base storage, up about 800 basis points year-over-year. This shift could support product margins, with incremental storage estimated to generate gross margins of around 75% on roughly one-fifth of sales.

    Looking at the installed base, UBS estimates about 68% of iPhones in use are from the 14 through 17 series, while around 40% are Pro or Pro Max models. The analysts said this premium segment could be a target market for a potential foldable iPhone, though they expect the opportunity to be relatively limited given the anticipated price range of $2,000 to $2,500.

    UBS estimates a foldable launch could result in as many as 8 million units in fiscal 2026, contributing roughly 6 million incremental iPhone shipments, or about a 2% uplift to its forecast of 251 million units.

    Source: Yahoo Finance

    NB: Neutral rating. Let's summarize the findings.

  6. Asymco Bulletin 001 / 22 Feb 2026

    Bulletin

    Asymco Bulletin is a digest of all the work we have published for the week ending Feb 22, 2026.

    Research

    Teen Survey Update: What happens when teens grow up?

    Latest data indicates 88% of teens own and intend to purchase iPhones, marking a decade-long trend of increasing adoption. This phenomenon transcends mere functionality; the iPhone has become a cultural icon, symbolizing status and identity.

    Unlike other Apple products, such as Apple TV+ or Apple Music, which struggle for traction among teens, the iPhone's appeal is deeply woven into the social fabric, partly due to generational continuity—the children of early iPhone adopters are now loyal users themselves.

    In contrast, social media platforms illustrate the fickle nature of tech usage among younger demographics. While Facebook remains prevalent among older millennials, Gen Z gravitates towards Instagram and TikTok, reflecting shifts in cultural preferences and digital behaviors.

    For Apple, success in services like Music and TV+ hinges on leveraging existing family dynamics through bundling.

    Read More →→→

    Apple in Europe: How many iPhone switchers are addressable in the near term?

    On the Q4 call, Tim Cook highlighted Greater China’s 38% year-over-year revenue growth, fueled by record iPhone sales, strong upgrade activity, and double-digit retail traffic gains.

    Europe, however, drew little attention—despite generating more revenue for Apple than China. This is peculiar.

    Europe’s smartphone market shows steady structural gains for iOS. Since 2018, share has risen from 24% to 39%, while Android has fallen from 74% to 60%—a 15-point swing equal to roughly 70 million additional users. With an installed base near 459 million users versus about 300 million in the U.S., Europe combines scale with affluence.

    In sum, the pattern for Apple in Europe is not saturation but share transfer, signaling durable competitive strength in a mature market and an inkling of how all markets will eventually behave in maturity.

    Read More →→→

    Estimating 2035 iPhone Users

    In the last quarter Apple reported 2.5 billion active devices. Of those, I estimate 1.6 billion are iPhones.

    Using this as a base, I've created an iPhone installed base estimate looking forward to 2030, integrating Statcounter’s market share data, Ericsson’s global smartphone user forecasts, and BankMyCell’s smartphone install base.

    The sources broadly align through 2025, though Statcounter’s historical iOS share (2017–2023) diverges somewhat, possibly reflecting Android’s heavier web traffic footprint due to usage patterns and bot activity rather.

    Taken together, the data points to iPhone nearing 2 billion active devices by 2030, consistent with overall smartphone adoption. Android’s projected rise toward 4.5 billion users signals continuing headroom.

    If switching dynamics and monetization trends persist, Apple’s ecosystem could expand to 2.5–3 billion users by 2035, with growth thereafter driven by switching and increased engagement depth and value extraction per user.

    Read More →→→


    Nota Bene

    Apple Announces Special Event in New York, London, and Shanghai on March 4 → Apple is hosting intimate, global "Special Apple Experience" events on March 4, 2026, likely unveiling new products like the iPhone 17e and M5-powered MacBooks, marking a fresh twist on traditional live-streamed launches.

    Apple adds video experience to Apple Podcasts → The "pod" in podcasts originated from Apple's iPod, with the company popularizing the medium by integrating podcasting into iTunes in 2005, and continuing to innovate with features like video podcast support and dynamic ad insertion.

    Why not maroon? The Macalope ponders the power of color → Apple's upcoming lineup, featuring color-excited anticipation for the iPhone 17e and modest updates to iPads, promises subtle yet intriguing tech advancements.

    Dan Ives Says Apple’s AI Alone Could Be Worth $1.5 Trillion → Apple's unparalleled distribution through its vast user base offers a significant competitive edge for rapidly monetizing AI innovations, potentially adding $1.5 trillion in value.

    While big tech burns cash on AI, Apple waits → As foundation models commoditize, Apple strategically curates top AI tech into its ecosystem, prioritizing user experience over engine development.

    Secure the chips, absorb the costs, and grab more market share → Apple faces memory cost inflation potentially raising iPhone prices, yet its strong ecosystem and execution provide resilience, whereas competitors like Samsung may struggle more due to lesser volume leverage.

    iPhone Emergency SOS via Satellite Helped Six Skiers Survive Tahoe Avalanche → Six skiers survived a deadly Lake Tahoe avalanche by using iPhone's Emergency SOS via satellite, highlighting its transition from luxury to essential. This feature enabled crucial communication with rescuers in remote areas lacking cellular service. The evolution mirrors mobile phones but faces slower adoption due to satellite bandwidth constraints.

    The US Supreme Court has ruled against US President Donald Trump’s decision to impose a raft of global tariffs → Apple and other affected companies may soon seek refunds for tariffs paid, following the Supreme Court's decision to invalidate Trump's tariffs, though the exact timeline and amount remain uncertain.

    Bankers complain that Apple has a tight grip on mobile payments → Canadian banks struggled to compete in the mobile wallet market, dominated by tech giants like Apple and Google, due to their risk-averse nature clashing with tech's innovation-driven approach.


    The all new Asymco One

    Introducing Asymco One Early Bird Pricing. → Asymco celebrates 17 years of insightful Apple analysis, launching Asymco One to guide stakeholders through Apple's evolving era with comprehensive content and community engagement. →

    Introducing: Asymco One Office Hours → Join Asymco One's monthly Office Hours with Horace to get live insights on Apple's business and financials, with special editions during key events.

    All Asymco Podcasts. All in One: Asymco One. → Exciting news: All Asymco Podcasts now under Asymco One subscription with remastered classics and new episodes.


    Asymco One gives you full access to our research, analysis, and commentary. Subscribe with code BULLETIN for a discount.

    Feedback: Have questions or comments? Reach out to us at contact@asymco.com. We’d love to hear from you.

  7. Predicting Apple's Biggest Quarter Ever

    Research

    Apple's Money Mountain

    As we approach the earnings release for the first fiscal/fourth calendar quarter for Apple, it's time to look back three months at what the company delivered and guided in the previous quarter.

    The summary for results for fourth (fiscal) quarter of FY2025:

    • Revenue up 8% year-over-year, a new September quarter record.
    • EPS was up 13% year-over-year.
    • Product revenue was up 5% year-over-year driven by growth across iPhone and Mac.
    • iPhone revenue was up 6% year-over-year, and set a September quarter record despite supply constraints faced on several iPhone 16 and iPhone 17 models.

    The iPhone active installed base grew to a new all-time high and had a quarterly record for upgraders. Also, Apple reached a new all-time high for installed base of active devices.

    • Mac revenue was up 13% year-over-year, driven by MacBook Air.
      Apple grew in every geographic segment, with strong double-digit growth in emerging markets.
      Mac installed base reached another all-time high, with nearly half of customers who purchased a Mac being new-to the product.
    • iPad was down 3% revenue and but over half of the customers who purchased iPad this quarter were new-to the product. iPad also had a September quarter record for upgraders.
    • Wearables, Home & Accessories Revenue for the category was flat y/y.
      Apple saw a September quarter record for upgraders to Apple Watch, and over half of Apple Watch buyers were new-to the product.Both the Apple Watch and AirPods installed bases reached new all-time highs.
    • Services again set a new all-time revenue record up 15% year-over-year.
      Apple saw double-digit growth in both developed and emerging markets.
      Apple saw a sequential acceleration across the majority of the categories and set new all-time records across Advertising, App Store, Cloud Services, Music, Payment Services, and Video. Apple saw a double digit growth in Apple Pay.

    Guidance was provided as follows:

    We expect iPhone revenue to grow double digits year-over-year, which would be our best iPhone quarter ever. On Mac, keep in mind, we expect to face a very difficult compare against the M4 MacBook Pro, Mac Mini and iMac launches in the year ago quarter. We expect Services revenue to grow at a year-over-year rate similar to what we reported in the fiscal year 2025.

    We expect gross margin to be between 47% and 48%, which includes an estimated impact of $1.4 billion of tariff-related costs. And so for the December quarter, we expect operating expenses to be between $18.1 billion and $18.5 billion. We expect OI&E to be around $150 million, excluding any potential impact from the mark to market of minority investments and our tax rate to be around 17%.

    Based on these forecasts my estimates for the top, bottom and middle lines are as follows:

    • Revenues: $140 Billion (+12%)
    • EPS: $2.70 (+12.5%)
    • iPhone: $78.9 Billion (+12%)
    • Mac: $9.4 Billion (+4%)
    • iPad: $8.5 Billion (+5%)
    • Wearables: $12.9 Billion (+10%)
    • Services: $30 Billion (+14%)

    If there is an error in the above I would guess it's in iPhone being too low and the iPad/Mac and Wearables being too high. Nevertheless, I think this will be Apple's biggest quarter ever with significant growth acceleration on the top and bottom lines. [Notable will also be a rapid acceleration in R&D spending (+25%) as suggested by guidance.]

    As we head into this blockbuster quarter, Apple shares are trading at a P/E ratio of 32 to 33, a significant drop from above 35 during previous few quarters. During the last three months, the share price has declined about 15% as Mr. Market looked at the money mountain above and decided he wanted none of it.

  8. A Billion Users

    Research

    In the latest Apple Earnings report, Apple announced a few details that are relevant to the forecast of the business:

    • The global active installed base for iPhone reached an all-time high at the end of December, surpassing 900 million devices. This represents growth y-o-y in each of five geographic segments, and growth of almost 75 million in the last 12 months alone
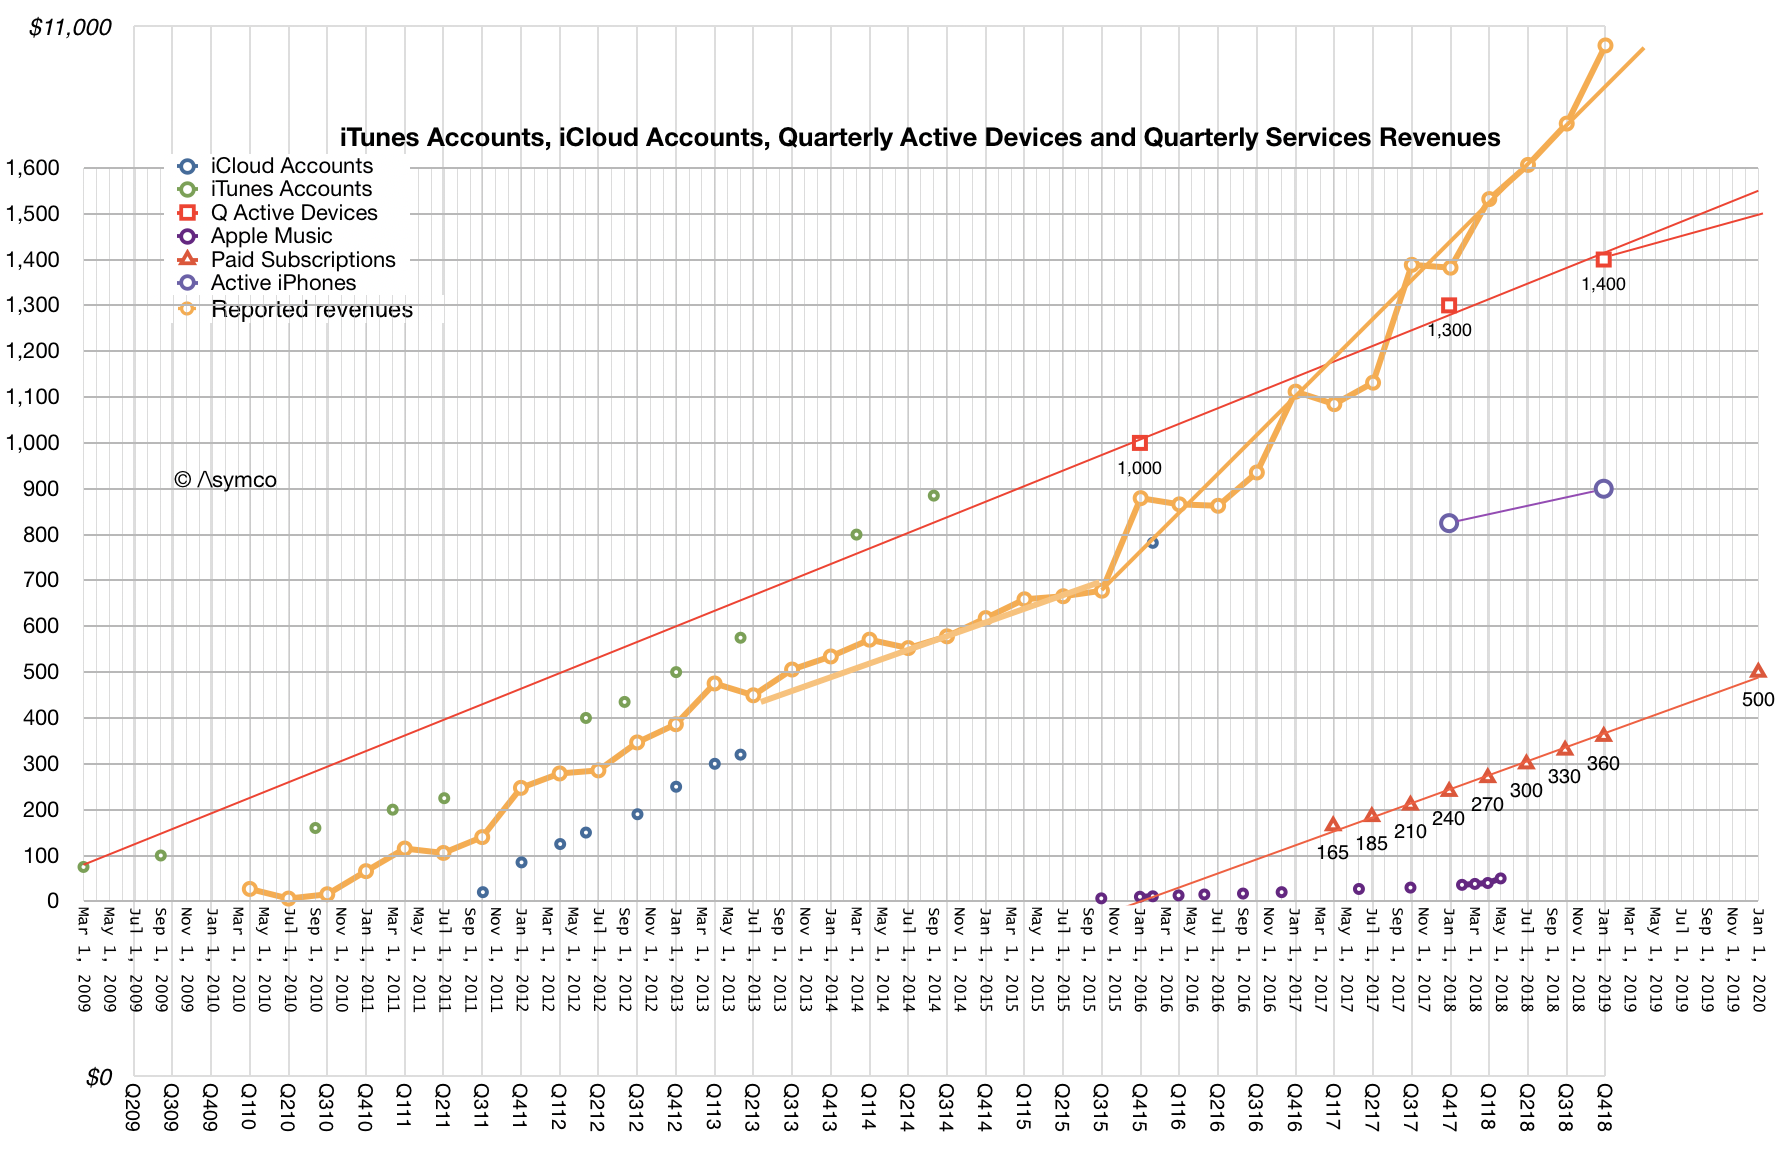
    • There are now over 360 million paid subscriptions across the Services portfolio, an increase of 120 million versus a year ago. Apple expects to surpass 500 million in 2020.
    • The installed base grew to 1.4 billion devices by the end of December. This includes all-time highs for each of the main product categories and all five of their geographic segments.

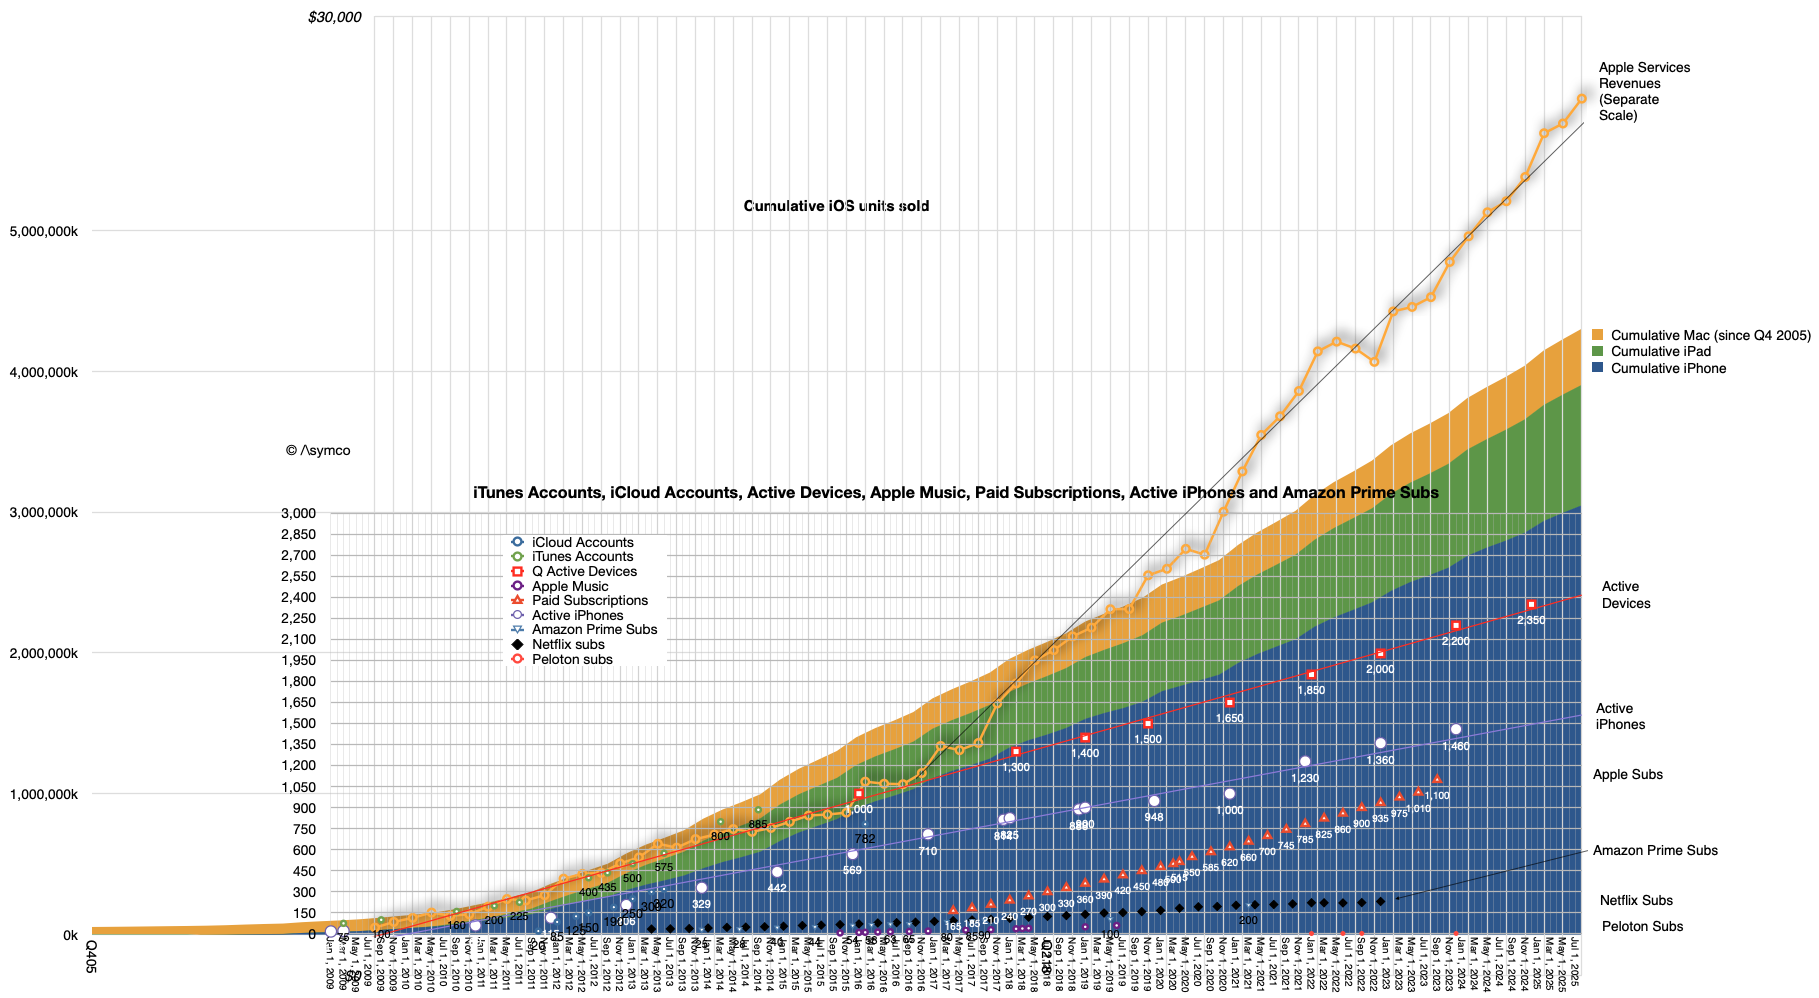
    I added all these data points to the previous reported figures related to installed base, subscriptions and Services revenue.

    Note that all the data sets show a linear growth path. Most prominent is the paid subscriptions line which is growing at exactly 30 million per quarter. The new projection of 500 million by 2020 is exactly in-line with this projection.

    Note also that active devices and iPhones are on similar trajectories. The figure for active iPhones is interesting because it very closely relates to active users. It's extremely likely that 900 million active iPhones means 900 million active iPhone users. An iPhone is useful if it has a data plan associated and it's a costly proposition for most people to have multiple devices and multiple data plans.

    This close relationship between iPhone usage and iPhone users means that we can approximate the entire unique user base for Apple. There might be "10s" of millions of users who use Apple devices but don't use iPhones but there might also be multiple iPhones for some users ((I would be inclined to assume that there are more non-iPhone Apple users than multiple iPhone users.))

    So it's very likely that the total Apple user base is between 900 and 1 billion. If it's not 1 billion now then it's very likely it will be 1 billion within 12 months.

    In May 2010 I made the prediction that Apple would reach a billion users in 5 to 8 years. The prediction was based on the first 100 million iOS users. The company reached one billion active devices in a bit over 5 years and is about to reach 1 billion users 8 years since.

    Apple stated in the latest conference call that very little of Services revenues depends on the any previous quarter's unit sales confirming that Services is driven almost entirely from the user base. With almost a billion users, 90+% loyalty rate, 95% satisfaction, 120 million paid subscriptions and 75 million new users/yr, the analysis of Apple as a services company is becoming interesting.

  9. An interview with Chris Brennan for MacUser magazine UK

    Research · 30 comments

    Chris Brennan asked a few important questions regarding potential saturation of the iPhone market.

    Is the iPhone anywhere near saturation? Can Apple continue to shift iPhones in ever increasing numbers or is a sales plateau realistically on the horizon?

    The market for mobile phones is approximately 5.5 billion connections, perhaps 5 billion users. The iPhone has approximately 300 million installed base. I consider a base of 1 billion users to be a minimum for continuing participation in this market long term. Licensed platforms will reach this in no more than two years. I don't know what Apple's ambitions are but if they don't triple their base I don't see a strong future for the company in mobile phones. In order to triple the base the company will need to sell substantially more than an additional 700 million iPhones. The retirement rate can be as high as 50% of installed base. Apple will need to sell at least 1 billion iPhones in the next few years. Seen another way, Apple has a market share of about 9% on a quarterly basis. This needs a lot of improvement. Chinese vendors are not standing still.

    Can the Mac also continue to outperform the rest of the PC market for long?

    The PC market is in decline. It will continue to decline as its disruption continues. The PC market will still exist 10 years from now but, similar to the mainframe market, it will be hard to notice. Apple is doing a fine job carving out a large portion of that market for itself but overall it's an increasing portion of a decreasing pie. It would be better to track the share of profits captured or even share of value rather than units. The reason units were important 20 years ago was because platform dynamics determined whether a marginal platform could survive. Would a 5% share be enough to attract developers? That is no longer an interesting discussion. Applications for PCs are not an area of investment for any significant pool of capital. Development has moved almost entirely into mobile or web. Therefore, as the PC is now a commodity product, the best performers are those who can capture a larger margin. Those margins should be subsequently be invested in new platforms. PC vendors who neither capture margin, nor invest in new platforms are strategically insolvent.

    Finally, this exponential growth of Apple products has to end some time soon doesn't it? How many high-income buyers for expensive products can there be left for Apple to target?

    Trying to calculate the limits to growth is futile. There are limits but they are not calculable and inaccurate estimates don't offer any useful information.

    In 1939 a total of 921 military aircraft were built in the United States. Five years later, in 1944, annual production was 96,318. A question could have been asked by an aviation analyst in 1939 about whether the American aircraft industry could grow. Aircraft, especially multi-engined ones used by the military were _extremely_ expensive. The reason an industry grew exponentially making extraordinarily expensive products was not because of organic demand but because the primary buyers engaged in a cataclysmic global war. In other words, there was a will to buy and hence there came a way to build. Therefore the answer to the question of sustainable growth comes not from an analysis of demand but from an analysis of the consequences of not growing. Not growing would have meant the end of many nation states.

    Your question was framed by an implied market categorization: that buyers are either high-income or, presumably, low-income. This is a false dichotomy. Buyers are either needful of a job to be done or not. If the job is important enough, money will be found to hire a product. Sellers of products will also find ways to meet the demand through lower prices and increased capacity. Every product Apple makes used to be out of the reach of all consumers. Whether computers (portable or not), music players and professional grade software, voice recognizing personal assistant cellular phones and tablets are all luxuries or necessities is only a question of timing.

  10. Half of US iPhones are repeat purchases

    Research · 46 comments

    Canaccord Genuity analyst Mike Walkley writes in a note to clients today. “In fact, we believe iPhones are outselling all other smartphones combined at Sprint and AT&T and selling at roughly equal volume to all Android smartphones at Verizon.”

    via iPhone Tops Sales Charts at Each of Its U.S. Carriers - John Paczkowski - Mobile - AllThingsD.

    That's useful data. Mainly because we can use it in combination with comScore data that tracks a different market measure. comScore's MobiLens service tracks US mobile installed base. By measuring the difference between their stats one month to the next, one can measure the gain in a particular platform.

    Comparing that gain with the sell-through rate in the same period can yield a figure for the number of units sold as upgrades vs. those sold to new users.

    The latest comScore data (period ending February) shows that Android added 2.87 million users to its base while iPhone added 1.52 million. If we assume that Android sold a minimal number of replacements (due to the limited time in use of bulk of units) and round up to 3 million for February, and if we assume that Apple sells as many iPhones as Android (which is what Walkley suggests) then we can conclude that in the US roughly half the iPhones are bought as replacements for existing iPhones.

    Extrapolating this to global markets may be risky but already we can begin to form a picture of how the iPhone franchise is becoming an annuity-based business.

    Apple likes to point out that "half of Mac buyers are first time buyers." In the case of the iPhone perhaps they could also say "half of iPhone buyers are repeat customers." At this stage in the platform, that's a powerful statement. If the repeat customer rate is high then it suggests strong loyalty but it also may suggest poor competitive position vs. non-consumption or alternate platforms. If the repeat customer rate is very low it may suggest competition vs. non-consumption but it may also suggest low loyalty. It all depends on the overall growth in the market and size of installed base.

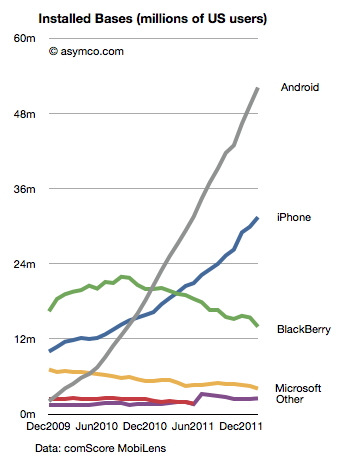
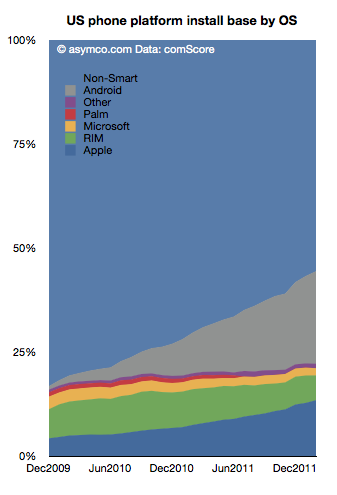
    The following chart shows the overall market growth and the position of the various platforms within that growth.

    Note the time scale is slightly more than two years. This suggests that the vast bulk of Android units in use (grey area) consists of first use units. New purchases are going to first time buyers. In contrast, the shrinking RIM total implies extremely low sales as the age of the base is far older than the time scale. iPhone base is both growing and being upgraded.

    As we reach 50% penetration of smartphones, platform churn will become a significant component of market performance. The loyalty and "stickiness" of Android will begin to be tested. Current surveys show reasonably good satisfaction ratings for Android phones (around 60%) while iPhone's are even higher. But let's keep in mind that RIM's satisfaction and the loyalty of their customers was exceptionally high a few years ago. The rate of evaporation of goodwill toward the brand is breathtaking.

    The longer term test of mobile platform performance will be in the recurring purchase rates. Loyalty must be earned and preserved. I.e. "You come for the product, you stay for the ecosystem."

    So far, the iPhone seems to be getting a passing grade while Android has yet to face the test.

  11. Android Economics

    Research · 88 comments

    Charles Arthur, writing for The Guardian, has noted that court filings seem to be revealing Google's Android revenues. If this is the case, we have a significant breakthrough in understanding the economics of Android and the overall mobile platform strategy of Google.

    The new data is a reference to a settlement offer Google made to Oracle of $2.8 million and 0.515% of Android revenues on an ongoing basis. The key assumption to make this data useful is that the $2.8 million offer represents 0.515% of revenues to date.

    In other words, that revenues from 2008 to end of 2011 multiplied by 0.00515 results in $2.8 million. That implies that revenues from 2008 to 2011 were $544 million.

    I think that's a fair assumption. I don't see why Google would offer a higher or lower royalty rate for years 2008 through 2011 than for years after 2011. The offer would seem to be 0.0515% in the future as well as retroactively in the past.

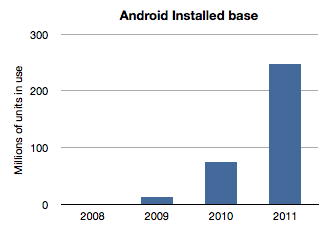
    If we work with this assumption then the next question is how to distribute this $544 million over the four years 2008 through 2011? The installed base of Android has grown exponentially and it would seem logical to assume that revenues have followed in a similar pattern. Here is a chart of installed base given activation data supplied by Google.

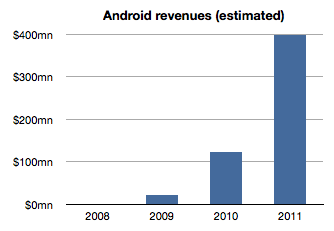
    If we assume revenues were distributed the same way we would get something like this:

    The sum of the bars in this chart equals $544 million and the ramp is approximately the same as the installed base. The relationship between the first graph and the second is a multiple equivalent to the revenue per device.

    Therefore a second assumption is that revenue per device remained fairly constant. In this model the revenue comes out to be about $1.70 per device per year. It's possible that rev/dev/yr. is increasing as Google services are discovered by users. It's also possible that the rev/dev/yr. is decreasing as later adopters are less likely to engage as early users. I just don't know how to adjust this value so by leaving it at the average, I can avoid introducing more assumptions.

    Now we can stop and look at this figure and do a test. Does $1.70 make sense as a device revenue for Android? Google had spoken about targeting $10/device/yr. but we have no indication that they are nearly at that level. If they did achieve that level, with an installed base of 300 million, Google could be collecting $3 billion a year in Android income. Are they getting it?

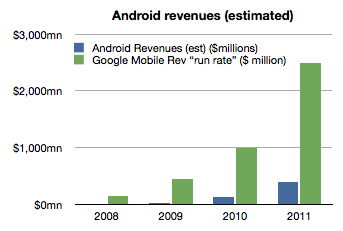
    As of October, Google mentioned that it had a $2.5 billion "mobile run rate". But we know that this figure is not only from Android. Mobile includes all mobile devices and services including those running inside iOS, Symbian, BlackBerry, Windows Phone, etc.  They could be counting ads on all mobile browsers as well as ads running inside all apps on all platforms. Furthermore, Google also testified that iOS accounts for two thirds of their mobile search revenues[1].

    Adding run rate to the Android revenue chart results in the following:

    So the step is to take the "run rate" figure of $2.5 billion and assume, as Charles Arthur did, that iOS income is what is left after taking out the Android part[2]. I also noted that Google previously mentioned a run rate of $1 billion and I will assign that run rate to 2010 and $2.5b to all of 2011. Since we know the number of iOS devices in use for years 2010 and 2011 we can calculate Google's revenues per iOS device in use.

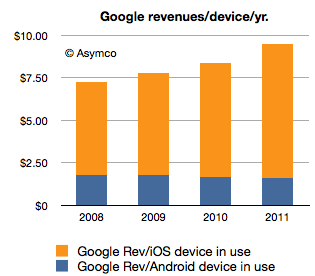
    If we thus combine all the data we know (revenues derived from settlement offer, units in use, run rate and iOS installed base) we get the following revenue profile:

    This shows a positive trend for Google: revenues per smartphone per year is increasing. However, the growth is coming from non-Android devices which means mostly iOS. Revenues per device for Android is probably declining.

    The story for iOS revenues however is not all rosy for Google. Google has to pay for that revenue. The mechanism is a payment that Google makes to Apple for the prominent and default placement of Google search on Safari.

    We don't know the terms of the arrangement but if we assume $2/device Google needs to shave $2 from the top of the chart above with that money going to Apple (attached as iPhone/iPad service revenues.)[3]

    That still leaves a healthy $8.33 in 2011 as operating income from mobile with $1.70 or so coming from Android.

    However, to make this operating income into bottom line profit, we have to extract the R&D and SG&A associated with mobile at Google. This would be, therefore, Andy Rubin's yearly budget.

    Andy Rubin has stated in the past that Android is profitable. That is certainly believable. The budget would have to be about $400 million/year in 2011.

    Charles Arthur concluded that Google obtains four times more revenue from iOS than from Android. My estimates indicate that in 2011 the revenue ratio was closer to 5 but if we subtract the cost of those sales in the form of payments to Apple then the ratio could well be four to one.

    Many of these figures begin to "hang together" as we balance assumptions about costs, revenues and statements made in public. There is a consistency within a comfortable margin of error. If that is the case, then the economics of Android begins to take shape.

    My take is that it's not a bad business. But it's also not a great one. As long as there is exponential growth in units, Android will improve its position inside Google relative to iOS. But from Google's perspective, iOS is today a bigger business. And iOS is not standing still. It's growing not only in terms of units but in revenue per unit.

    Strategically, and historically Android was never one thing. P&L considerations were not the only (or even at all) factors in investment for Google. Having a hedge against hegemony of potential rivals, having a means to learn and develop new business and having a role in defining the post-PC computing paradigm are all probably bigger considerations than profitability.

    So in terms of returns, Android is sustainable. However, in relative terms the value created leaves much to be desired. Whereas Android generates $1.70/device/year and thus an Android device with a two year life generates about $3.5 to Google over its life, Apple obtained $576.3 for each iOS device it sold in 2011[4]. The economics of Android are nothing like the economics of iOS.

    ---

    Notes:

    1. This figure is also not conclusive as search is not the only form of revenue on a mobile device but it does imply that Android is not the majority of Google's mobile revenues.
    2. Clearly this is overstating iOS as the non-Android income is broken up between several platforms. We can only say that iOS is the vast majority of non-Android income.
    3. Assuming a $2/device payment model means Google paid $312 million to Apple in 2011 and $171 million in 2010. This would go toward boosting Apple's revenue per iOS device. Naturally, if this distribution cost is higher or would be subject to re-negotiation then it could vary widely.
    4. The iOS figure includes accessories and licensing of trademarks but excludes income from App Store, iTunes music, movies, TV shows, iBooks, greeting cards or textbooks.