Asymco Bulletin is a digest of all the work we have published for the week ending Jul 26, 2026.
Office Hours
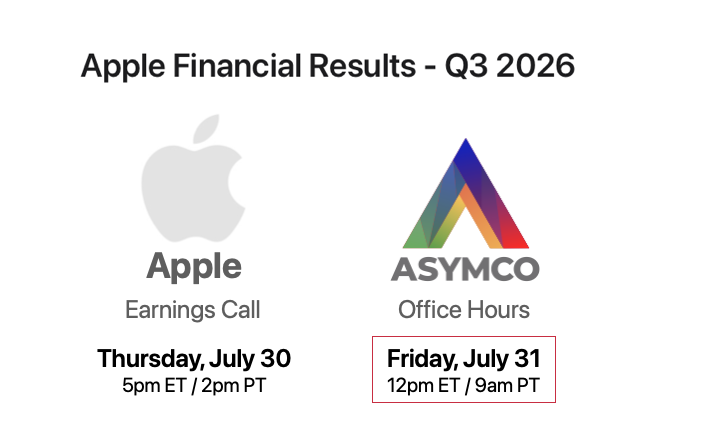
Asymco Office Hours Live Q&A — Friday, July 31 → The next Asymco Office Hours Live Q&A will be on Friday, July 31st at 12pm ET / 9am PT, the day after Apple’s fiscal Q3 2026 earnings call on Thursday. Horace will review the results and their implications, and we will take Q&A from our live audience.
Asymco One subscribers are guaranteed seats, can bring a guest, and will have access to the live recording.
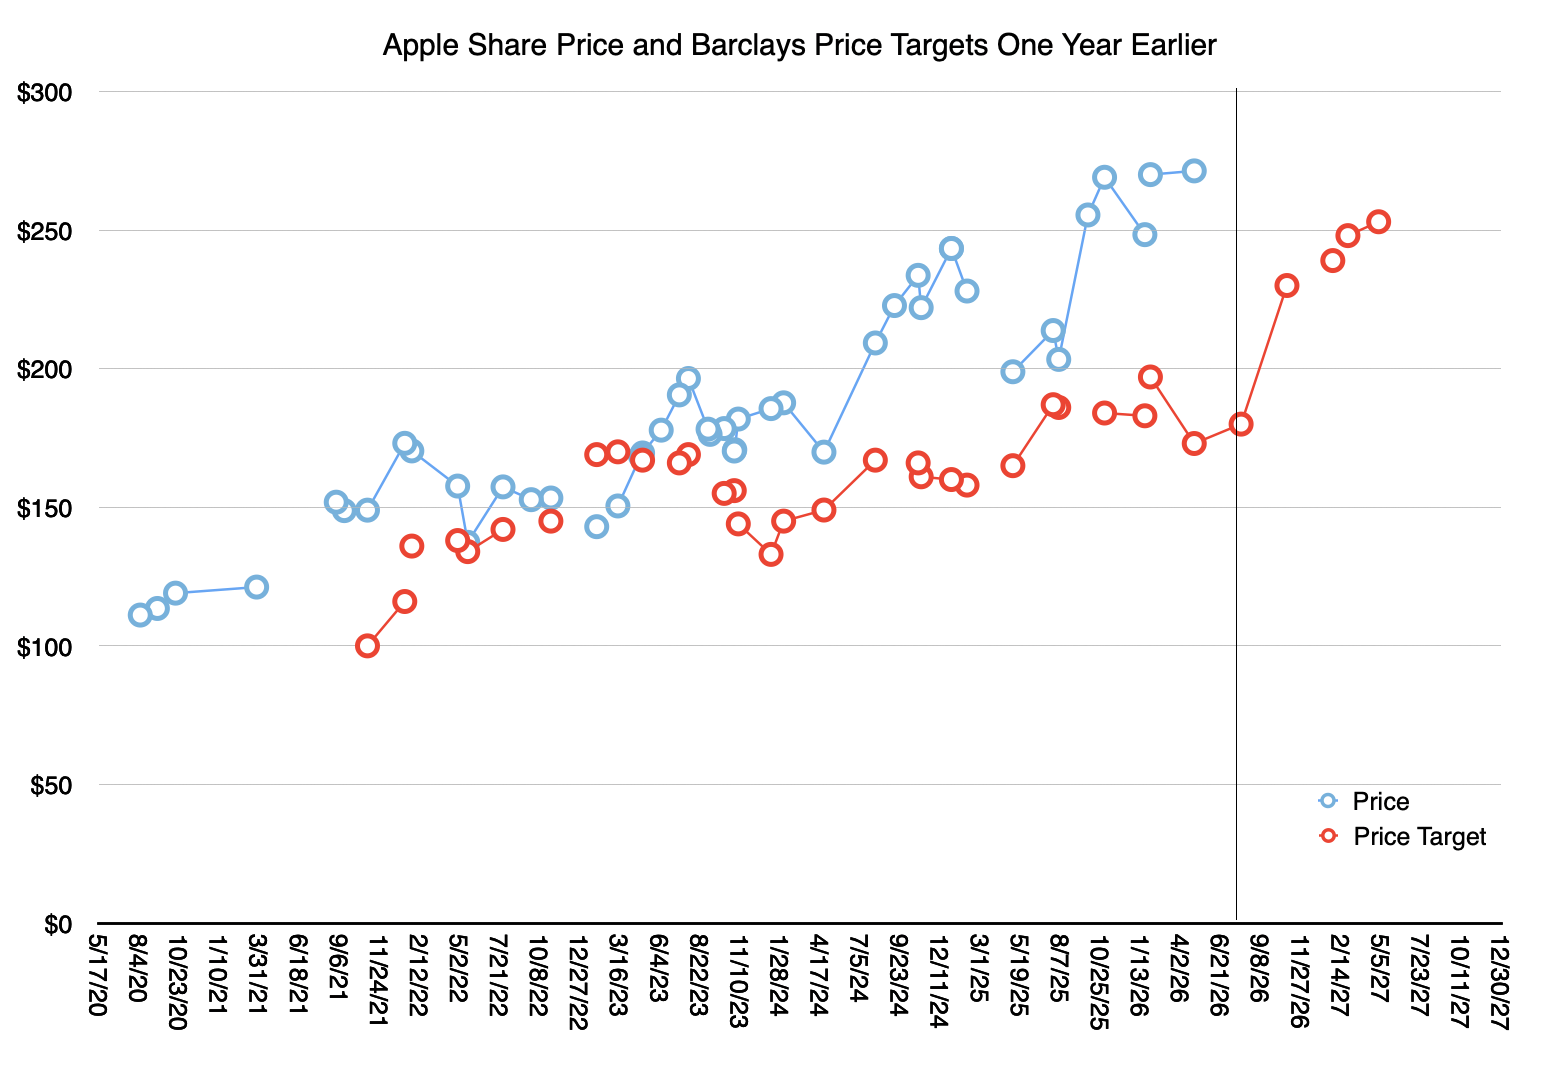
Tim Long of Barclays has a Sell rating on Apple while the shares sit at an all-time high. Barclays has been at hold or sell since 2014, when the split-adjusted price target was $20. Since then the targets have risen 1,165% while the rating has fallen, with a 30% average error on one-year targets. The only way to square rising targets with a falling rating is to argue that all your previous ratings should be ignored. How long does an analyst insist on being ignored? →
Apple reports on July 30th and we will hold Office Hours the next day. My estimate is 15.9% revenue growth with iPhone up 21%, gross margin at 48.5% and EPS of $1.93, up 23%. Memory pricing is the big worry, but June and July inventory was provisioned before the increases, so I am not worried about a margin miss this quarter. The squeeze arrives in next quarter’s guidance, where 45% would not surprise. →
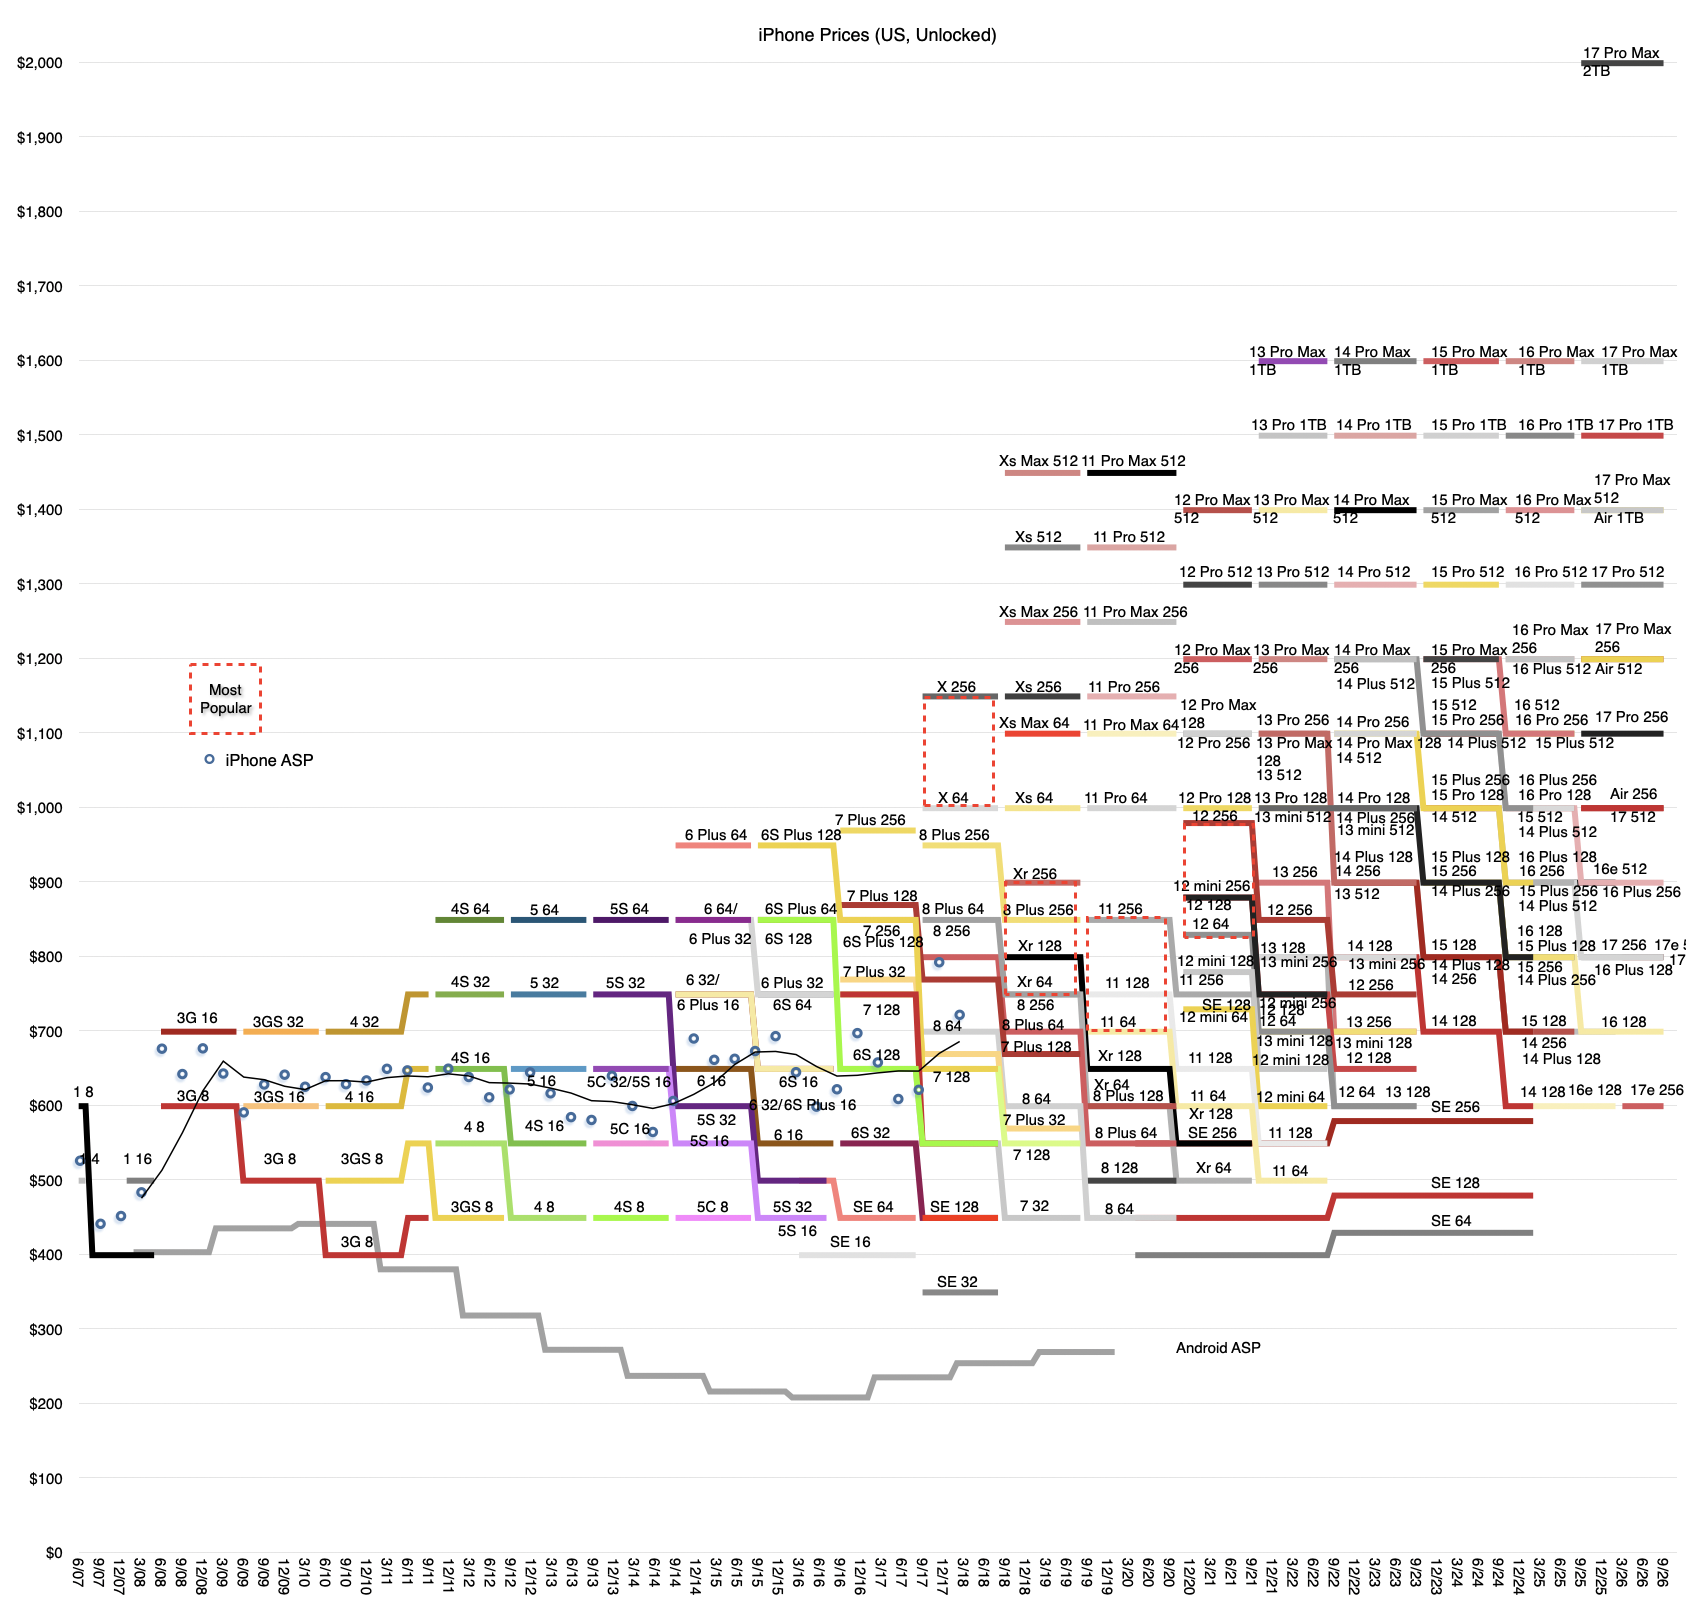
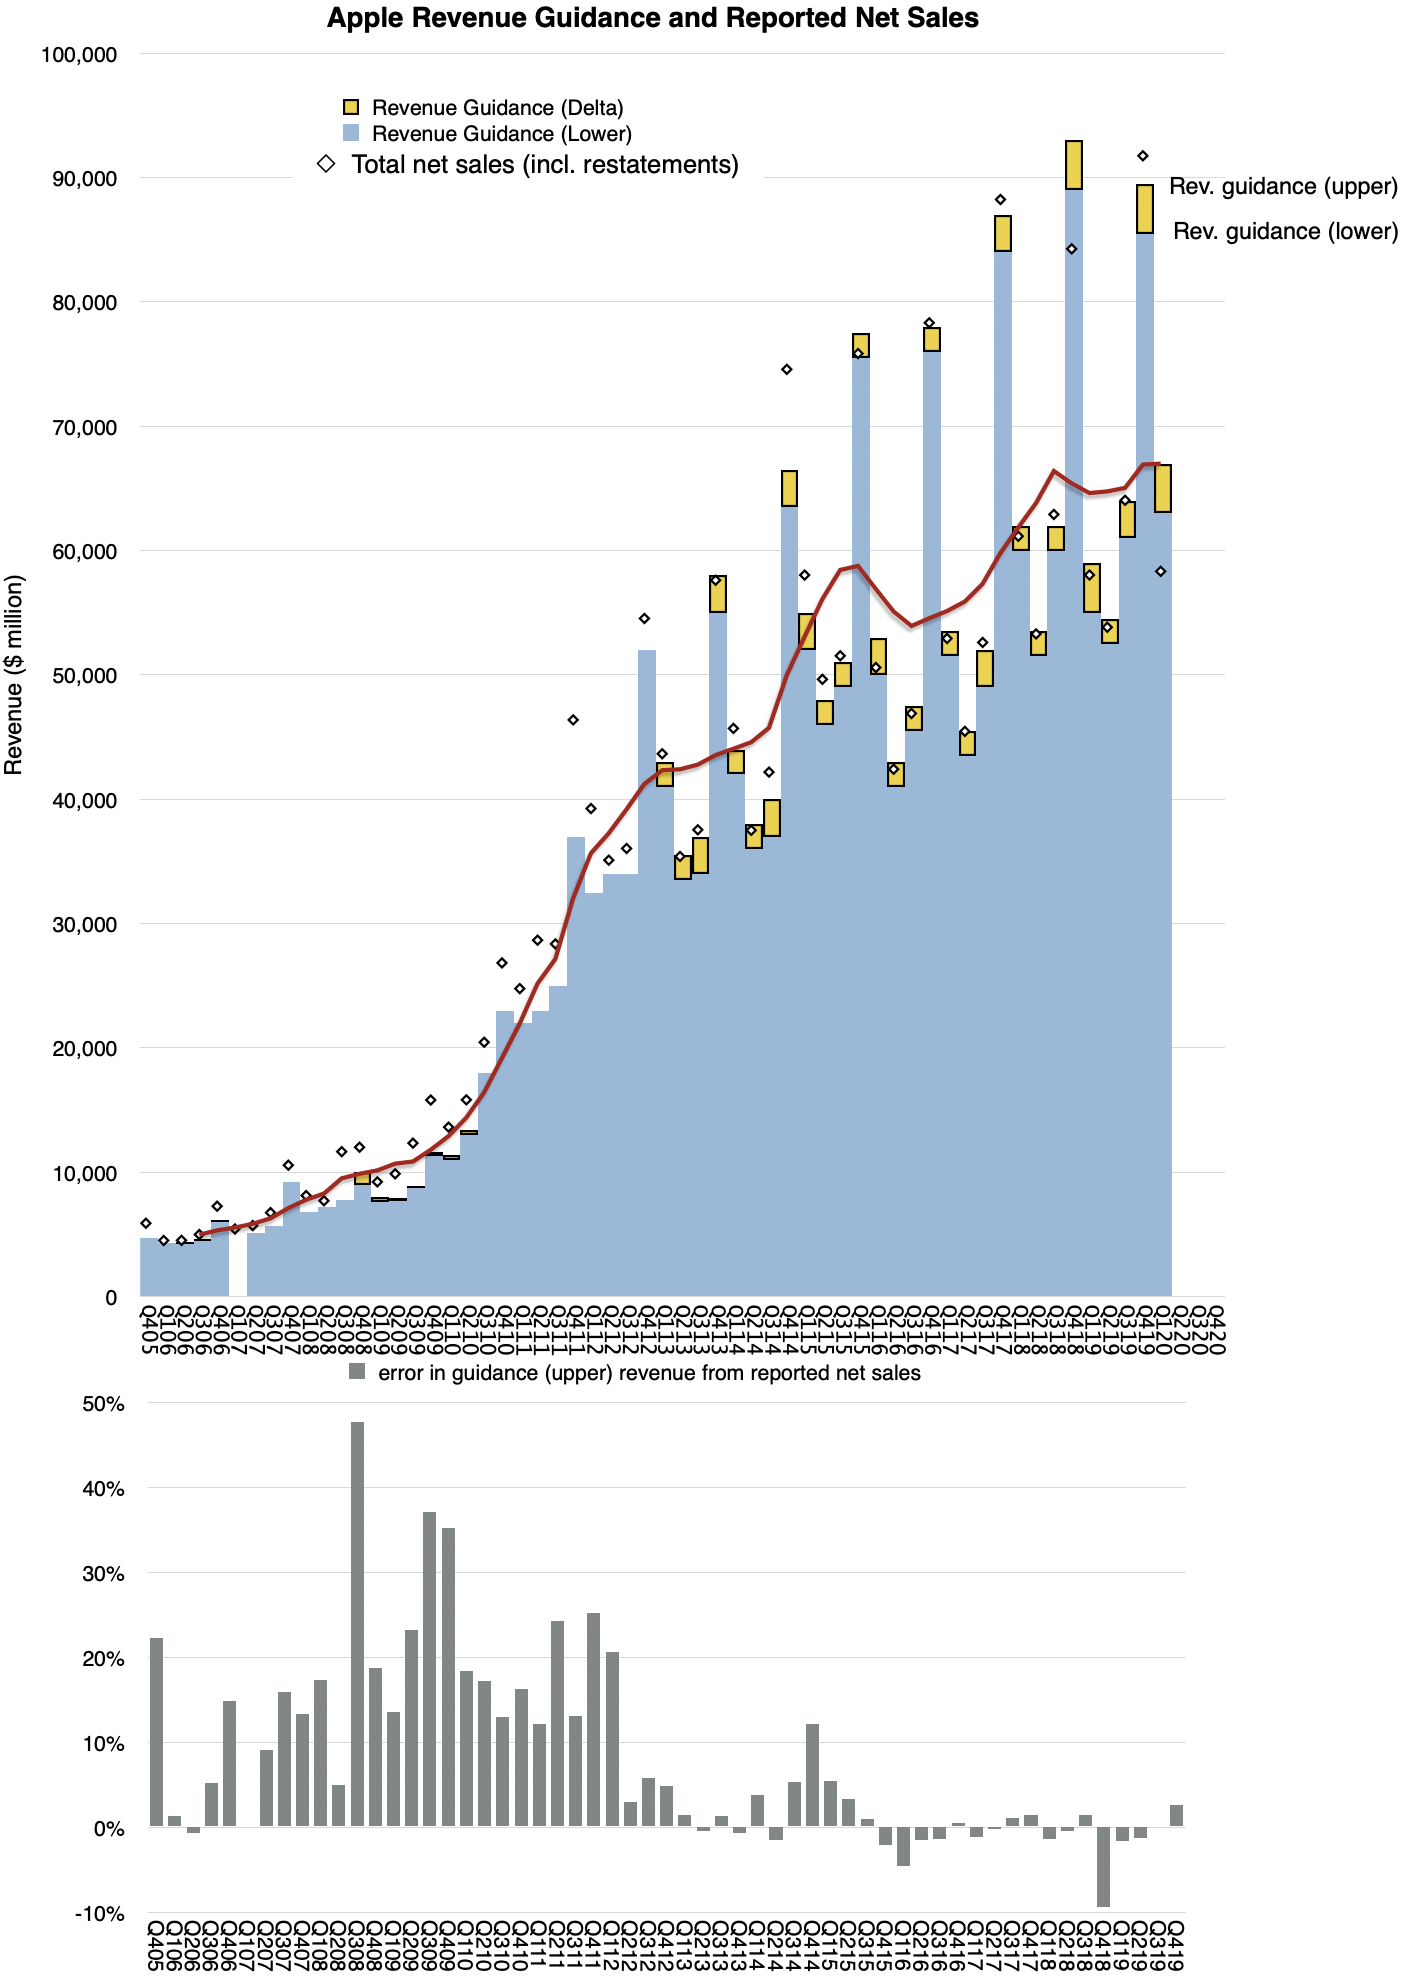
Rumors point to a split iPhone launch across two quarters, a folding model priced above the Pro Max, and the first break in the pricing cadence charted in the stairway to heaven. Any of these leaves management a dilemma: accurate guidance tips their hand, withheld guidance signals a miss. The next few quarters will be different and transitory while the fundamentals get stronger. The reporting will be all over the place and the negatives will overwhelm reason. Don’t be fooled. →
Nota Bene
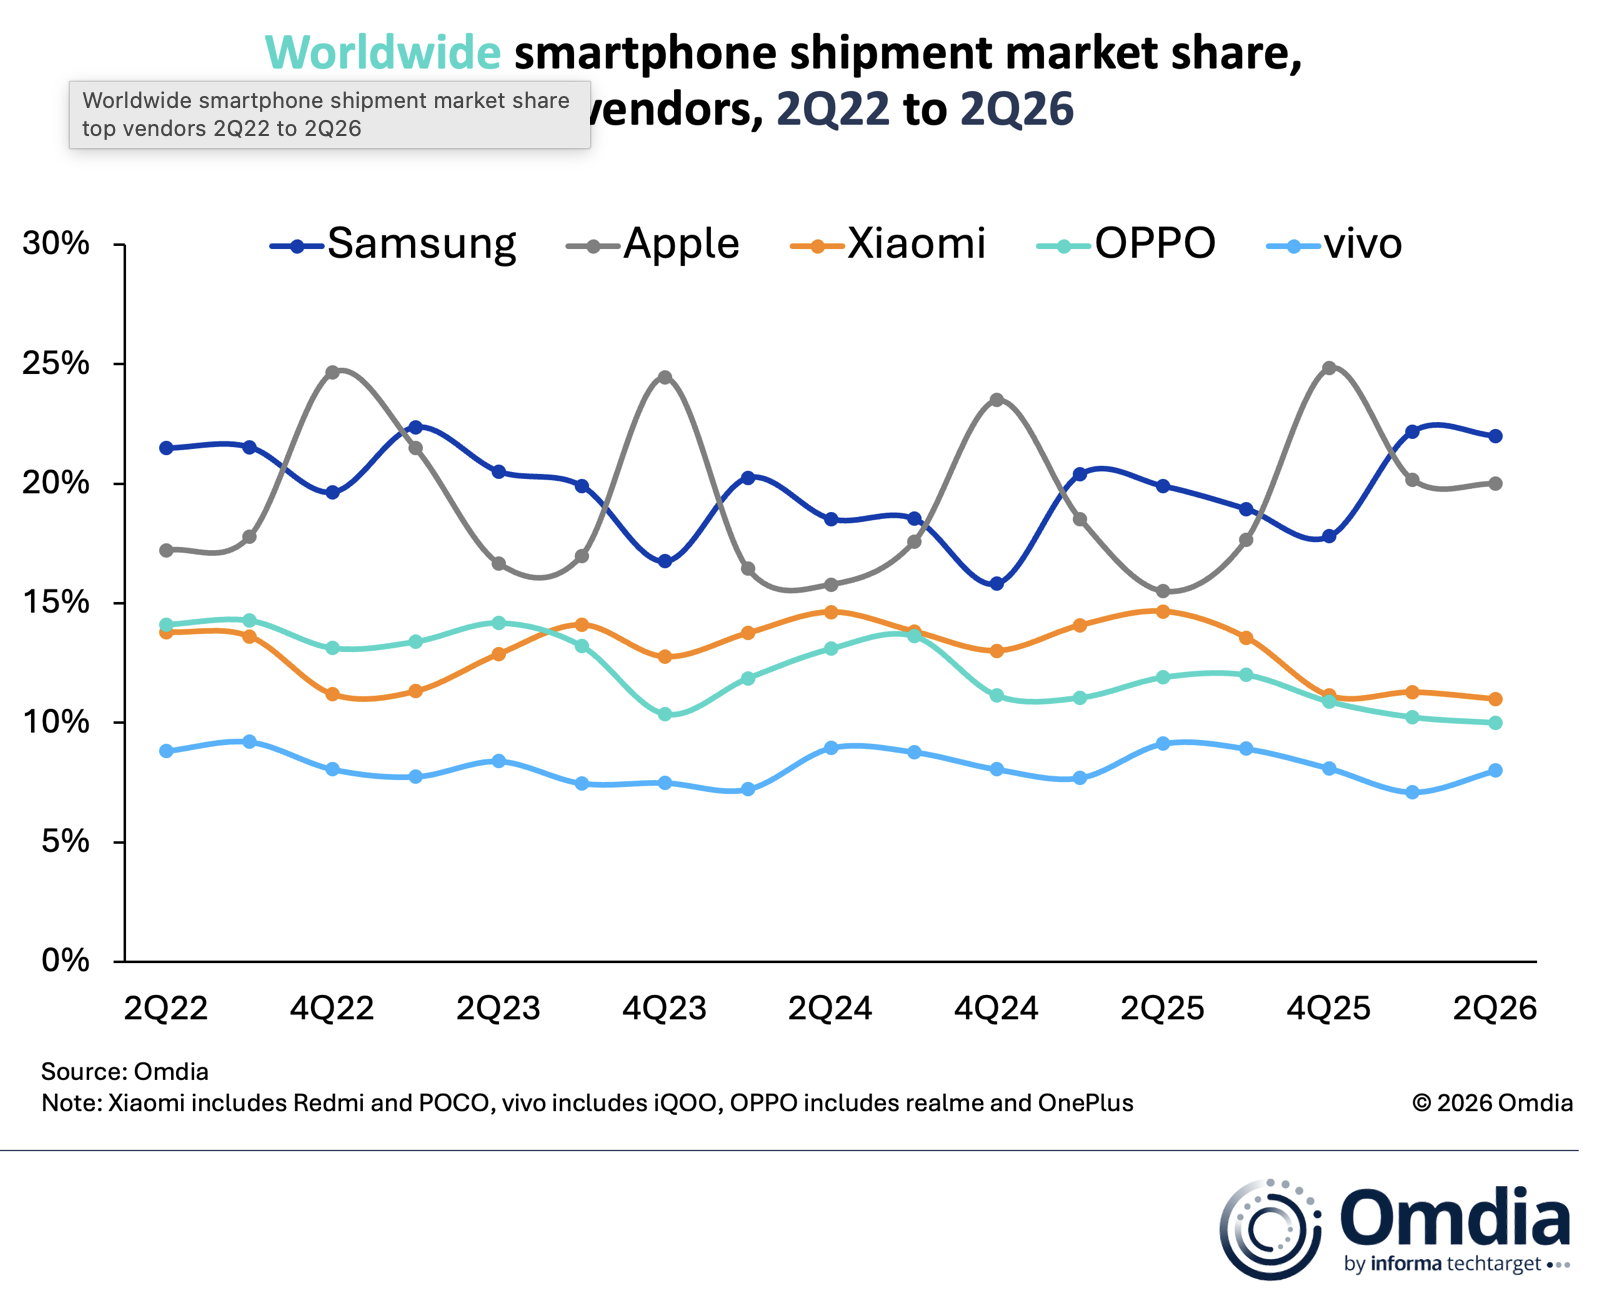
Omdia: Global smartphone market down 4% in 2Q26 while Apple and Samsung soared → Omdia has the market down 4% in the second quarter while Counterpoint has sales down 11%, and either way Apple hit a record 20% share in its slowest quarter. The steepest drops are in the sub-$400 segment, where memory is now over 60% of the bill of materials. Xiaomi, OPPO and vivo all fell steeply on rising memory prices. In a contracting market with contracting margins, Apple is moving in the opposite direction, and every crisis of the last six years ended with the business emerging stronger. →
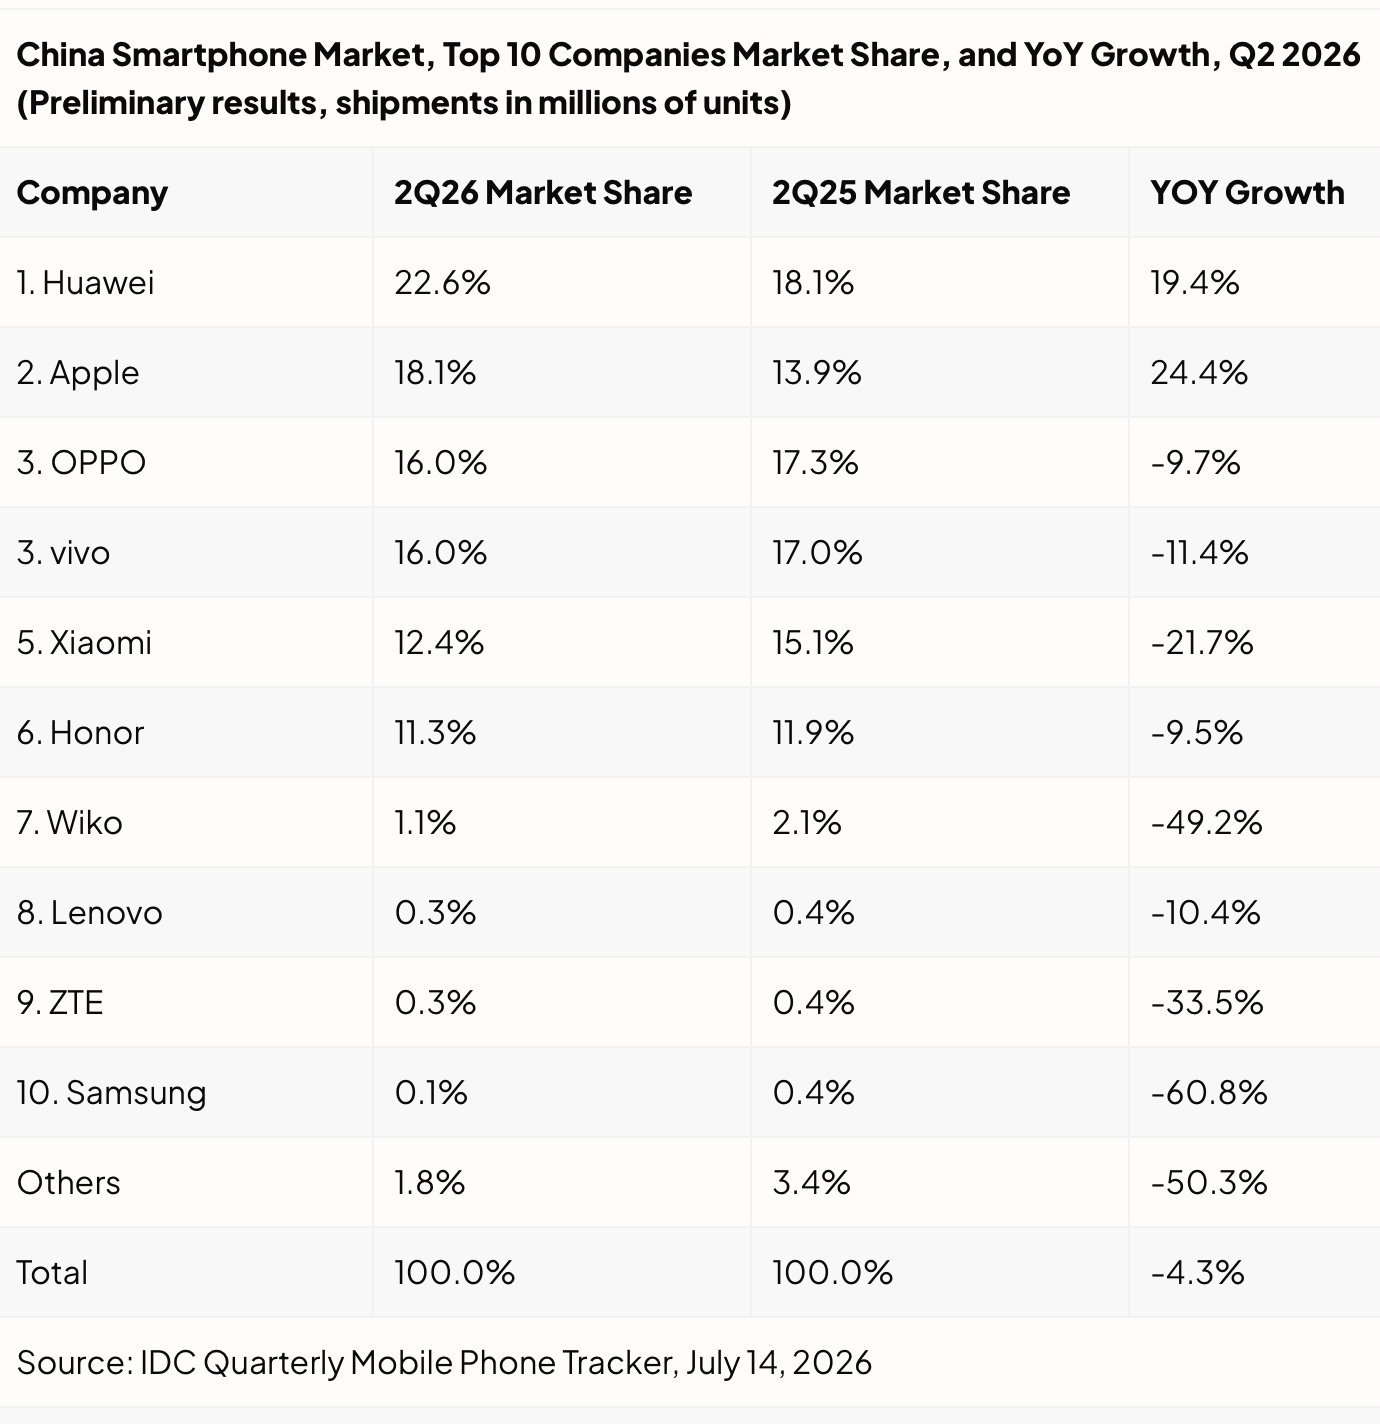
Why Huawei and Apple Grew While China’s Smartphone Market Fell Again in Q2 2026 → China shipments fell 4.3%, the fifth straight quarterly decline, while Huawei and Apple each grew about 20%. Both held prices steady as the Android field raised them, and Apple’s early signaling of second-half increases pulled buyers forward into the iPhone 17. The repetition matters less than the discontinuity: pull-forward demand and iPhone price increases collide in the holiday quarter, with the line-up probably split across two launch quarters and China likely targeted with the later one. →
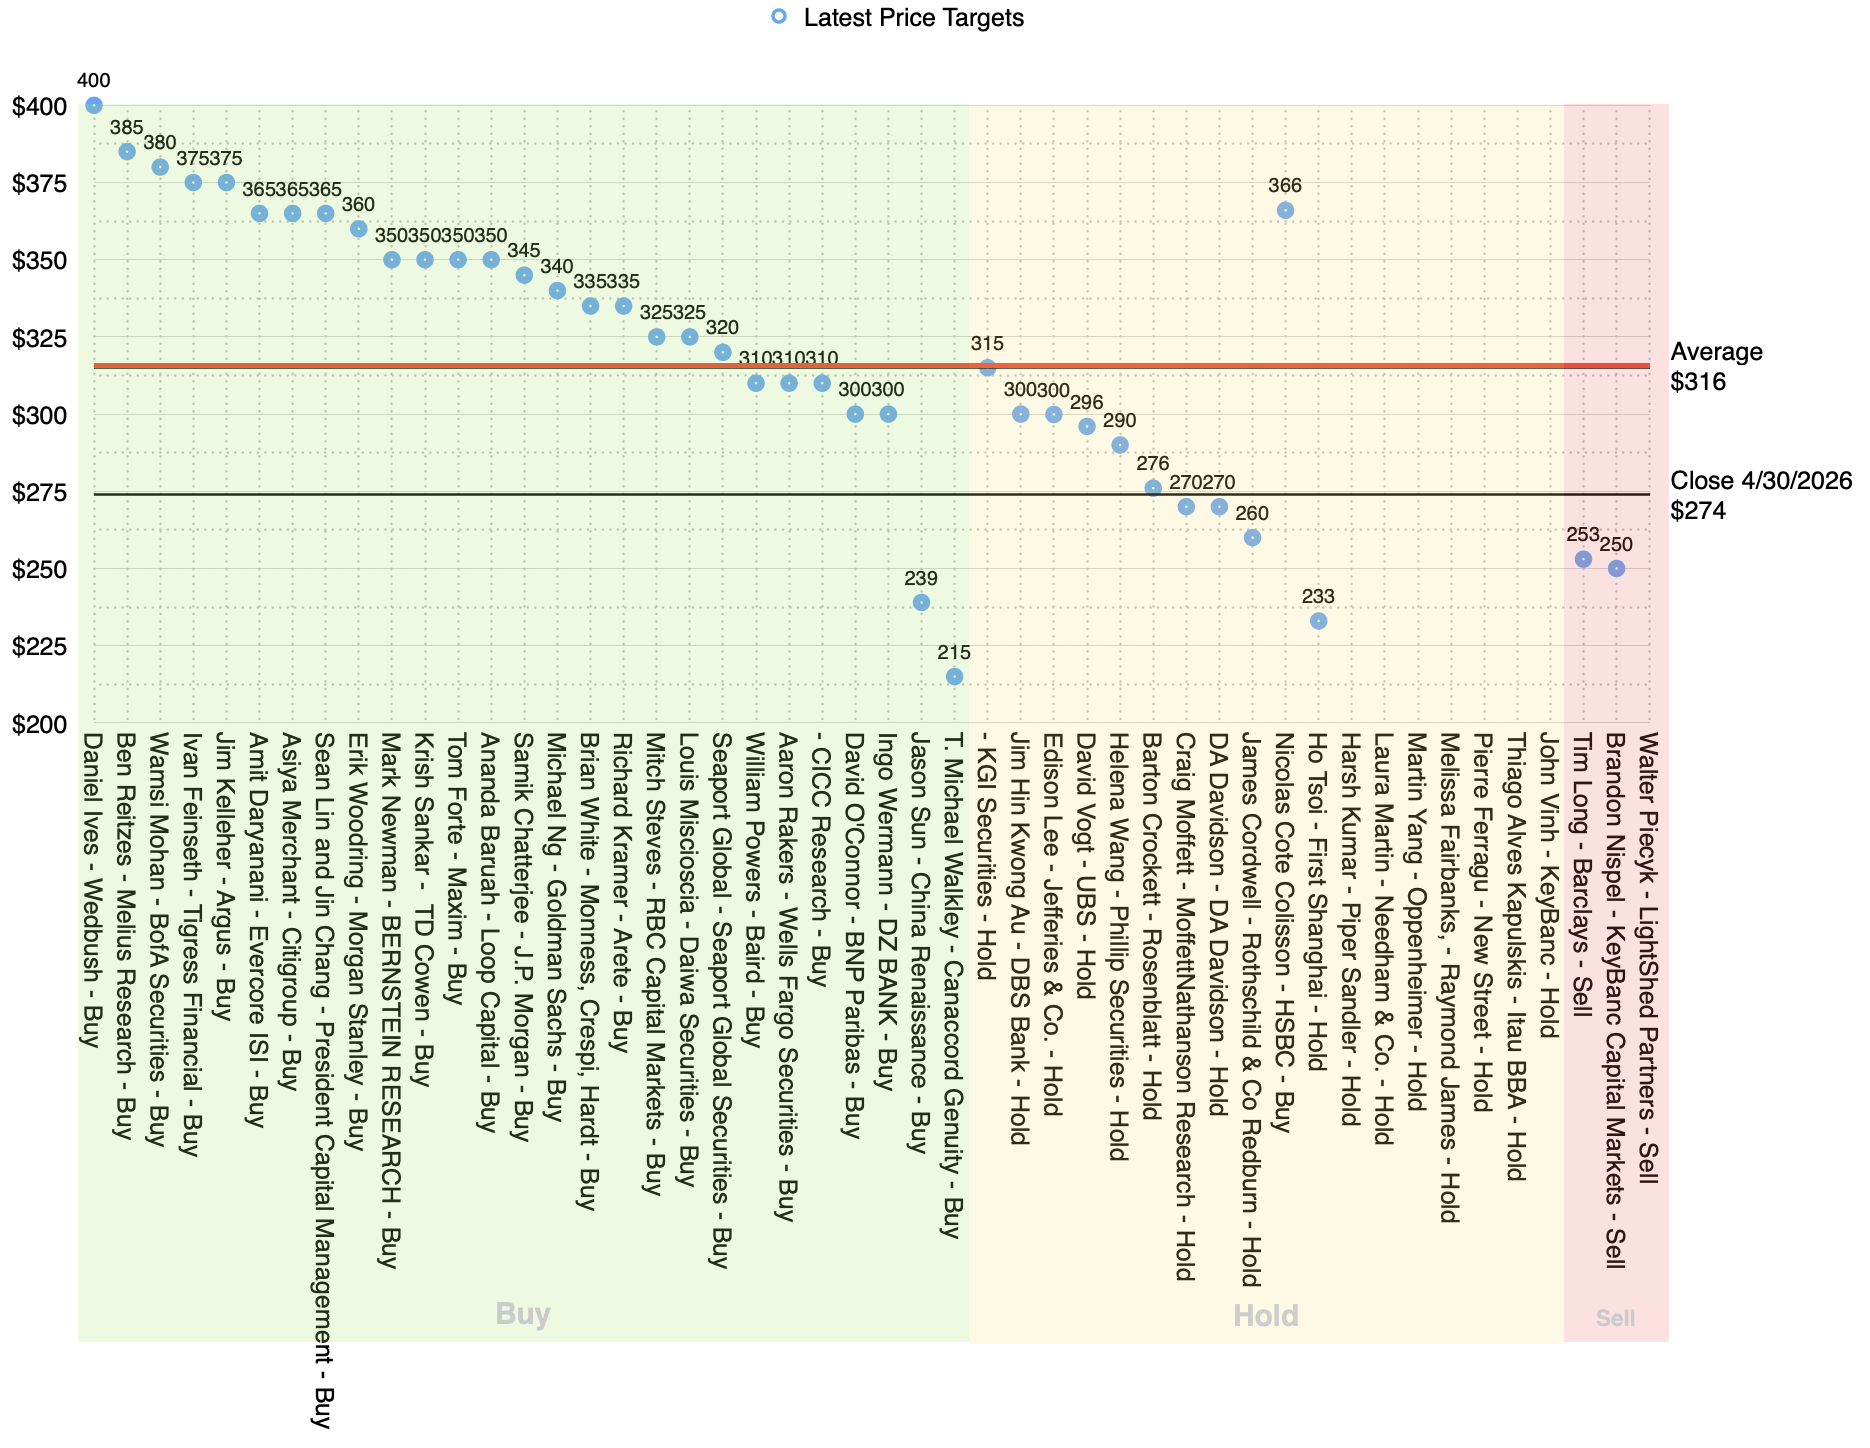
Time to Buy, Time to Sell. → HSBC flipped to Buy with a 41% target hike to $366 while KeyBanc flipped to Underweight with a $250 target on a stock at $333. By my count 28 say Buy and 20 say Hold or Sell. KeyBanc’s own record shows targets tracking results closely while rated Buy, then diverging dramatically once the rating fell. Its latest target implies a 25% drop, set the day before the shares rallied. →
Rumor has it that Apple will split the launch of the latest iPhone models across two quarters. The high-end iPhones will be announced as always, in September, but the base models will be released in the following quarter. I don't know if this is to be believed but there are other factors that might affect the next quarter that are out of the normal.
Pricing may change. Memory costs have increased so much that Apple has had to increase prices across all products apart from the iPhone. The iPhone may not be spared any longer and the normal pricing cadence may be disrupted. This cadence has been illustrated over the years as the "stairway to heaven" graph.
There might be a new form factor. Rumors are abundant about a folding iPhone being launched this fall. If true, it will probably be priced above the iPhone Pro Max given the size of the screen, battery and overall mechanical complexity. How well this product will do given the new form and new price is difficult to predict. The supply/demand balance may take some time to optimize.
Normally i don't use rumor information as it's easily corrupted, however in this case the confluence of multiple factors could cause a disturbance in the usual reliability of guidance. Here's why.
If there are new products or even a split launch, the company will not pre-announce this at earnings time. These changes in the portfolio could have a significant effect on growth relative to the previous year but the reason cannot be specified. This leaves a dilemma for providing guidance. If they provide accurate but historically divergent guidance they are tipping their hand on the mix/split/pricing. If they withhold guidance to protect the launch then they might be seen as signaling a miss.
Alternatively they might not provide any guidance since they don't know the exact impact of the new mix and pricing.
Either of these changes will undoubtedly be misinterpreted or falsely attributed to declining demand for the products.
It's also possible that the new CEO will change how it communicates guidance overall. This is not unprecedented as guidance changed a few times in the last twenty years:
During Steve Jobs' time as CEO, guidance was "sandbagged" and results were far higher than predicted. (See graphs below)
Guidance on earnings was withdrawn altogether during Covid and replaced with revenue growth range, margin and operating expenses guidance (leaving the EPS as a calculation requiring a guess of the buyback rate).
Unit sales of products (and hence average selling prices) were also excluded from reporting as of 2018.
Overall, the next few quarters will be different and transitory. Products are changing, costs are changing and management is changing. However, the fundamentals are likely getting stronger. Competition will be weakened, products will be better positioned, new customers will be attracted. The reporting on this topic will be all over the place and if history is any guide, the negatives will overwhelm reason.
As we move ahead into the June quarter, I'd like to review our outlook, […]. Importantly, the color we're providing assumes that global tariff rates, policies, and their application remain in effect as of this call [and that] the global macroeconomic outlook does not worsen from today.
We expect our June quarter total company revenue to grow by 14%-17% year-over-year, which comprehends our best view of constrained supply. On iPad, keep in mind, we face a difficult compare driven by the launch of the A16-powered iPad in the prior year.
We expect services revenue to grow at a year-over-year rate similar to what we reported in the March quarter after removing the favorable year-over-year impact from foreign exchange tailwinds. Keep in mind, during the March quarter, FX was a 2.5 percentage point tailwind to the total company growth rate, and for services, that impact was slightly more favorable.
We expect gross margin to be between 47.5% and 48.5%. We expect operating expenses to be between $18.8 billion and $19.1 billion. We expect OI&E to be around $250 million, excluding any potential impact from the mark-to-market of minority investments, and our tax rate to be around 17%. - Kevan Parekh, CFO
Apple will report results on July 30th. We will conduct Office Hours to discuss them the next day. In anticipation, here are my estimates:
The revenue guidance of 14% to 17% follows a 16.6% increase in the previous quarter. My estimate is growth of 15.9% consisting of the following segments:
iPhone +21%
Mac +15%
iPad -3%
Services +16%
Wearables +4%
My gross margin estimate is 48.5% based on the following segments:
iPhone 38.2%
Mac 31%
iPad 26%
Services 77%
Wearables 41.8%
My estimate for operating expenses is the maximum of the range ($19.1 billion.) OI&E is set at the same level as guidance ($250 million) and the tax rate also set at the estimated 17%.
I expect the number of outstanding shares to decrease by 74 million to 14.625 billion. This is a reduction in the rate of re-purchase from the previous quarter's 80 million and the average over the previous 4 quarters of 83 million. This is due to higher share pricing.
As a result of these estimates, the fully diluted Earnings Per Share should be $1.93, a 23% increase from the prior year. Trailing 12 months' EPS would thus be $8.63, with a corresponding trailing P/E of 38.6 at the closing price last Friday.
My estimates were made soon after the May conference call quoted above.
Has something happened since to change these estimates?
The biggest concern is the increase in memory pricing which would have a direct impact on margins. Especially on Mac, iPad and Wearables. Less so on the iPhone as that supply is provisioned and priced well in advance.
I suspect that management factored in all the data known one month into the second quarter and that any changes in memory pricing that forced a price increase to be announced in July would not have affected June and July Mac and iPad inventory. For this reason I'm still comfortable with what the company guided for the June quarter. There might even have been some pull-forward of demand across all hardware lines as the channel began anticipating a price increase. Anecdotally, we saw Amazon and other big retailers running summer sales even after the price increases were announced. This implies channel inventory was quite high heading into July.
To summarize, I'm not worried that there will be a margin miss this quarter but there might be a significant reduction in margin into the next quarter's guidance. Margins are currently at record levels (48%!).
A reduction to 45% into the next quarter would not be surprising.
The September quarter will be minimally affected by the new iPhone relative to the December quarter but it might signal how iPhone margins will change.
Low 40% range will be a possibility into CQ4 though that depends on what iPhone pricing changes we will see. I still expect approximately a $100 increase across the board on iPhone. $200 is where the worry lies.
The next Asymco Office Hours Live Q&A will be on Friday, July 31st at 12pm ET / 9am PT, the day after Apple’s fiscal Q3 2026 Earnings Call on Thursday. Horace will review the results and their implications, and we will take Q&A from our live audience.
Tim Long of Barclays Bank has an underweight (Sell) rating on Apple shares. Apple shares have just hit an all-time high. Perhaps he's right. Perhaps one should sell high.
The problem is that Tim Long has had a sell or hold rating on Apple for many years. As far as my data shows, Barclays downgraded Apple shares to a "hold" equivalent on February 20, 2014. In that instance, Barclays analyst Ben Reitzes shifted his rating from "overweight" to "equal weight" due to expectations that upcoming hardware products would not be enough to further move the needle. More recently, on January 2, 2024, Barclays analysts further downgraded Apple shares to "underweight" (a sell equivalent).
Ben Reitzes with Barclays Capital today stripped away his Overweight rating on shares of Apple (AAPL), a rating he's had for a decade, while maintaining a $570 price target, writing that the various products that one can imagine from the company — a smart watch, or a television set — won't be enough to move the needle, so to speak, for the company.
The price target in February 20, 2014 was set to $570 which, accounting for a 7 to 1 spent in June 9, 2014 and 4 to 1 in August 31, 2020, would be $20.39 today (On February 20, 2014, the date of the new $20 target and downgrade, Apple shares closed at $16.54. A year later the shares were $28.77.)
Thus the recommendation from Barclays has been to sell low for 12 years.
Let's dig in.
Nearly a year ago, on August 1st, 2025 Barclays adjusted their price target on Apple to $180 From $173. Today the share price is around $317. We still have a few weeks before August 1st so there is time for the price to fall to $180, however, here are additional 30 price targets set by Barclays and the corresponding price of shares a year later allowing us to evaluate performance:
Date of Target Set
Target
Price one year later
Error
4/30/25
$173
$271
-56.8%
1/31/25
$197
$270
-37.1%
1/22/25
$183
$248
-35.7%
11/1/24
$184
$269
-46.2%
8/2/24
$186
$203
-9.3%
7/24/24
$187
$214
-14.3%
5/3/24
$165
$199
-20.5%
2/2/24
$158
$228
-44.3%
1/2/24
$160
$243
-52.1%
11/3/23
$161
$222
-37.9%
10/30/23
$166
$234
-40.8%
8/4/23
$167
$209
-25.3%
4/26/23
$149
$170
-14.0%
2/3/23
$145
$188
-29.4%
1/11/23
$133
$186
-39.5%
11/7/22
$144
$182
-26.3%
10/28/22
$156
$170
-9.2%
10/10/22
$155
$178
-15.1%
7/29/22
$169
$196
-16.2%
7/13/22
$166
$191
-14.8%
4/29/22
$167
$170
-1.6%
3/11/22
$170
$150
11.5%
1/28/22
$169
$143
15.4%
10/29/21
$145
$153
-5.8%
7/28/21
$142
$157
-10.8%
5/19/21
$134
$137
-2.5%
4/29/21
$138
$158
-14.2%
1/28/21
$136
$170
-25.2%
1/14/21
$116
$173
-49.2%
10/30/20
$100
$149
-49.0%
The graph version of this data is shown below:
Today is shown with a vertical line.
The graph speaks for itself. The average error is 30%. The worst is 57%. Putting aside the gross failure in setting targets, the most curious aspect of this coverage is that the price targets are trending upwards quite consistently while the ratings are coming down.
Since the Sell->Hold downgrade in 2014, and the subsequent downgrade (Hold->Sell) a decade later, the targets offered by the same analysts have increased from $20 to $253 today (+1,165%).
The targets have increased while the rating has decreased. You were told to not buy at $16 then continue not to buy until you are told to sell because the shares are going to $160 and then sell again because they are going to $250. This is simply contradictory.
The only way to accept the raising targets while maintaining a hold/sell rating is by arguing that all previous ratings and targets are moot and should be ignored. But if you suggest ignoring your own commentaries over 12 years published in over 100 reports reiterating your position then your own recommendation is to ignore what you say.
How long does an analyst insist on being ignored?
The key thesis was resting on a comparison with Microsoft. It might be worth re-reading: "Microsoft hit an all-time high market cap of about $620 billion in late 1999 as it was obvious its business model that bet on industry standards was the clear winner in the PC/Internet revolution. In August 2012, Apple beat Microsoft's record of the most valuable company when shares rose past the $660 level and shares continued to rise to an all time high past $700 just after the launch of the iPhone 5 with a market cap of about $650 billion as investors assumed Apple was the clear winner in the mobility revolution.
The point is that the most dominant tech leaders of their era don't necessarily just regroup from these types of peaks and re-assume a new all-time high market cap after a year or two. They may get usurped in the ensuing decade or two. These observations are easier to see in hindsight – but it shows how hard it is to get to this type of size and stay there, much less regroup – and rise above it again […] Both companies seem to have been re-rated as investors ascribe little probability to a next "big thing" after a series of attempts to reclaim past glory.
Apple now trades at 12.7x consensus 2014 estimates – down from its P/E of 15.9x in October 2012. Microsoft traded around 20x in 2004 after a strong rebound in 2003, but its multiple has settled in the mid-teens since that time. We don't see evidence that suggests Apple has another product as material as the iPhone or iPad in the pipeline. We are not arguing the nominal multiples here – but the rate and sustainability of the new contracted multiple from peak is worth noting. Once the market decides that your main product will remain slow for a long time, there does seem to be a visible pattern for multiples to sustain lower levels for a long time even if revenues grow –as was the case with Microsoft."
Asymco Bulletin is a digest of all the work we have published for the week ending Jul 19, 2026. Posted on July 20th.
July Office Hours
Asymco Office Hours Live Q&A — Friday, July 31 → The next Asymco Office Hours Live Q&A will be on Friday, July 31st at 12pm ET / 9am PT, the day after Apple’s fiscal Q3 2026 earnings call on Thursday. Horace will review the results and their implications, and we will take Q&A from our live audience. Asymco One subscribers are guaranteed seats, can bring a guest, and will have access to the live recording.
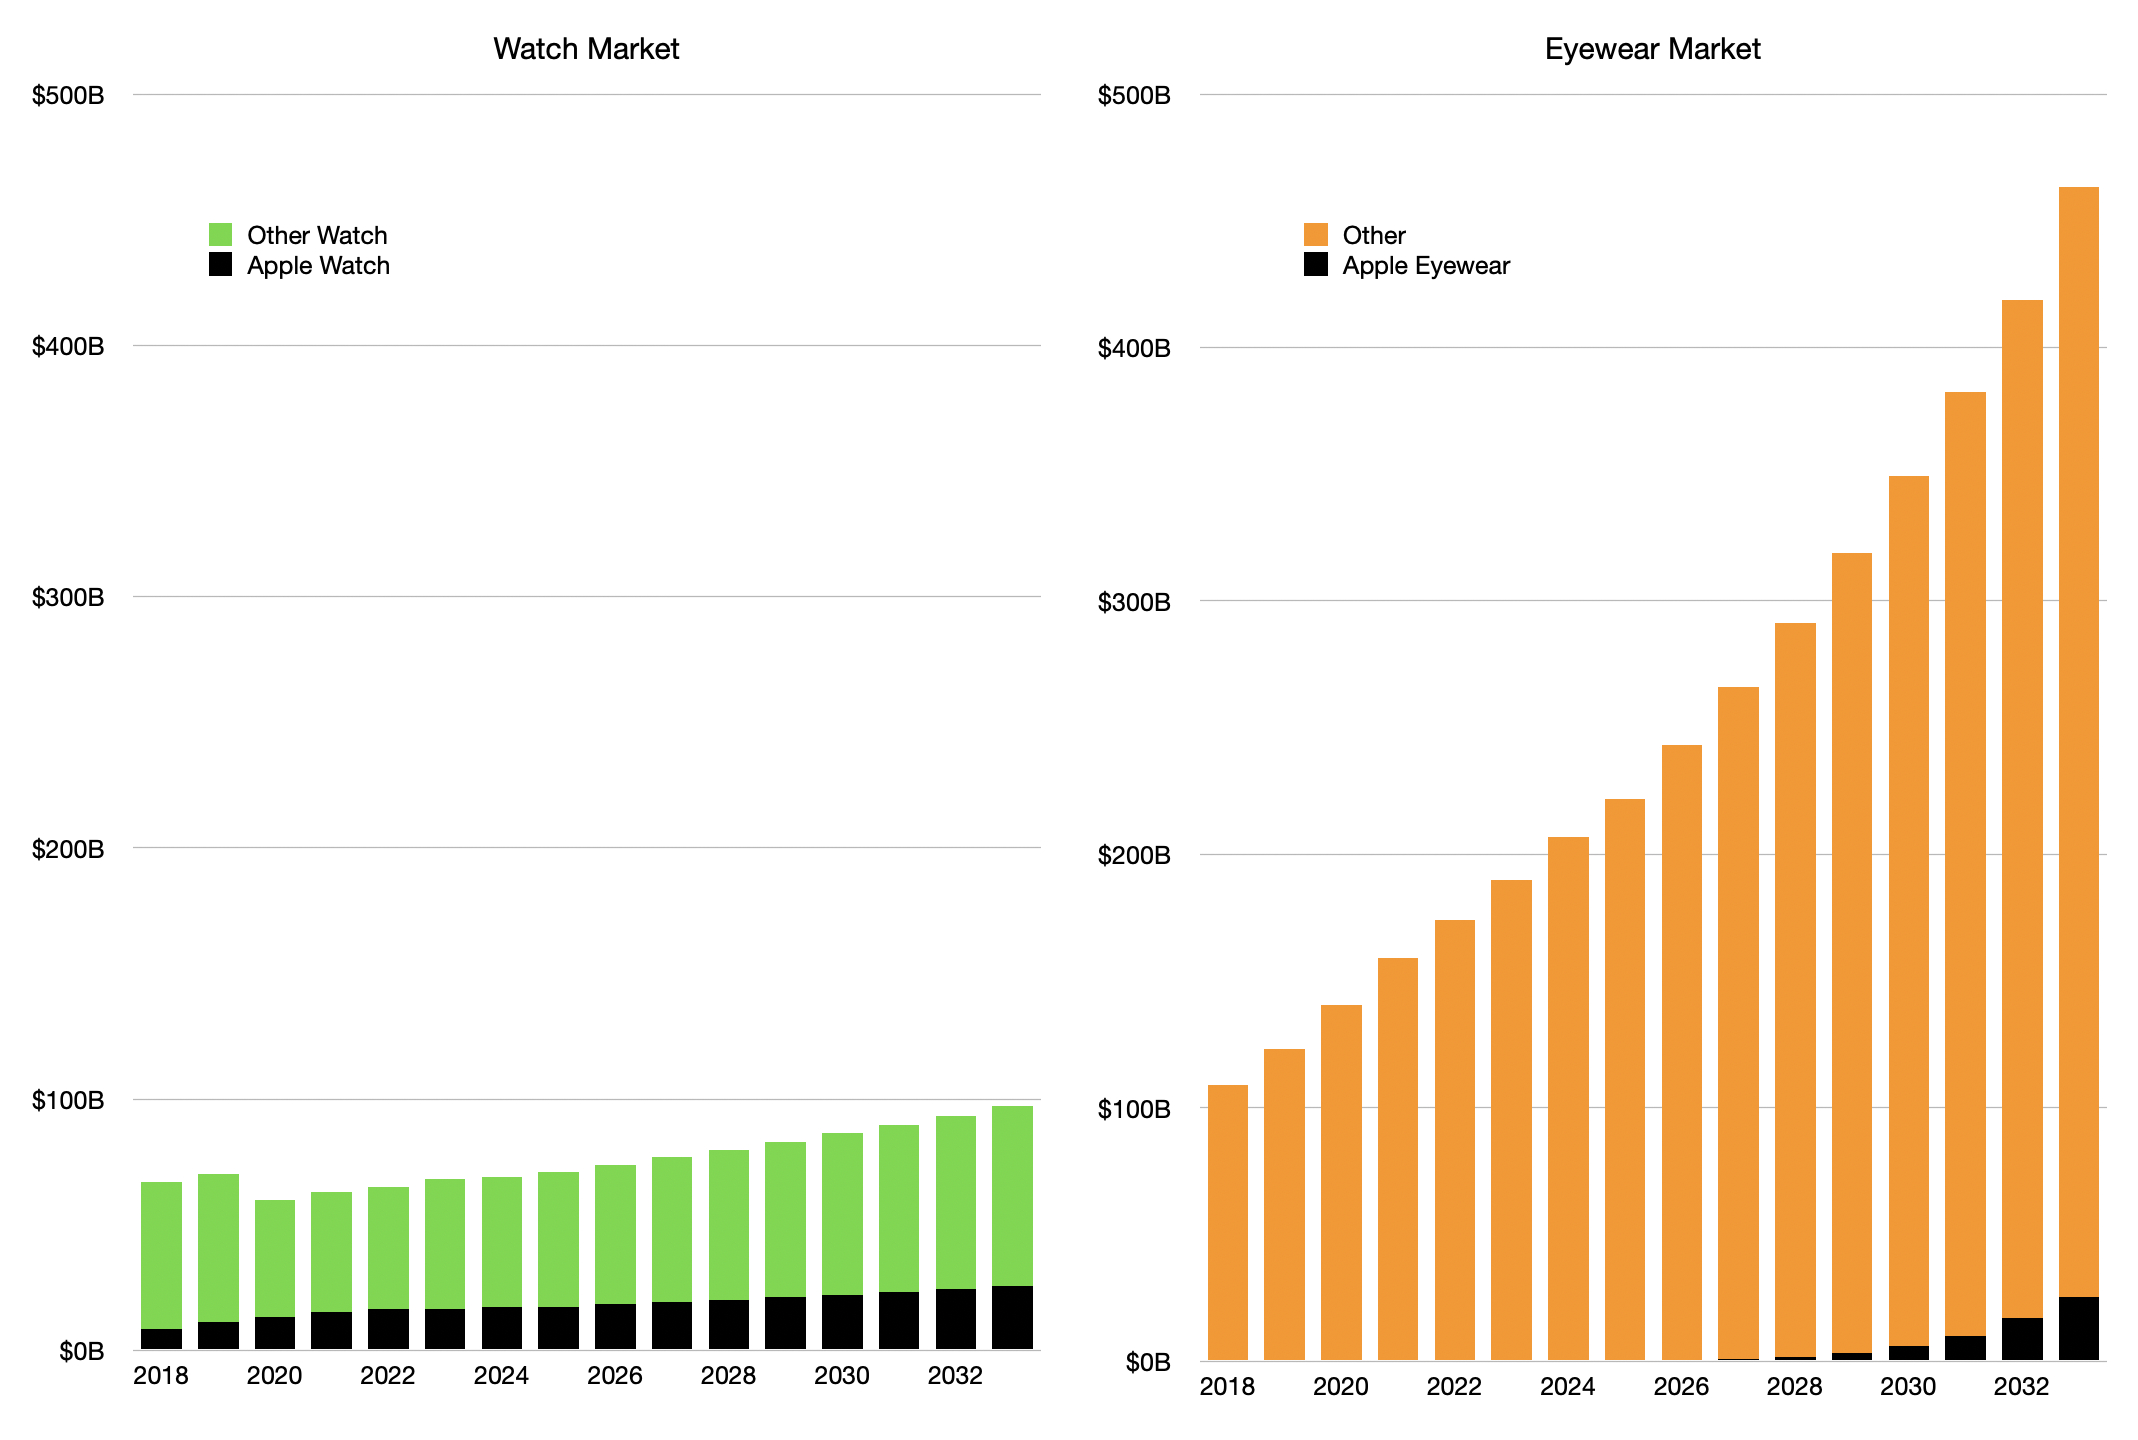
When Essilor merged with Luxottica in 2018 the eyewear market was $100 billion. In 2021 it was $150 billion. Last year it was $220 billion, this year it’s estimated at $245 billion and in six years, $463 billion. Much of this growth is due to increases in the Asia Pacific region with 11.5% CAGR. The growth is due to improving competitiveness with non-consumption through expanding distribution, mainly through retail and e-commerce. Technologies such as virtual try-on are enhancing accessibility, personalization, and purchasing experiences. Aging populations are also boosting demand for prescription eyewear. Focusing on the buying experience and addressing new users are evolutionary steps but changes in the product itself are an emerging revolution. Injection of software into what has been a purely passive optical object will change how we see the world. →
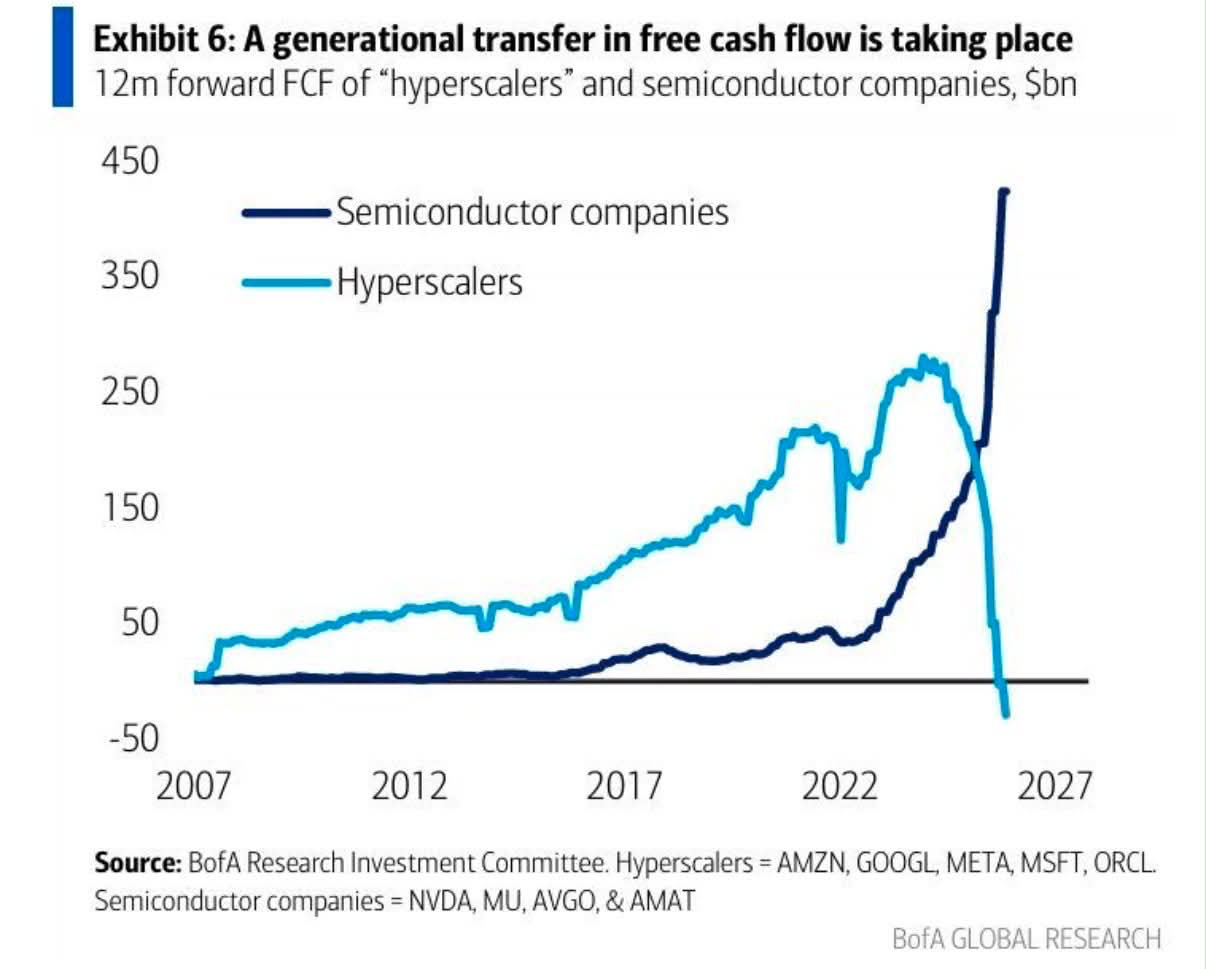
The graph above shows that Amazon, Alphabet, Meta, Microsoft and Oracle decided to transfer their shareholders’ wealth to the shareholders of Nvidia, Micron, Broadcom and Applied materials. The transfer is real since the capital expenditures undertaken with this cash flow by these “hyperscalers” have gone directly to create unprecedented windfall profits for semiconductor companies. The scale is astonishing! These companies alone are taking hundreds of billions out of their owners' pockets. I ask why this is happening and, even more curiously, why is there a rush by all companies to do this. All but one that is. →
Nota Bene
No one admits they like or want to buy more AAPL → Apple hit an all-time high as investors went looking for a hedge against everyone else’s AI spending. The setup is almost funny: Meta, Oracle and Amazon are burning cash to build data centers, while Apple is expected to throw off $143 billion in free cash flow with capex falling. Its edge-AI approach, running models on the device, turns the absence of a frontier model into the whole thesis. The analysts calling it a boring defensive name are the ones who missed it. →
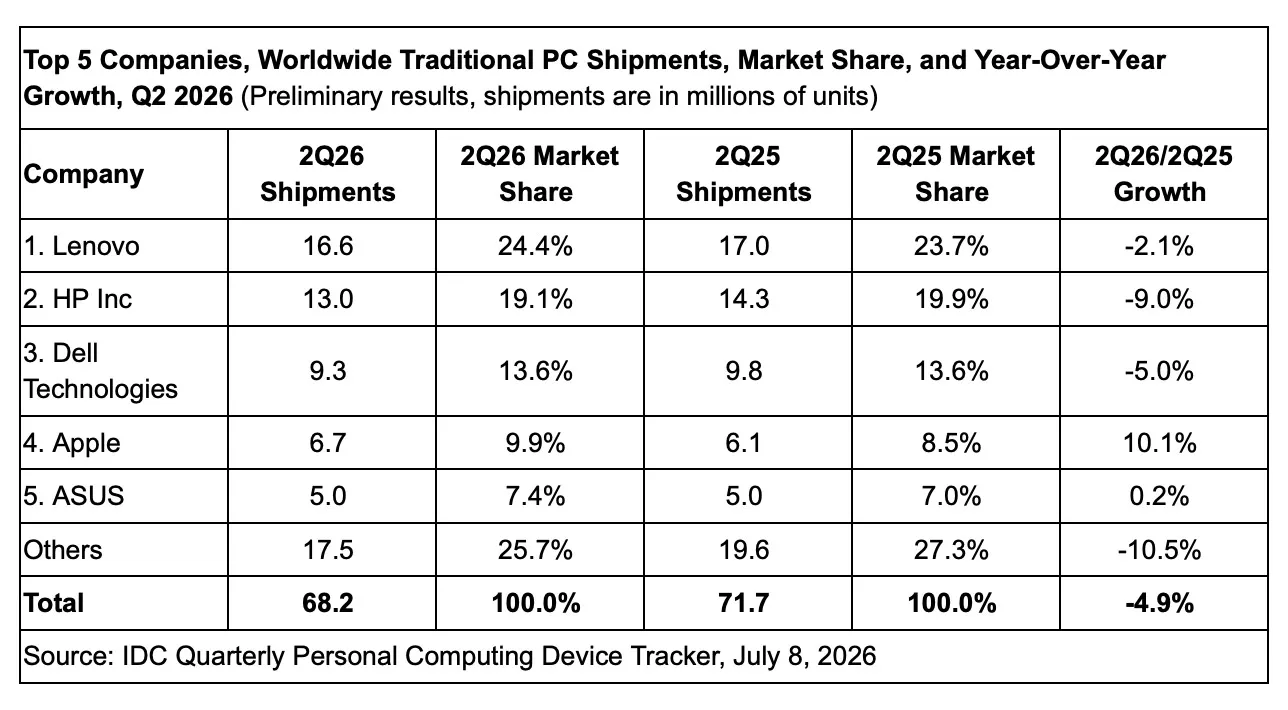
Worldwide PC market update Q2 2026: Omdia and IDC → The PC market shrank about 4 percent while Apple grew, up 16 percent by Omdia’s count and 10 percent by IDC’s. Apple was lifted by the MacBook Neo, placing Dell now within reach. Units are falling while revenue climbs, because everyone is pushing through 20 to 40 percent price increases on the memory crunch. →
Why doesn’t anybody copy Apple? → Everyone copies Apple’s products; almost no one tries to copy its operating model, which is the thing that actually matters. OpenAI poaching Apple people is the first real attempt I have seen to reconstruct that model, and I don’t think they have their priorities straight. Jobs said anyone you removed from Apple would be useless on their own, and they are about to prove him right. →
JP Morgan raises Apple stock price target by $20 to $345 → JP Morgan lifted its Apple target to $345, arguing the memory-driven cost increases are a short-term worry and that iPhone, Mac and iPad volumes have shown little relationship to price over the years. Mac looks the most insulated, helped by AI-led demand.. →
Citi hikes Apple price target by $50 to $365 → Citi cited Apple’s share gains in falling smartphone and PC markets and its power to raise prices mid-quarter. It expects further increases at the September launch, weighted to the high end, plus a foldable iPhone late in the year. Even with the raise the average target is below the market where the shares set a fresh all-time high above $323, running out ahead of the very analysts chasing them. →
Game Over. Remember Consoles? → A PlayStation reader poll had nearly half of respondents considering a jump to PC, put off by the end of physical games and the prospect of a $1,000 PS6. Reader polls are unreliable, with selection bias and complaints crowding out the satisfied. The real signal is elsewhere: consoles have been under disruption pressure for years, and Microsoft is now cutting thousands from Xbox. I called this more than a decade ago, and the game is still ending. →
When Essilor merged with Luxottica in 2018 the eyewear market was $100 billion. In 2021 it was $150 billion. Last year it was $220 billion, this year it's estimated at $245 billion and in six years $463 billion.
Much of this growth is due to increases in Asia Pacific with 11.5% CAGR. The growth factors are improving competitiveness with non-consumption through expanding distribution mainly through retail and e-commerce. Technologies such as virtual try-on are enhancing accessibility, personalization, and purchasing experiences. Aging populations are also boosting demand for prescription eyewear.
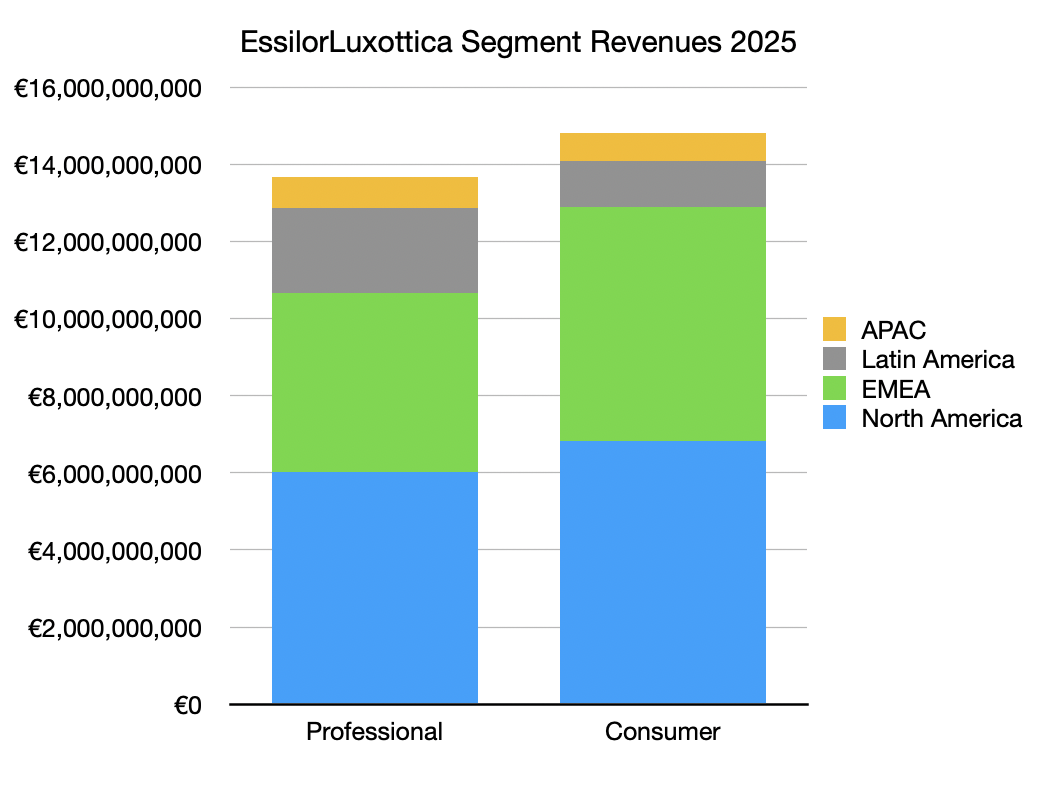
EssilorLuxottica (EL) is an interesting case study as it represents a significant share of this total market. It’s also a useful proxy because it has a large overlap with segments Apple might target. EL operates in 150 countries, offers 150 brands, introduces 3500 eyewear models new every year, and has over 600 production facilities & optical labs. It sells 113 million prescription frames, 97 million non-prescription frames and 755 million solid and 79 million contact lenses per year. It distributes through 300k optical partners, 20k stores, 89 eye clinics and serves 500 million customers.
Through this, in 2025 it generated 28.5B€ revenues, at 16% gross margin, 11% net margin. Geographic segment revenues are shown below.
Additional consumer categories: 70% Prescription, 21% sunglasses, 6% AI glasses, 3% Apparel. In terms of consumer 77% is sold through Brick and Mortar retail.
There is a demographic overlap with Apple though they are far weaker in Asia (6% consumer sales). Distribution is also very fragmented as are its brands. Consumer sales are about $17B which I estimate is about the same as Apple Watch revenues.
On a unit basis i estimate that the wholesale average revenue per frame is $100, average revenue per lens pair is $50 and retail margins at 50% put average selling price per glasses of $300. Price ranges vary widely from $50 to $5000. The $300-$500 segment is expected to record the fastest growth from 2025 to 2030. This price structure allows the entry of a software-enabled frame+lens that is priced at what consumers are willing to pay but adding significant functionality—as long as style, aesthetic and social standards are met.
This suggests a similar opportunity for Apple to the watch market: approach the mid market and push incumbents into either low end or very high end while iterating rapidly on function and design.
Unlike the watch market, however the eyewear market is far bigger and growing much faster.
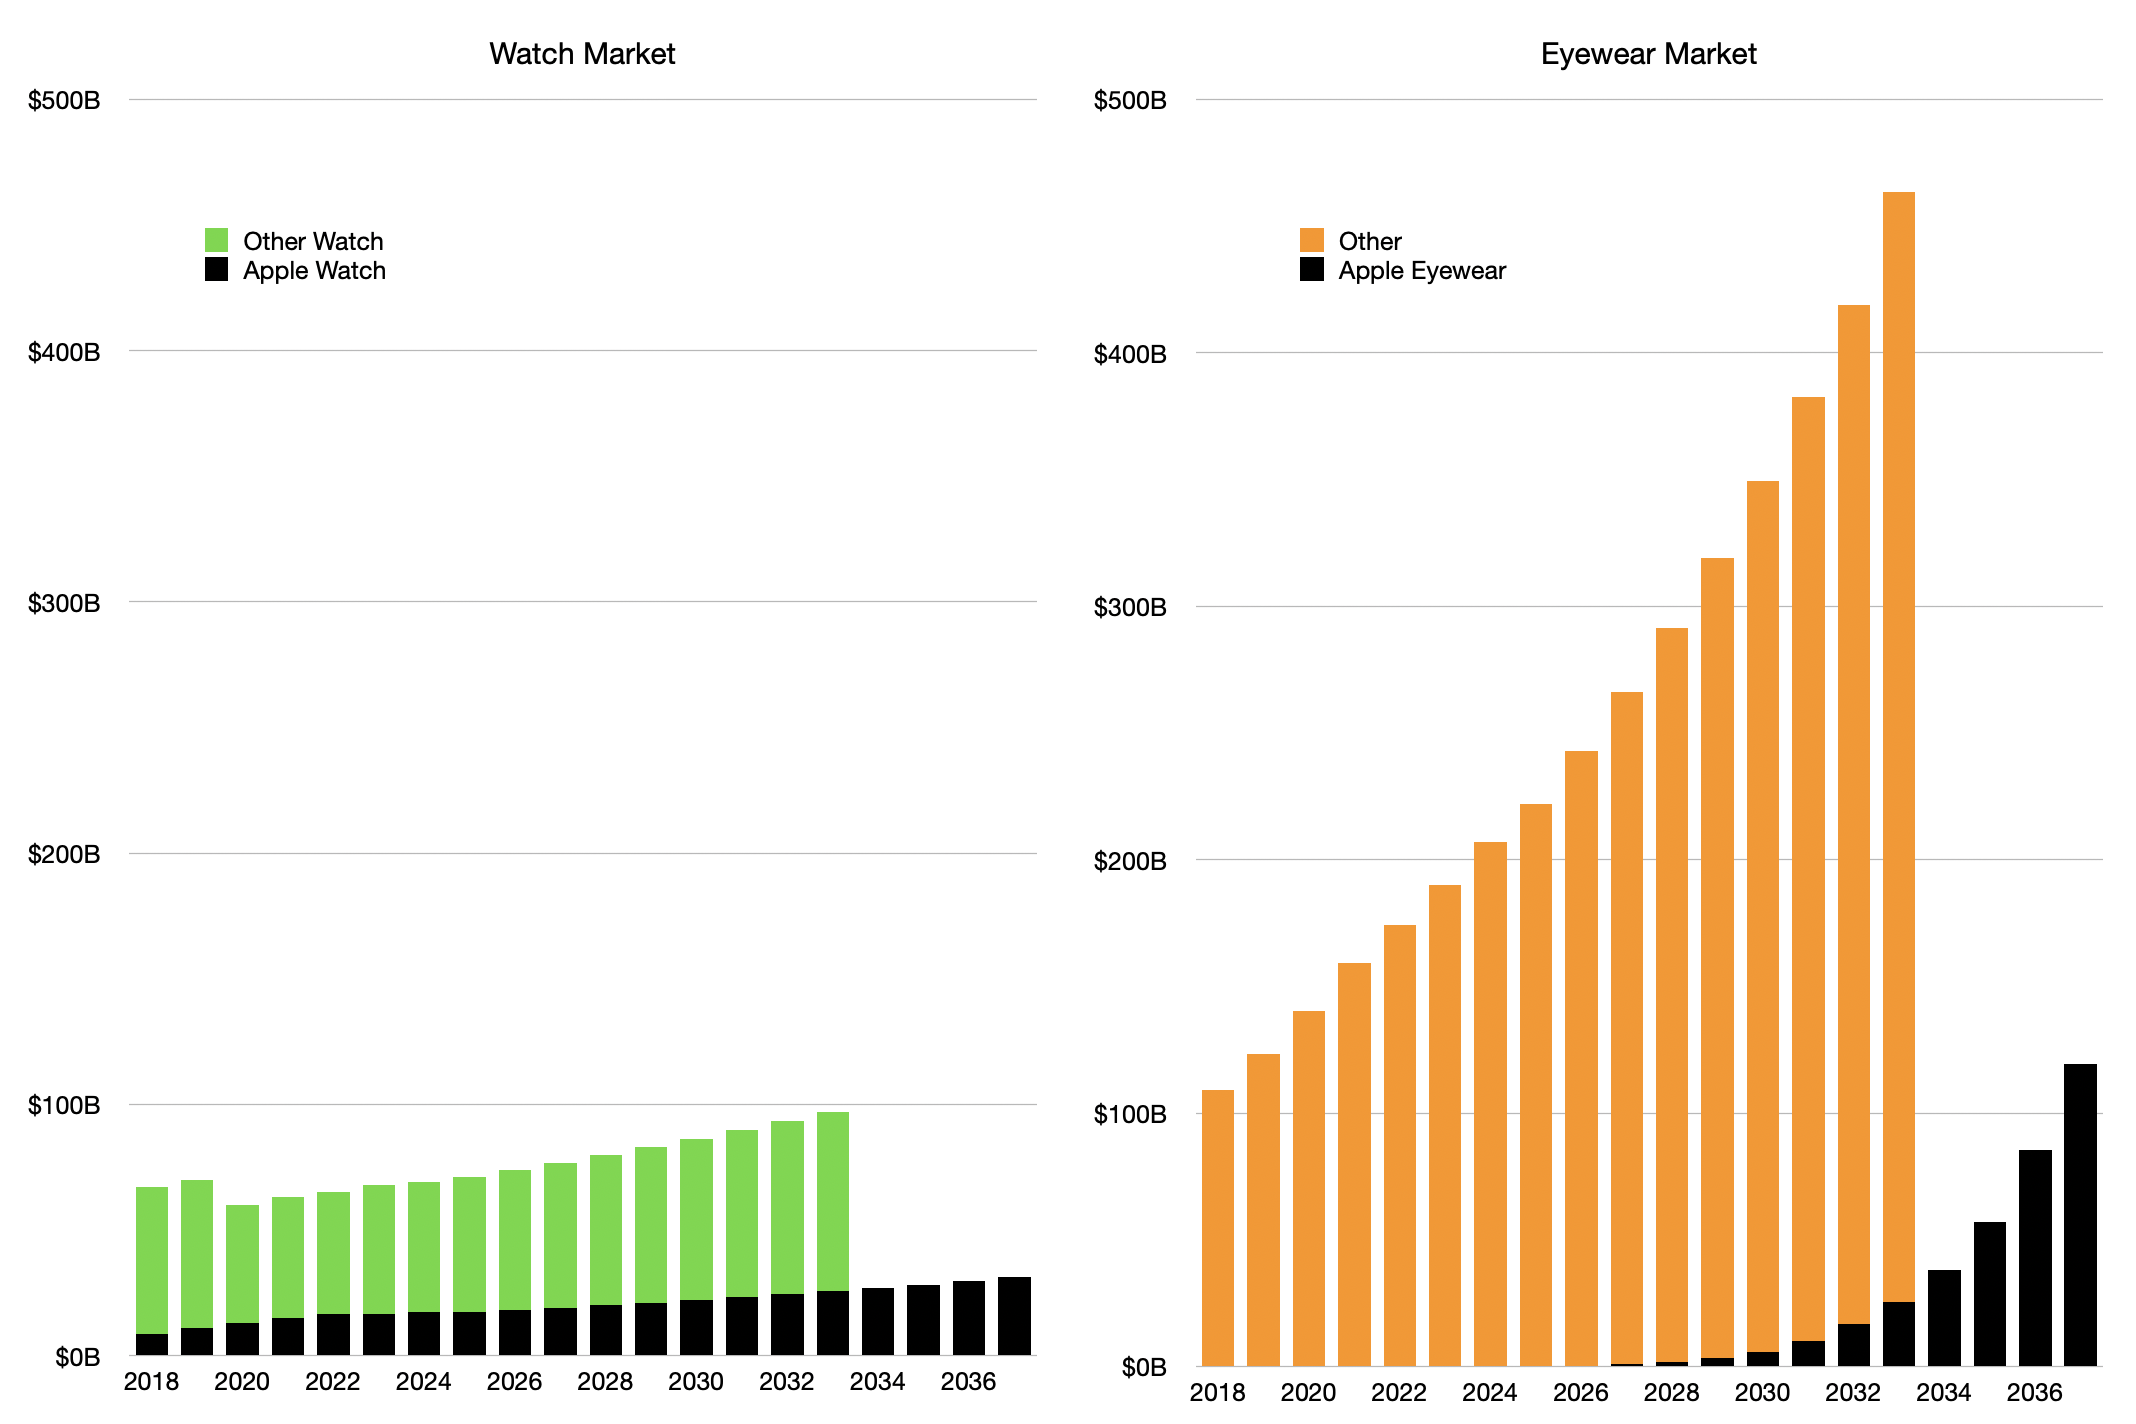
My estimates for both the watch market and the eyewear market (2018 to 2033) including Apple's share is shown below.
This scale suggests Apple eyewear could reach to be the same size as the Apple Watch by 2033 and each would be worth about $25 billion/yr.
By then Apple's share in the watch market would be about 25% but only 5% of the eyewear market. A substantial headroom exists where Apple eyewear could reach as much as $100 billion/yr.
This is one of the reasons Spatial Computing is so strategic. By the time this opportunity arrives, vision computing technologies will allow the injection of software into eyeglasses that would solve incremental problems for many users on a continuous basis. We call this jobs-to-be-done and as display, input, and capture/sensing data will flood into the eyewear product, consumers will find new jobs to hire the products to do.
Overall Wearables should growth from $18billion/yr. today to $115 billion by 2035 sustaining a 20% compounding growth rate.
One important aspect here is not just competition with new features but with new customer experiences: virtual try-on, personalization, and purchasing options. The fact that 80% of the market is still brick-and-mortar and requires typically multiple visits is archaic. In addition there are many non-consumers. There is non-consumption for people who do not have an eye refractive condition (myopia, hyperopia, presbyopia), i.e. children and there are the underserved who may be unwilling to obtain glasses.
The conversion of 2.2 billion un-served is also worth considering1. When Apple watch arrived, many people had stopped wearing watches since timekeeping was always on their phones. The watch became an accessory to the phone and adoption increased. The same might happen with Apple eyewear. "Eyespace" is perhaps the most interesting and important wearable space after all.
In 2018, an estimated 2.5 billion people, mostly in India, Africa, and China, lack access to eye tests and spectacles. This “visual divide,” as NGOs call it, is a significant global issue. Myopia and presbyopia, common in developing countries, are linked to high road deaths, low educational achievement, and poor factory productivity. Eye-health campaigners refer to it as the world’s largest untreated disability.
To see the future of wearables, I said look to where jewelry has been worn. The places where people trust metal against skin is where compute inevitably will reside. The categories are easily found. Head/Hair -> AirPods/Beats Arms -> Watch Hands -> Rings Ear -> AirPods Neck -> Beats My prediction has been more or less fulfilled. Today we wear Beats, AirPods, Apple Watch and (though not Apple) rings containing microprocessors. However, what is missing from this categorization is eyewear. In How We Got to Now, Steven Johnson describes the reading lenses of medieval Europe as the first piece of technology “since the invention of clothing in Neolithic times, that ordinary people would regularly wear on their bodies.” →
Stay tuned for more on this topic in the coming weeks.
Nota Bene
Apple and Broadcom extend deal through 2031 → Broadcom and Apple extended their custom-chip agreement through 2031, and Broadcom jumped nearly 4 percent on the news. Apple is around a fifth of Broadcom’s revenue, so this is a lock-in that cuts both ways. Even as Apple designs more of its own silicon, including the C1 modem, it still leans on Broadcom for wireless and RF. The pattern is familiar: secure the supply years ahead, then decide later what to bring in-house. →
Apple destroyed the mid-tier watch market. Now it’s coming for the $200 billion eyewear industry → When Apple entered watches, the mid-tier collapsed. Swatch is down 28 percent and Fossil roughly 70 percent, and Apple now outsells Rolex by revenue. The smart glasses category already surged 167 percent, and Apple is reportedly aiming at late 2027. Eyewear is a $200 billion industry that has never faced a competitor who ships hundreds of millions of wrist computers a year. →
Office Hours
Did a lottery winner become “the company of the future”? → The Wall Street Journal put Nvidia first among companies of the future and Apple twelfth. But Nvidia’s history is a flat line and then a near-vertical one, because the matrix-multiplication chip they already made turned out to be perfect for AI. That is winning the lottery, not building a moat. They have maybe five customers, every one desperate to replace them, while Apple ships hundreds of millions of chips a year; ask where Nvidia is in a decade. →
The portability superpower → Someone asked why MLX lets you write for Apple Silicon and then move to Nvidia, a reverse Trojan horse. It fits a very old pattern. Apple has sweated portability since the Mach kernel and the PowerPC-to-Intel jump, when moving the entire OS looked impossible to everyone but them. Doing it at the level of AI chipsets is nothing new; the same instinct is why a touch-ready Mac, when it finally ships, will feel anticlimactic. →
A commodity is a product whose price does not rise when performance improves, so businesses trading in commodities compete on production and distribution rather than design. That is why Apple does not build memory: it would lock itself into its own cost structure and give up the flexibility to negotiate across vendors. Memory makers can only make money by lowering cost per bit, which they do by shrinking process nodes. Beijing spent hundreds of billions over more than a decade building strategic memory suppliers; twelve years in, that industry may only be reaching profitability because of the current imbalance. →
Nota Bene
Apple's Q1 iPhone sales in Africa grew 44% → Counterpoint Research reports Africa's smartphone shipments fell 12% in Q1 2026, hit by fuel prices, memory-driven price rises, and extreme price sensitivity. iPhone bucked the trend and grew 44%. Apple does not adapt to markets; markets evolve to become Apple markets. →
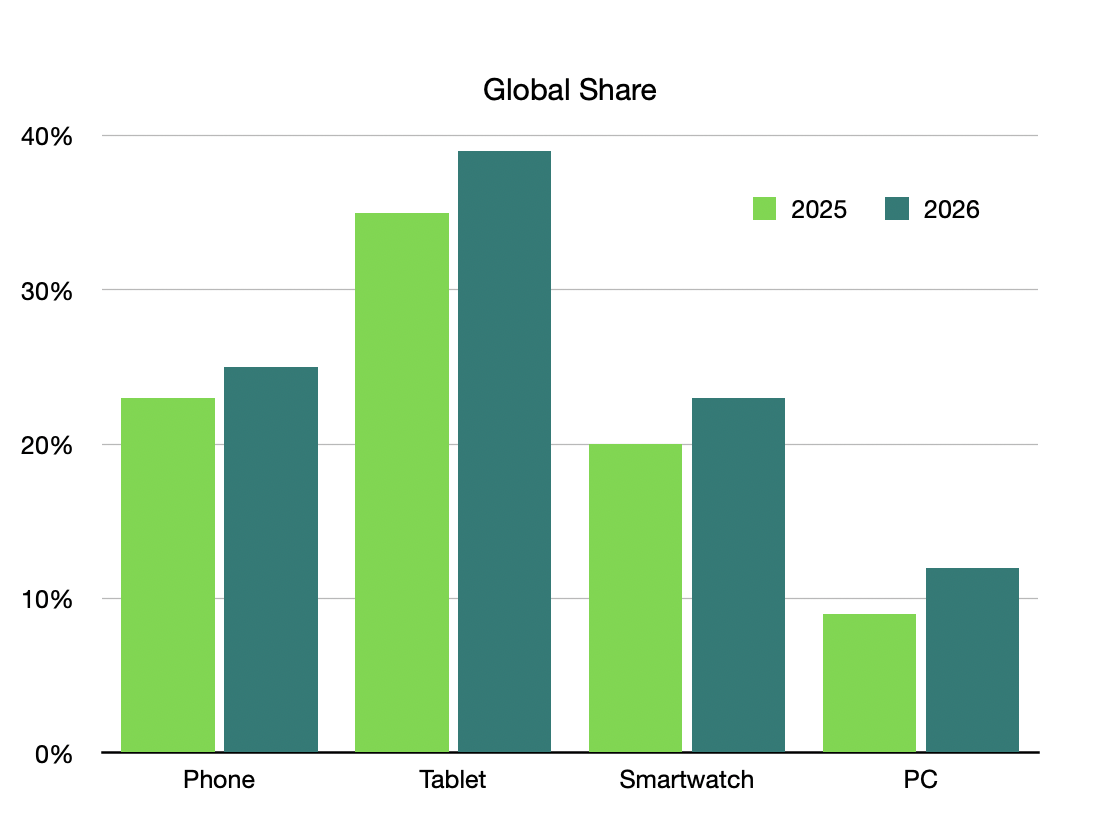
Counterpoint: Apple to Hit Record Market Shares in Smartphones, Laptops, Tablets; Watch Share Also Set to Grow → Counterpoint expects Apple to reach its highest-ever share in smartphones near 25%, plus record share in laptops and tablets in 2026, while most OEMs face double-digit declines. Stable pricing, high margins, and supply chain control let Apple weather the memory crisis best. The article predates the June 25 price increase, but the conclusion still holds. →
Office Hours Q&A
Earnings are an opinion, cash flow is a fact → Dave E. asked whether the hyperscalers face an AI bust and how Apple would adjust. There is revenue but little profit or free cash flow because everything is being reinvested. The bubble bursts only if debt gets mispriced, and so far AI has not become a debt story. →
Why is betting against Apple the extraordinary claim? → An Office Hours question about Apple's forward prospects given 26.6% CAGR over twenty years. Analysts make one-year calls swamped by short-term noise, while the CAGR reflects a decades-long trend. The extraordinary claim is that a flywheel with this much momentum suddenly stops. →
Will agents kill the app economy? → Question was: whether agentic AI would consolidate revenue to Apple and agent providers. Apple keeps trusted permissions inside apps: apps become callable APIs, Apple still hands off credentials, and the app economy lives on alongside intent, touch, and vision. →
The next Asymco Office Hours Live Q&A will be on Tuesday June 9th at 12pm ET / 9am PT. Horace will review new Apple announcements and implications, and we will take Q&A from our live audience.
A transcript of the May 1, 2026 Asymco One Office Hours, recorded one day after Apple's Fiscal Q2 2026 earnings call. Horace Dediu presents his analysis of the quarter and takes questions from Asymco One subscribers. Hosted by Horace Dediu and Farshad Nayeri.
Horace Dediu: So I'll do a short presentation, and then we're going to open it up for questions. We are speaking approximately one day after Fiscal Second Quarter 2026 earnings call. Let's dig into it and see if we can understand it even better.
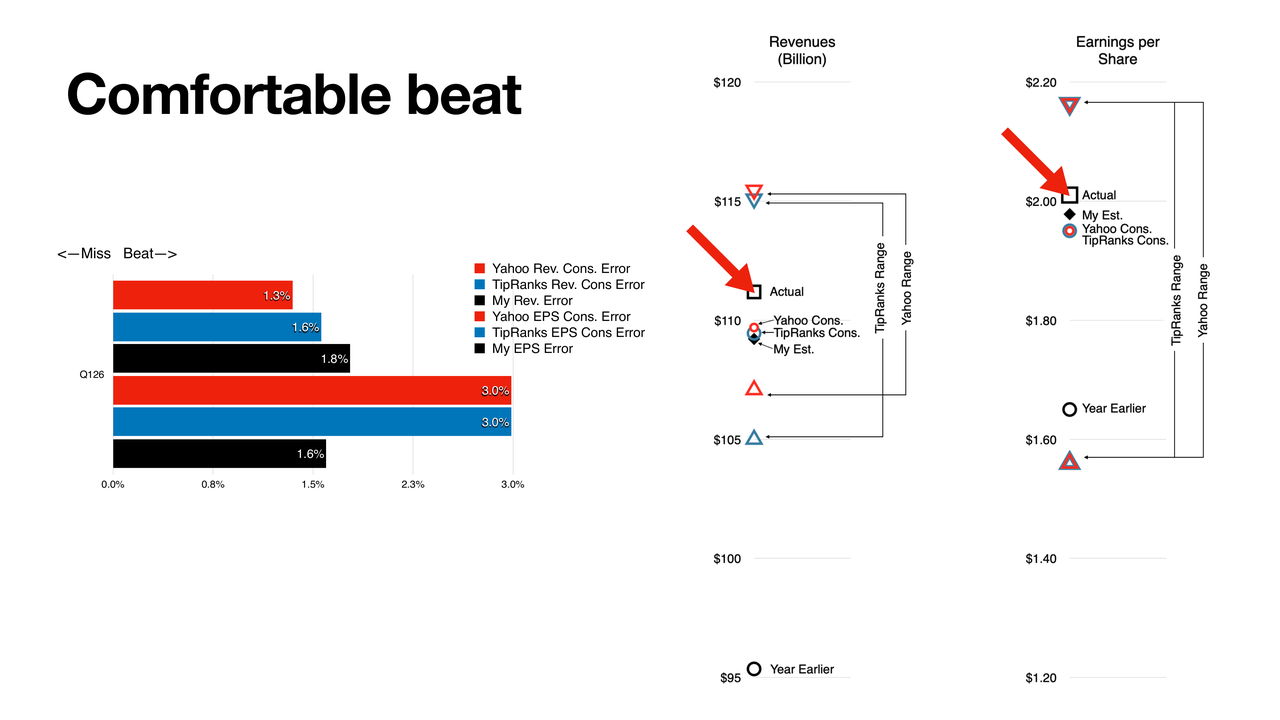
First, I think that there was a comfortable beat from already a highly elevated expectation.
So we had a range of estimates— I collected those from Yahoo and TipRanks, each one had about 30 [analysts], probably a lot of overlap between them. So we had a range of about 105 to 115 in terms of revenues in billion, and then we had EPS in a range of about 1.6 to about 2.15.
And not only did it beat the consensus, but also you can see what happened a year earlier, which is the circle at the bottom of the graph. So the beat was from already a pretty high growth rate expected from the year before.
So we have a measure of how each of us, myself included, performed relative to the actual results.
I was about 1.8% under revenues delivered, and 1.6% on EPS. And then you can see red is Yahoo and blue is TipRanks.
So speaking for myself, I was perhaps a little bit too conservative on my revenues, and I was a little bit more accurate, relatively speaking, on EPS. Roughly speaking, again, I think these are not big errors, 1% to 2%. Worst case, 3% on the consensus basis.
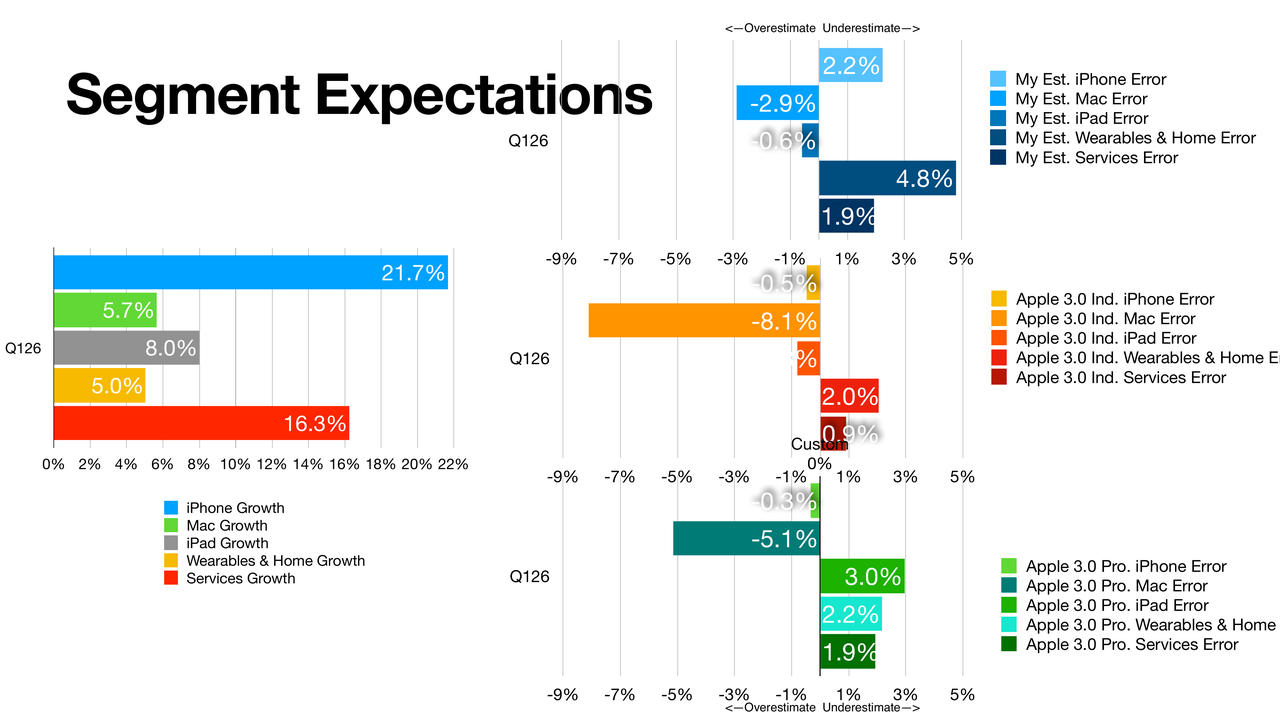
Now, on the segments, these are the actual growth that we ended up with, iPhone almost 22%, 16% on services, 8% on the iPad, which is impressive. 5.7 on the Mac, we'll talk about that a little bit, and 5% on wearables and growth.
Segment level, again, the worst case, you're looking at an 8% overestimation on the Mac. The Mac— I think a lot of people, once they saw the Neo come out, once they heard about the Mac mini stockouts, when they heard about the Claude bots, you know, everybody buying up all these Macs, there was an expectation of a big boom in the Mac, but those all happened fairly late in the quarter. My expectation was a little bit over, but not as much. I was off about 3% on that estimate. So although we saw 5.7% growth, some people expected double digits. Also, the pros had the same fault there.
Overall, though, I think these are pretty impressive. I didn't break out the geographic segments. China grew extremely well. Rest of the world, that grew very well. Management also pointed out that they're doing very well in developing markets. So overall, regionally, there were some extraordinary performances. But as we see here, just the iPhone was incredible, 22%. Very similar to performance in the previous holiday quarter, where, again, unprecedented growth, or at least in the near history of the product.
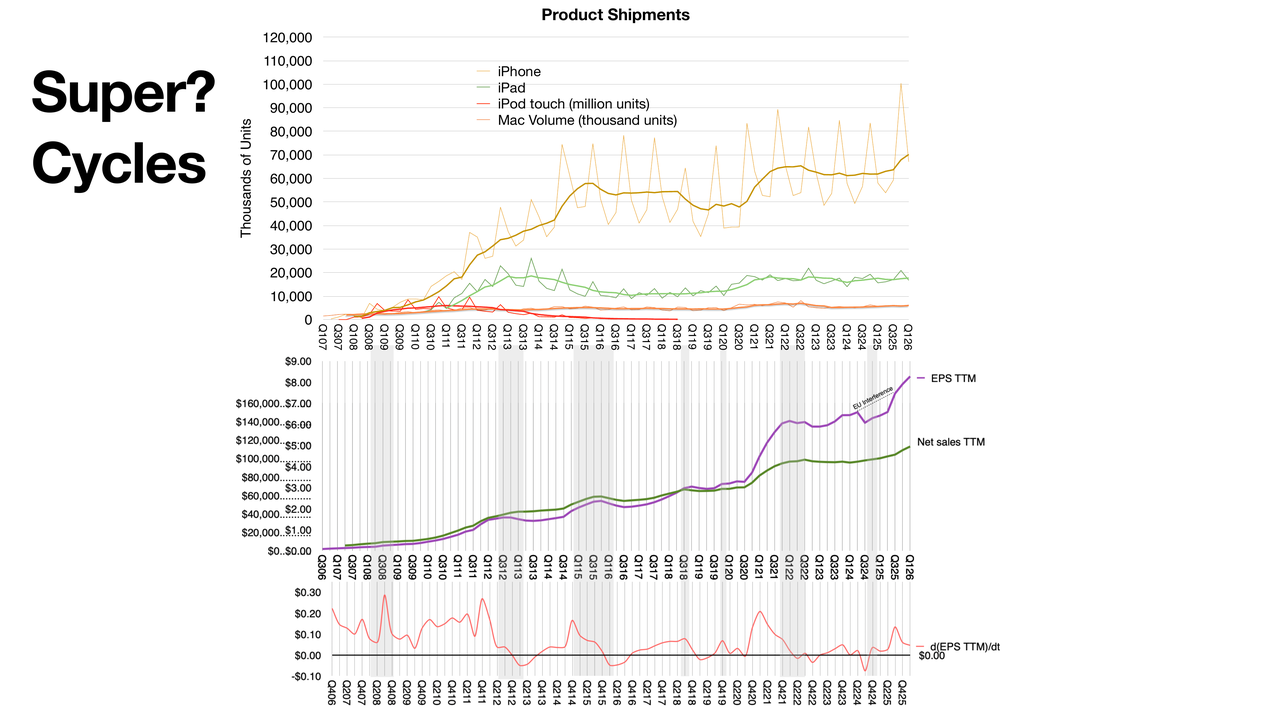
And we'll get into some reasoning why that is. People talk about super cycles, people talk about the assumption that we have these giant surges once in a while. Well, here's how to look at it.
There are two graphs here. The bottom graph shows in green the net sales, but trailing 12 months, so it's smoothed out, so we don't see the spikes on the holidays. That's the green line. Above that, we have the EPS line. Now you'll see how they tracked very similarly for a while, and then they began to diverge. That occurred around COVID. It also occurred during the surge in services, especially subscriptions and services. But still, there's a similar pulse, if you will, a cyclicality to it.
I mean, part of that has to do with the introduction of a new form factor. This has been true all the way back since 2012. When a new iPhone comes, especially a new, distinctive-looking iPhone, people will go out, especially in China, buy it for showing off that they have the latest, which there's nothing wrong with that. But then the second year usually is not the same, the phone is not new, it's the same form factor. That has to do a lot with tooling. That's a long, old story, that the tooling is depreciated on a two-year schedule, so you're going to produce roughly the same look a couple of years in a row, and then by the next cycle, you'll see people upgrading or replacing their older phones. So you're going to have this— I guess what they used to call a super cycle.
And you see it also in the upper graph, where I try to separate out of sales just the phones. Now this is an estimate because we have no unit sales for the phones since 2018, so some of that is an estimate. But you'll see again, once you smooth out the cyclicality, you'll see these surges once in a while. Now, again, this is a valid observation, but I don't think it's the main driver. The oscillation isn't huge, it might be significant, but it's a blend of many things.
The bottom graph is particularly interesting. The gray areas are when the stock price fell. And the red line represents the derivative of EPS. And you'll see how, when that is about to dip, there's usually a stock price sale going on. I wouldn't say it's predictive, but it's an interesting pattern to go through.
So what's happening now? You'll see from the iPhone, there's a new surge happening. Now, when Tim has been asked this question, he says that, well, the iPhone 17's really nice, people really love it, and that's a good answer, but the fact is, it's a distinctive-looking product. Some say it's the orange color, but it's certainly attractive. So we're seeing this pattern, a nice surge.
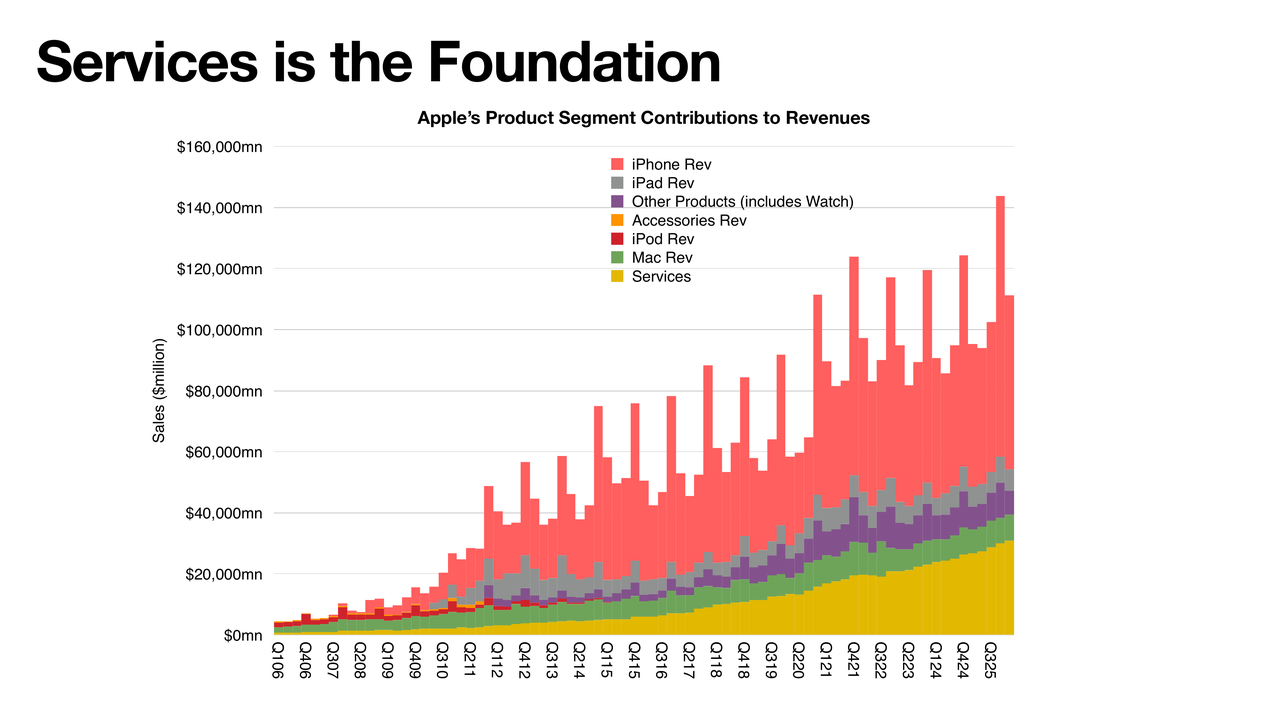
We'll get into the guidance in a minute, and that actually demonstrates that we're in some kind of an acceleration. But here's the thing, underneath all that, services is just absolutely steady growth, compound growth, and as a result, it just lifts the whole story.
Here, services is at the bottom. Normally, in a graph like this, you want to put the oldest products at the bottom and the newer ones at the top, but I wanted to highlight the fact that services is foundational, in the sense of showing how it holds up everything else.
Most people put it the other way, they say the iPhone holds everything up, but services is looking more and more to be the thing that keeps people in the ecosystem. There's a lot of value there. There's a lot of things people depend on there, and I think it's one of the reasons people don't switch. So it's another one of these stories that people aren't appreciating enough. It's been years and years of pounding the table on services, but here you see it, just how important it is. It's the tide that lifts all the boats, and the boats being all the products.
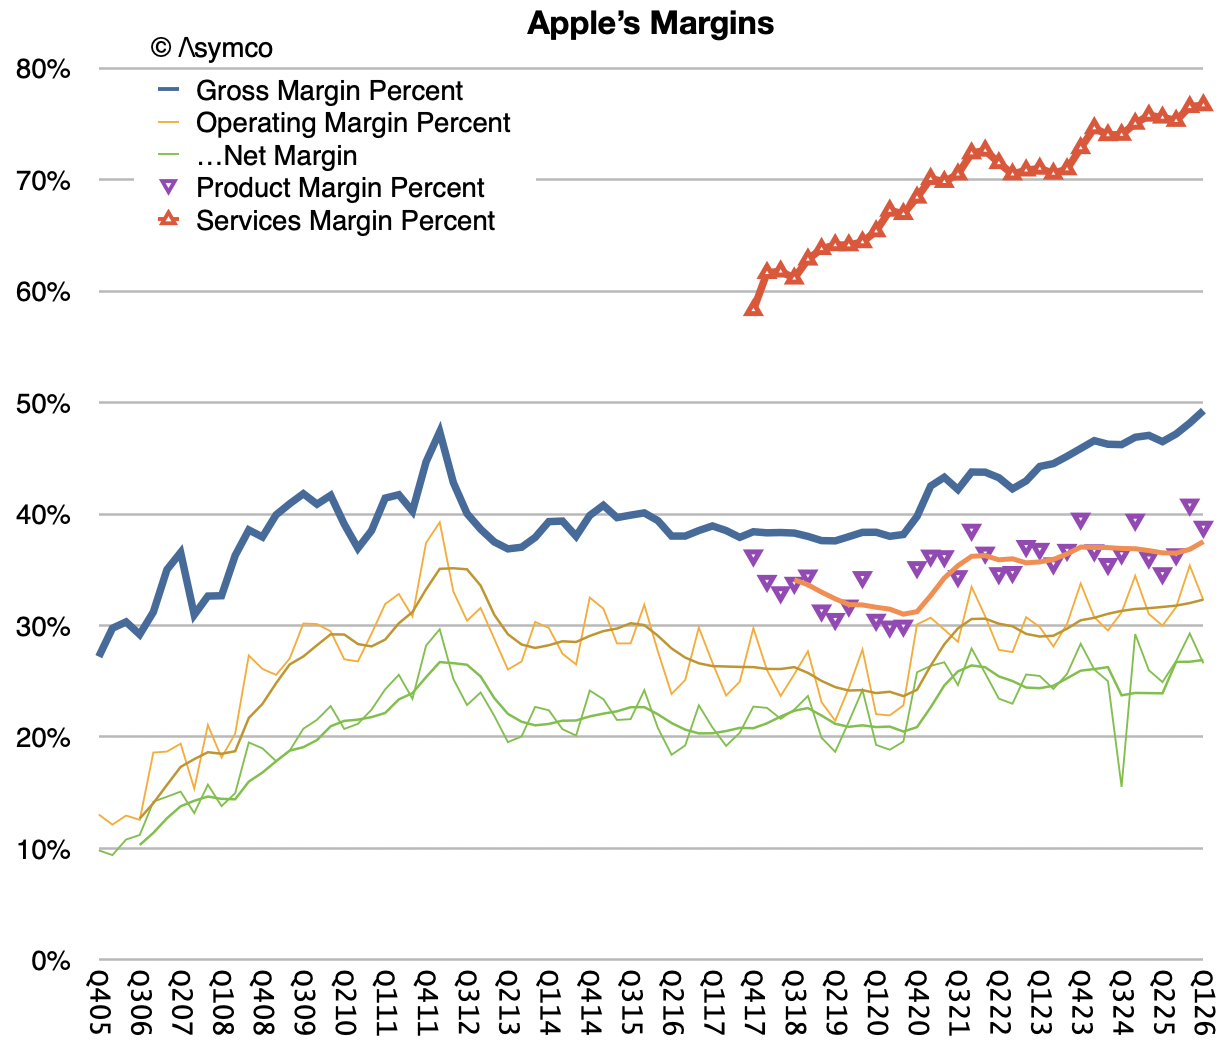
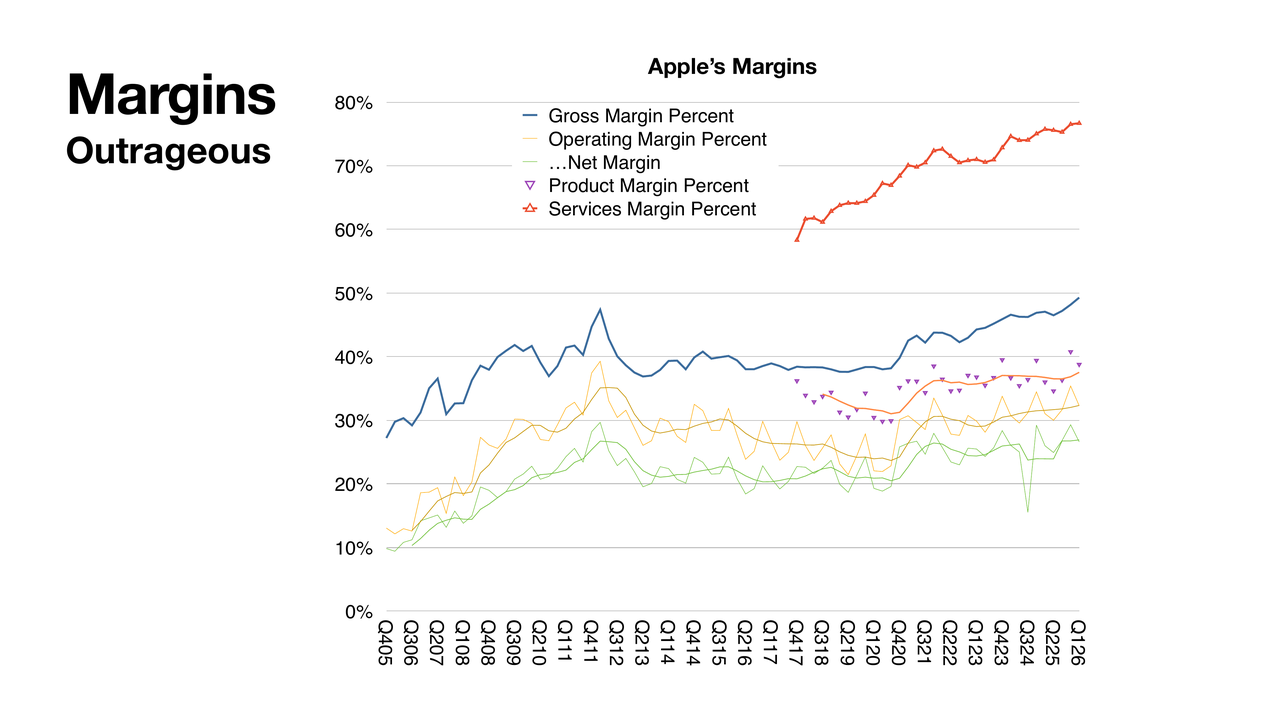
So let's now talk a little bit about margins. Unbelievable, unbelievable margins. We just hit almost 50% on gross margins. Gross margin here is the blue line. And that's composed of two subcategories. We have services in red at the top, and we have products with the purple triangles.
And although products margins are exceptional— they're right around 40%— those services, again, are pulling the whole average up, and you can see that bend in the curve in the blue line, where we were very steady around 40%, but as services took more and more; it just pulled the whole curve up.
And we also see here operating and net margins, which also are going up, naturally. There is a little bit more operating expense. We'll get into that, which maybe decreases the slope of the bottom line. But this gross margin is absolutely incredible. We just haven't seen anything like this since 2010-11. We saw that surge back then, and then it sort of leveled out, and everybody was happy with 40%, and now we're flirting with 50. I just cannot believe it.
Just one more thing. I remember being an analyst decades ago, when I was looking at different companies in hardware and software, in phones and computers and so on, and everybody was really impressed by Microsoft, because Microsoft, had an 80% gross margin, because there was very little cost of sales. That's exceptional. An 80% margin business is a money printing machine. And everybody was impressed and jealous of Microsoft that they could pull that off. Of course, Microsoft, a software company, is going to have extraordinary margins, right?
And so for a phonemaker like Nokia, there was something to be jealous of. And here we are with Apple services, a significant component on the business, approaching also almost 80% right now. And it's still rising. I just can't get over how impressive this is.
R&D Acceleration
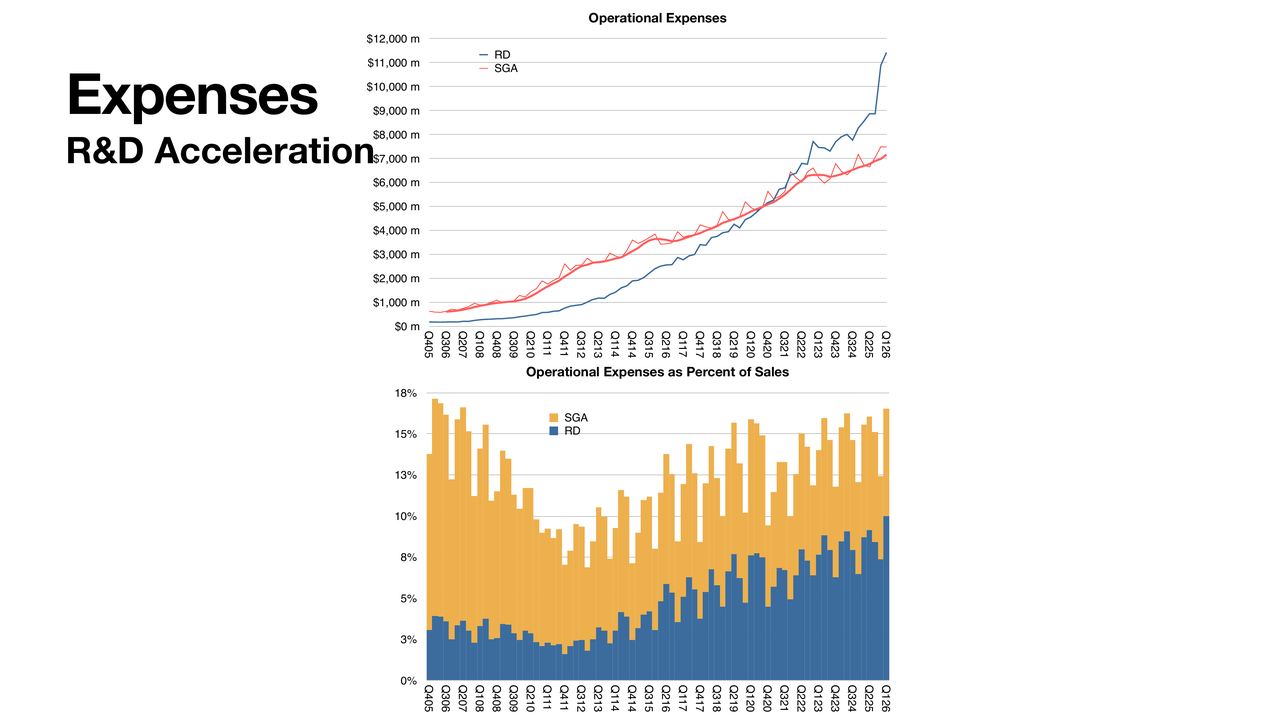
A little bit about the difference between gross and net— you have to take out the operational expenses, and this is what we have here. It's interesting what's happened. Obviously, you see R&D overtaking on the absolute basis. So R&D overtook SG&A already in 2021. And now it's just [going] almost vertical.
By reading a little bit the guidance, I think it's going to taper a bit into the next quarter. But what we see is a significant R&D increase, also as a percent of sales, which you're seeing below in the graph below, but in a stacked fashion. In that sense, the two of them together are now approaching— haven't yet reached— a percentage of sales that was in evidence around 2007 and 8, when the iPhone was just emerging. But you'll see back then, R&D was tiny, SG&A was huge as a percent of sales. So much so that R&D—this is during Steve Jobs era, R&D was like 2% of sales. And now it's approaching 8%, which is extraordinary. Because that's an engineering company that's doing breakthrough work.
And that's something that Apple's not recognized for doing. There's a negative side of spending a lot on R&D. The positive, though, is that Apple is doing a lot of fundamental research now. This isn't fixing products, this isn't updating OS. This is engineering that is really driving what might be considered breakthrough. And that's something— and I've said this to the media when interviewed about Ternus and the succession— I said, the new CEO will need to be— this is before he was announced— I said [the CEO] would need to be someone who is acceptable to engineering, because Apple is an engineering company today. Fundamentally, culturally, operationally, it's an engineering company, and it is being now led by an engineer.
Steve Jobs was not an engineer. And none of the other CEOs were engineers. Tim Cook was an operations manager. He was excellent in a fundamental part of the business. And that is acceptable to engineers, culturally speaking. But the thing is that John is an engineer's engineer. He understands the culture of engineering and will understand how to motivate and retain talent, as well as to allocate capital effectively, not wasting it on pipe dreams. Engineers have a tendency to try to chase dreams, by the way, so you got to be harsh sometimes to shut things down. So, keep an eye on the R&D— it's a great story.
However overdoing it can be a problem. There are downsides to an engineering-led company where, again, it turns into kind of an engineering welfare state. Engineers tend to get projects and do a lot of navel-gazing, which needs to be managed carefully.
Now, let's just touch on ACTIVE. Active is the number of users, the fundamental measure of the value of the company. It's not counting iPhones. It's counting users, and these are the comments from management, just so we capture them. They come every quarter. Sometimes some products are mentioned, sometimes they're not.
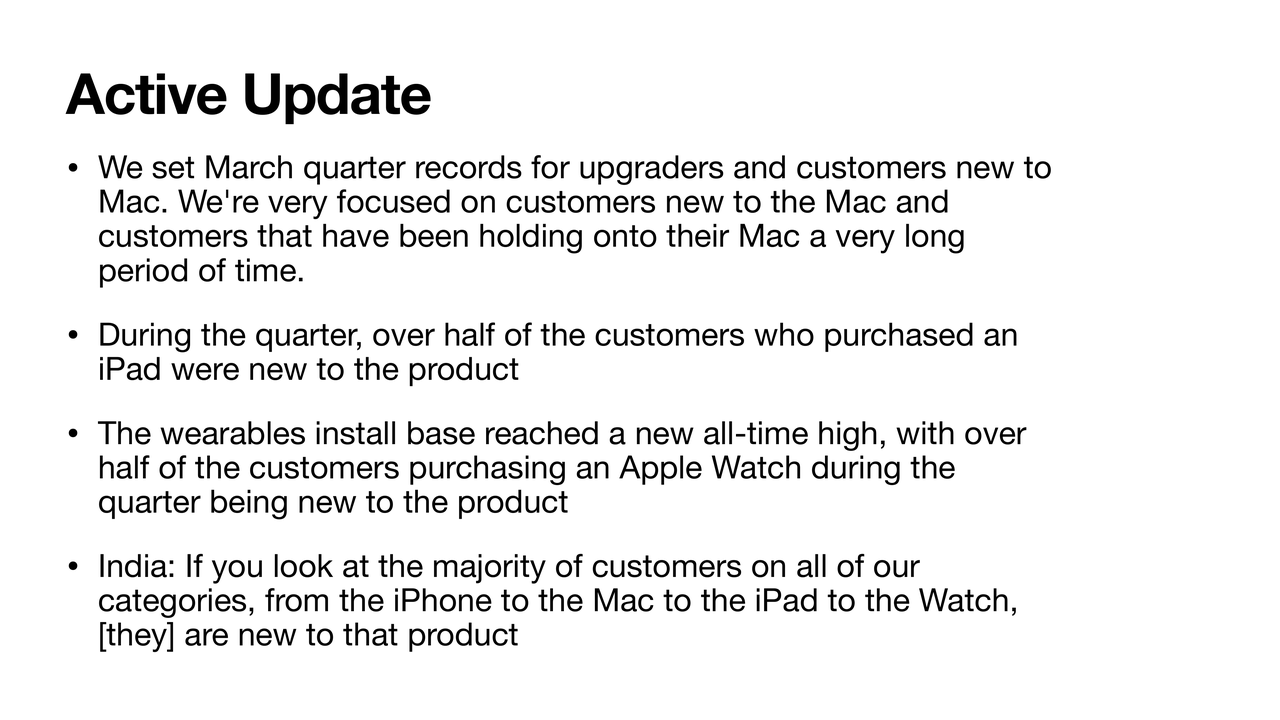
So here's what we have exactly on the topic. Record upgraders and customers new to the Mac. They mentioned that Mac lifespans have been long, which is good and bad. They talk about the iPad, half the customers being— over half— new to the product. Same with the Apple Watch, this has been going on for a while.
So this is going to be important when we measure installed base, because if we see every quarter an estimate for the number of watches, or Macs, or iPads, you just take half of that and allocate it to the installed base, and the other half is growth of the installed base. So there's an interesting way to measure that, and I've been applying it. We're going to keep an eye on this.
And finally, there was a mention with respect to India during an answer to the question. The citation is that the iPhone, Mac, iPad, watch, all of these have a majority of customers that are new to the product in India. As you would expect, part of the developing market story. But this drum is still getting beaten. And that's a positive. Always want to look forward to that every quarter.
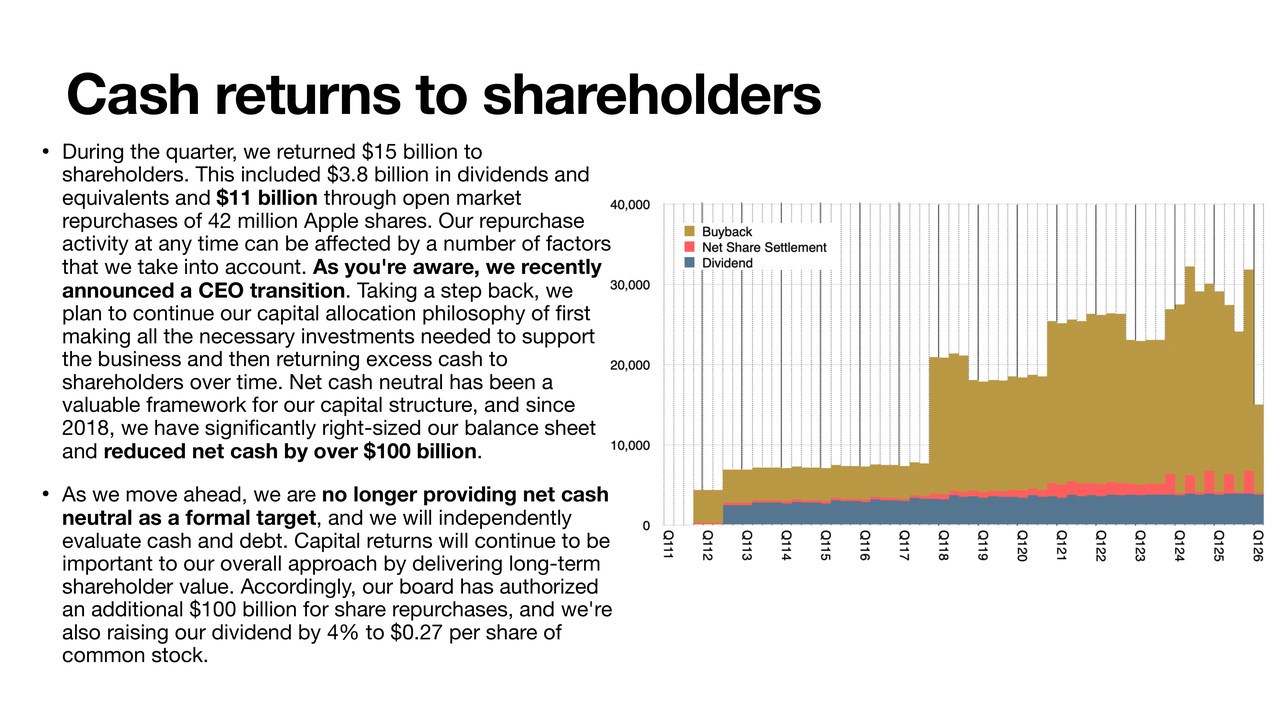
So let's jump in now to what I thought was the most unexpected comment during the call. I've pasted in here exact, verbatim the comments from the CFO. I need to point out a few things here, and I've highlighted these things in bold.
One is the dividend. The dividend number is 3.8. Last quarter was 3.9, so that's not a surprise. However, open market purchases were only $11 billion. Now, that is represented in the graph by the buyback, and that is this mustard color. And you'll notice it is extremely low. The previous quarter, we were over 25 on buyback, so we're less than half that. This is an anomaly. You'll see that it does not match the rest of the graph at all.
The blue area is dividends. The reddish area is net share repurchases, or settlements. And there's a pattern to both. Dividends has been growing in a predictable fashion, very steady. Buybacks have been somewhat steady, but up and down a little bit. During the last few periods, we've seen something unprecedented.
Now, you'll see that the 11 from last quarter was offset by a much higher number the previous quarter, but on balance, we're still down. And there's also these comments that say that they are abandoning the net cash neutral position. And I'm wondering if it's already started, because this $11 billion caught me by surprise.
I've highlighted that "our repurchase activity at any time can be affected by a number of factors that we take into account." So this was essentially explaining why sometimes there's a difference in the amount of purchases, right? And then in the middle of that commentary, he says, "as you're aware, we recently announced a CEO transition." Why does that comment fit in the middle of a paragraph, talking about the general theme?
I read this as it suggests that already the CEO choice is deciding how much to allocate to capital returns. And it appears— and again, I could be wrong— but it appears that John is probably against the idea of huge returns to shareholders in capital form. So keep an eye on this. This was, I found, very, very strange and out of character in a way. Very out of character of a Tim Cook presentation. I'm not judging it, I'm just pointing out that it isn't normal.
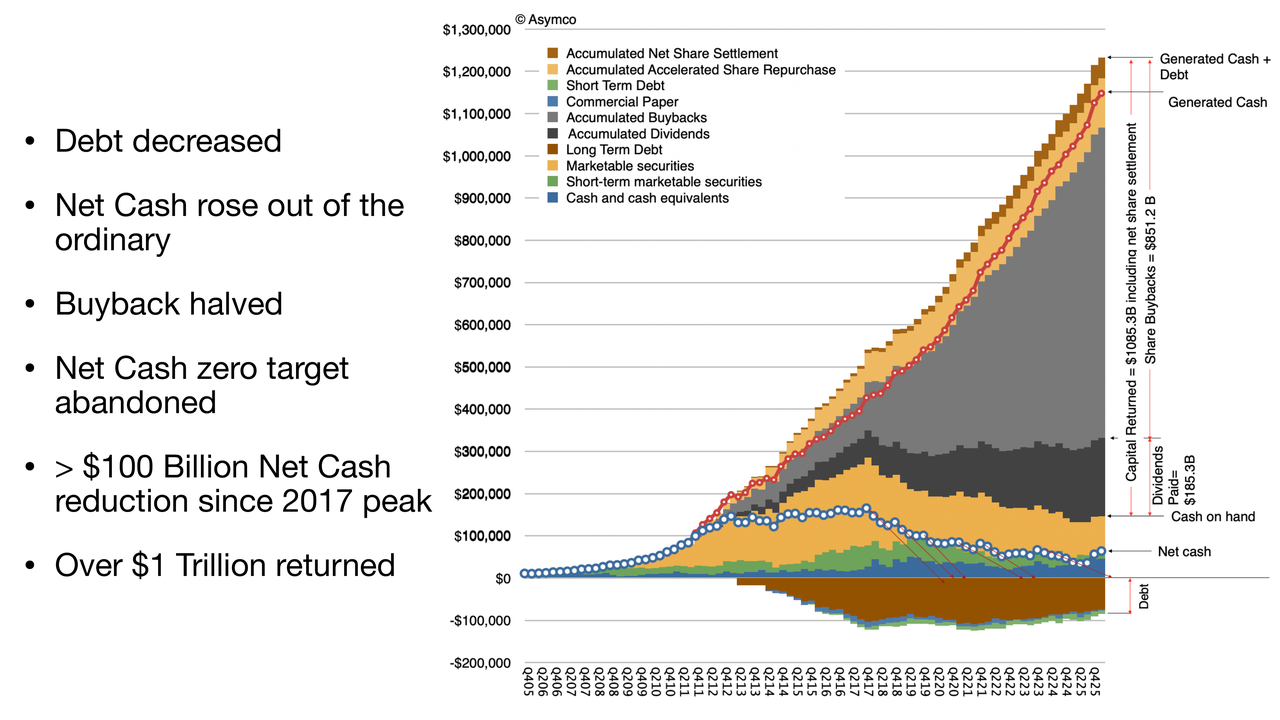
So here's the bottom line. This is the graph representing what's happening with the entire cash position and return of capital. The debt has decreased slightly, and it has been decreasing. And that's a good thing. As interest rates go up, you don't want to hold debt. A lot of that is fixed rate, but they're not taking on more. It seems like they're paying it down.
Net cash, which is the blue dotted line, has now been increasing two quarters in a row. Now, it's increased in the past, but never for long. It's had only one tick, during the holiday period. Here, where we're seeing two ticks— holiday and the quarter after.
Now, if you'll notice here, I'm going to try to zoom in. Those red lines represent what I would say were the trajectories to get to net cash zero. So that blue line, since they announced it, they kept missing the target. You would see that, another year goes by, and there's a notch up. Overall, the trend is down, but they haven't kept that path down all the way to zero. And that is now completely abandoned.
Again, we'll have to figure out why. The buyback, as I mentioned, halved— at least more than halved— to 11. Net cash zero abandoned, $100 billion net cash reduction. You'll see that this blue dot line has gone down by about half. It was down even further than that until it came back a bit. So that is going from about $160 billion net cash to the current $62 billion, which is why we get to 100 reduction. And $1 trillion overall return, which is, again, something they mentioned. In fact, they're at $1.085 trillion. And still $100 billion will be allocated further. Whether they actually spend it is another matter, but that's been approved.
So now— is this good news or bad news? I don't think it matters. I think at the end of the day, the value of the company doesn't change because of this. The value might be captured in the share price, or it might be captured as a percentage of the company that has been increasing.
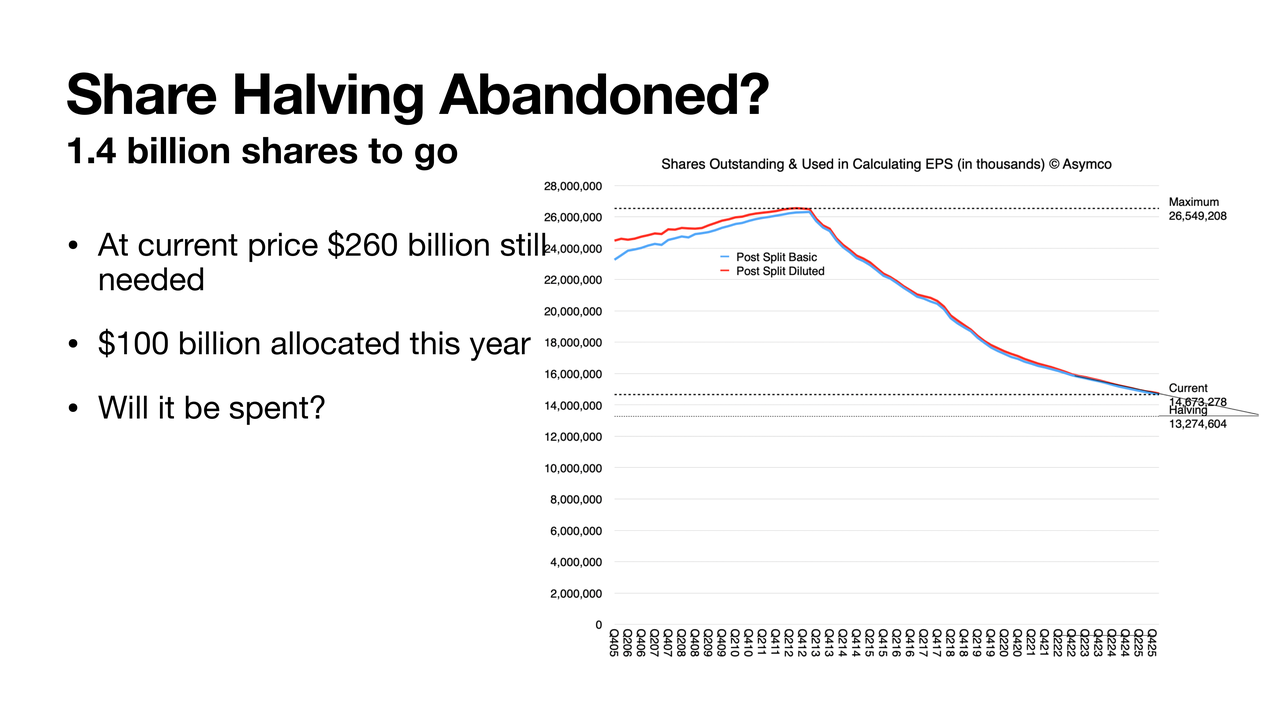
In fact, let me just pop into the next slide. What does this mean? Are we never going to reach what I call the halving? Well, we were at the maximum 26.5 billion shares. And now we've reduced that to about 14.6. Half would be 13.2. So we're still going down. But there's 1.4 billion shares to go before it's half of what the max was. Now, this is an arbitrary figure. I just thought it was an interesting target to have. And as you can see, it's getting asymptotic as the price goes up. It should be harder and harder to get there. But we have $100 billion allocated. $260 billion at the current share price would need to be spent to get to half. But probably we're not going to get there. I really don't— if I were a betting man, I would say we're probably going to see this taper.
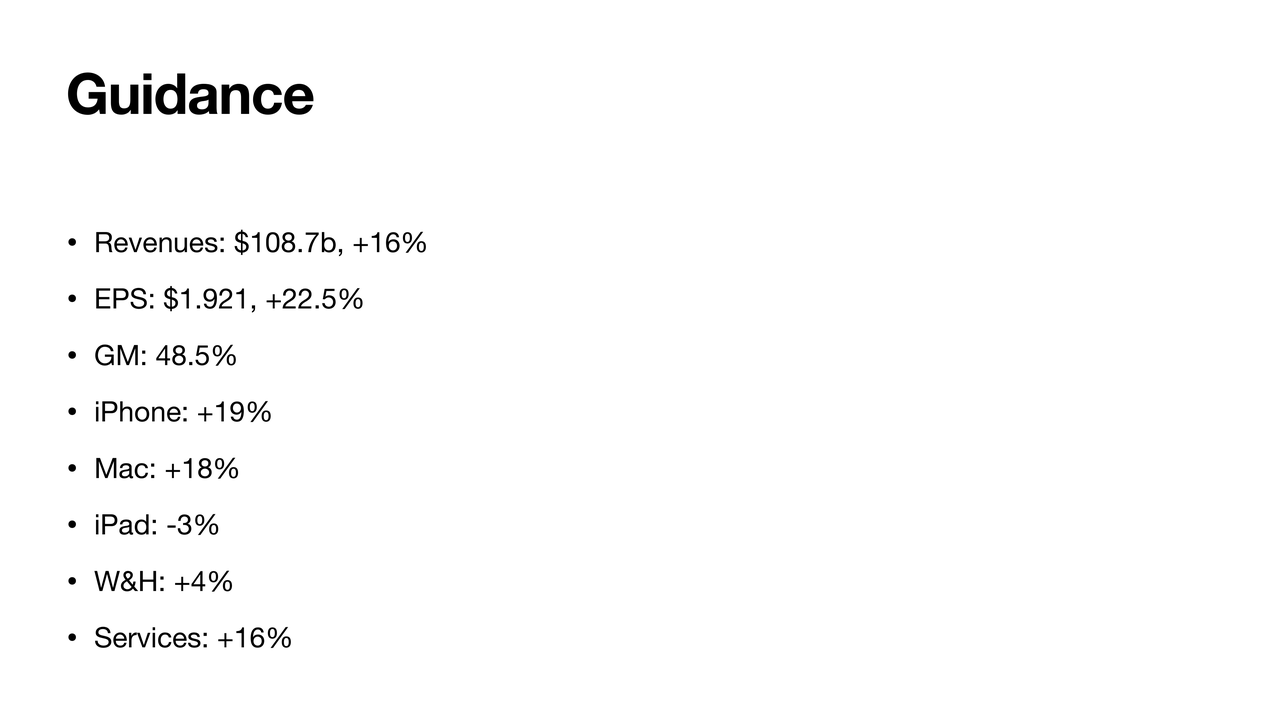
Let's look a little bit at guidance. This is based on what management already communicated. So if you put in the numbers they gave us, you will get revenue growth of 16%, coming at about— well, they guided 14 to 17, so I'm estimating 16 conservatively right now. That gets you to $108.7 billion. If you put in the other numbers— the margin, the OI&E and the tax— and do something about this share reduction. (We're still going to probably see a share reduction.) We're going to look at EPS 1.92. Which is another 22% growth. This is what we had last quarter as well.
I'm putting gross margin at the top of the guidance. [Last quarter] they went over. They guided high, and even so they went over, so I'm going to assume they're going to still hit towards the upper end of the range. I'm exactly at the upper end of that range.
If those things are true, the iPhone almost necessarily has to grow about 19%. Now, here, I'm dialing the Mac way up to 18% growth, because I do think they're going to get a lot more Mac Neos into customers' hands. Now, that's a lower price point, but it will drive sales. So yeah, I could be a little bit high on this. If I am, then iPhone needs to go a little bit higher because I still think they're going to get the revenue there.
They did warn that iPad is facing a tough comp, so I'm putting iPad down 3%. Wearables and home, 4%. It was 5% last time, so maybe consistency there. And Services, just the same as before, 16%, could come in a little bit less. But if it does, again, it's going to be put into something else like the iPhone.
So overall revenue growth, I think 16% is very much being telegraphed. And as I always say, they already have April on their books. They're communicating exactly at the end of April. They're not going to lie to us and withhold data from April. They know about a third [of the quarter] already, so that's why this guidance is so useful.
And, as you saw with my error analysis, nowadays, people's estimates are very close. There's a lot of consistency. We're not off more than a couple percentage from each other. That's just because they're so accurate on their guidance.
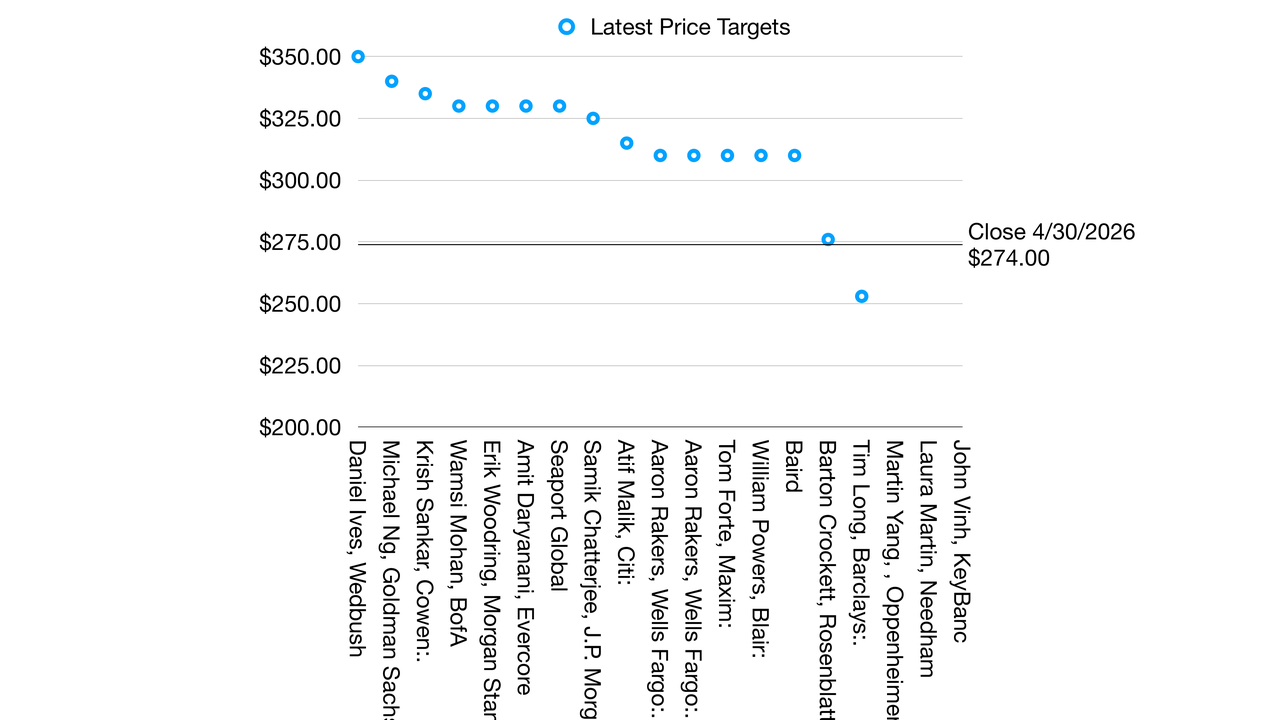
And speaking of analysts, one more graph. This is just some of the latest price targets. I'm just trying to bring everything together that came out today. This is all very brand new. A lot of targets moved up. Not that it's all that important, but people are getting more and more excited. Almost all the targets from anybody who has a positive— effectively a buy rating— is now above $310 as a target. There's two who are negative, that are at 270 and below. This is Barclays and Rosenblatt. And then there's a few which have no ratings. So they're typically neutral.
But overall, all these numbers are higher than they used to be. Now, again, I don't use that very much, but it's worth keeping an eye on things just to get a sense of how the sentiment is out there. And it looks like the stock is responding positively today. Not by much— 3% or so, last I checked. But that's the story today.
So given that, this is my first take on the quarter. Love to take questions.
-- End of Presentation --
Editor's Note: This presentation is made available to non-subscribers for a limited time. Subscribe to Asymco Oneforfull access to this and other content.