Recording and transcript of the June 9, 2026 Asymco One Office Hours, recorded the day after Apple's WWDC 2026 keynote. Horace Dediu shares his impressions of the event and takes questions from Asymco One subscribers.
Why the most common measure for valuation is inadequate in an age of AI
Software and services companies like Google, Microsoft, Amazon, Meta are spending on Capital Expenditures at the rate of heavy industry manufacturing. This defies their description as "asset light" business models which depend on services, distribution or platform economics.
The problem isn't just semantic. It is that for their entire existence, these companies were valued for their profitability and measured in terms of a P/E ratio and earnings growth. The situation has changed dramatically. Their revenues are up, the earnings are up and growth is up and share prices are way up. But not their P/E ratios. Why is this?
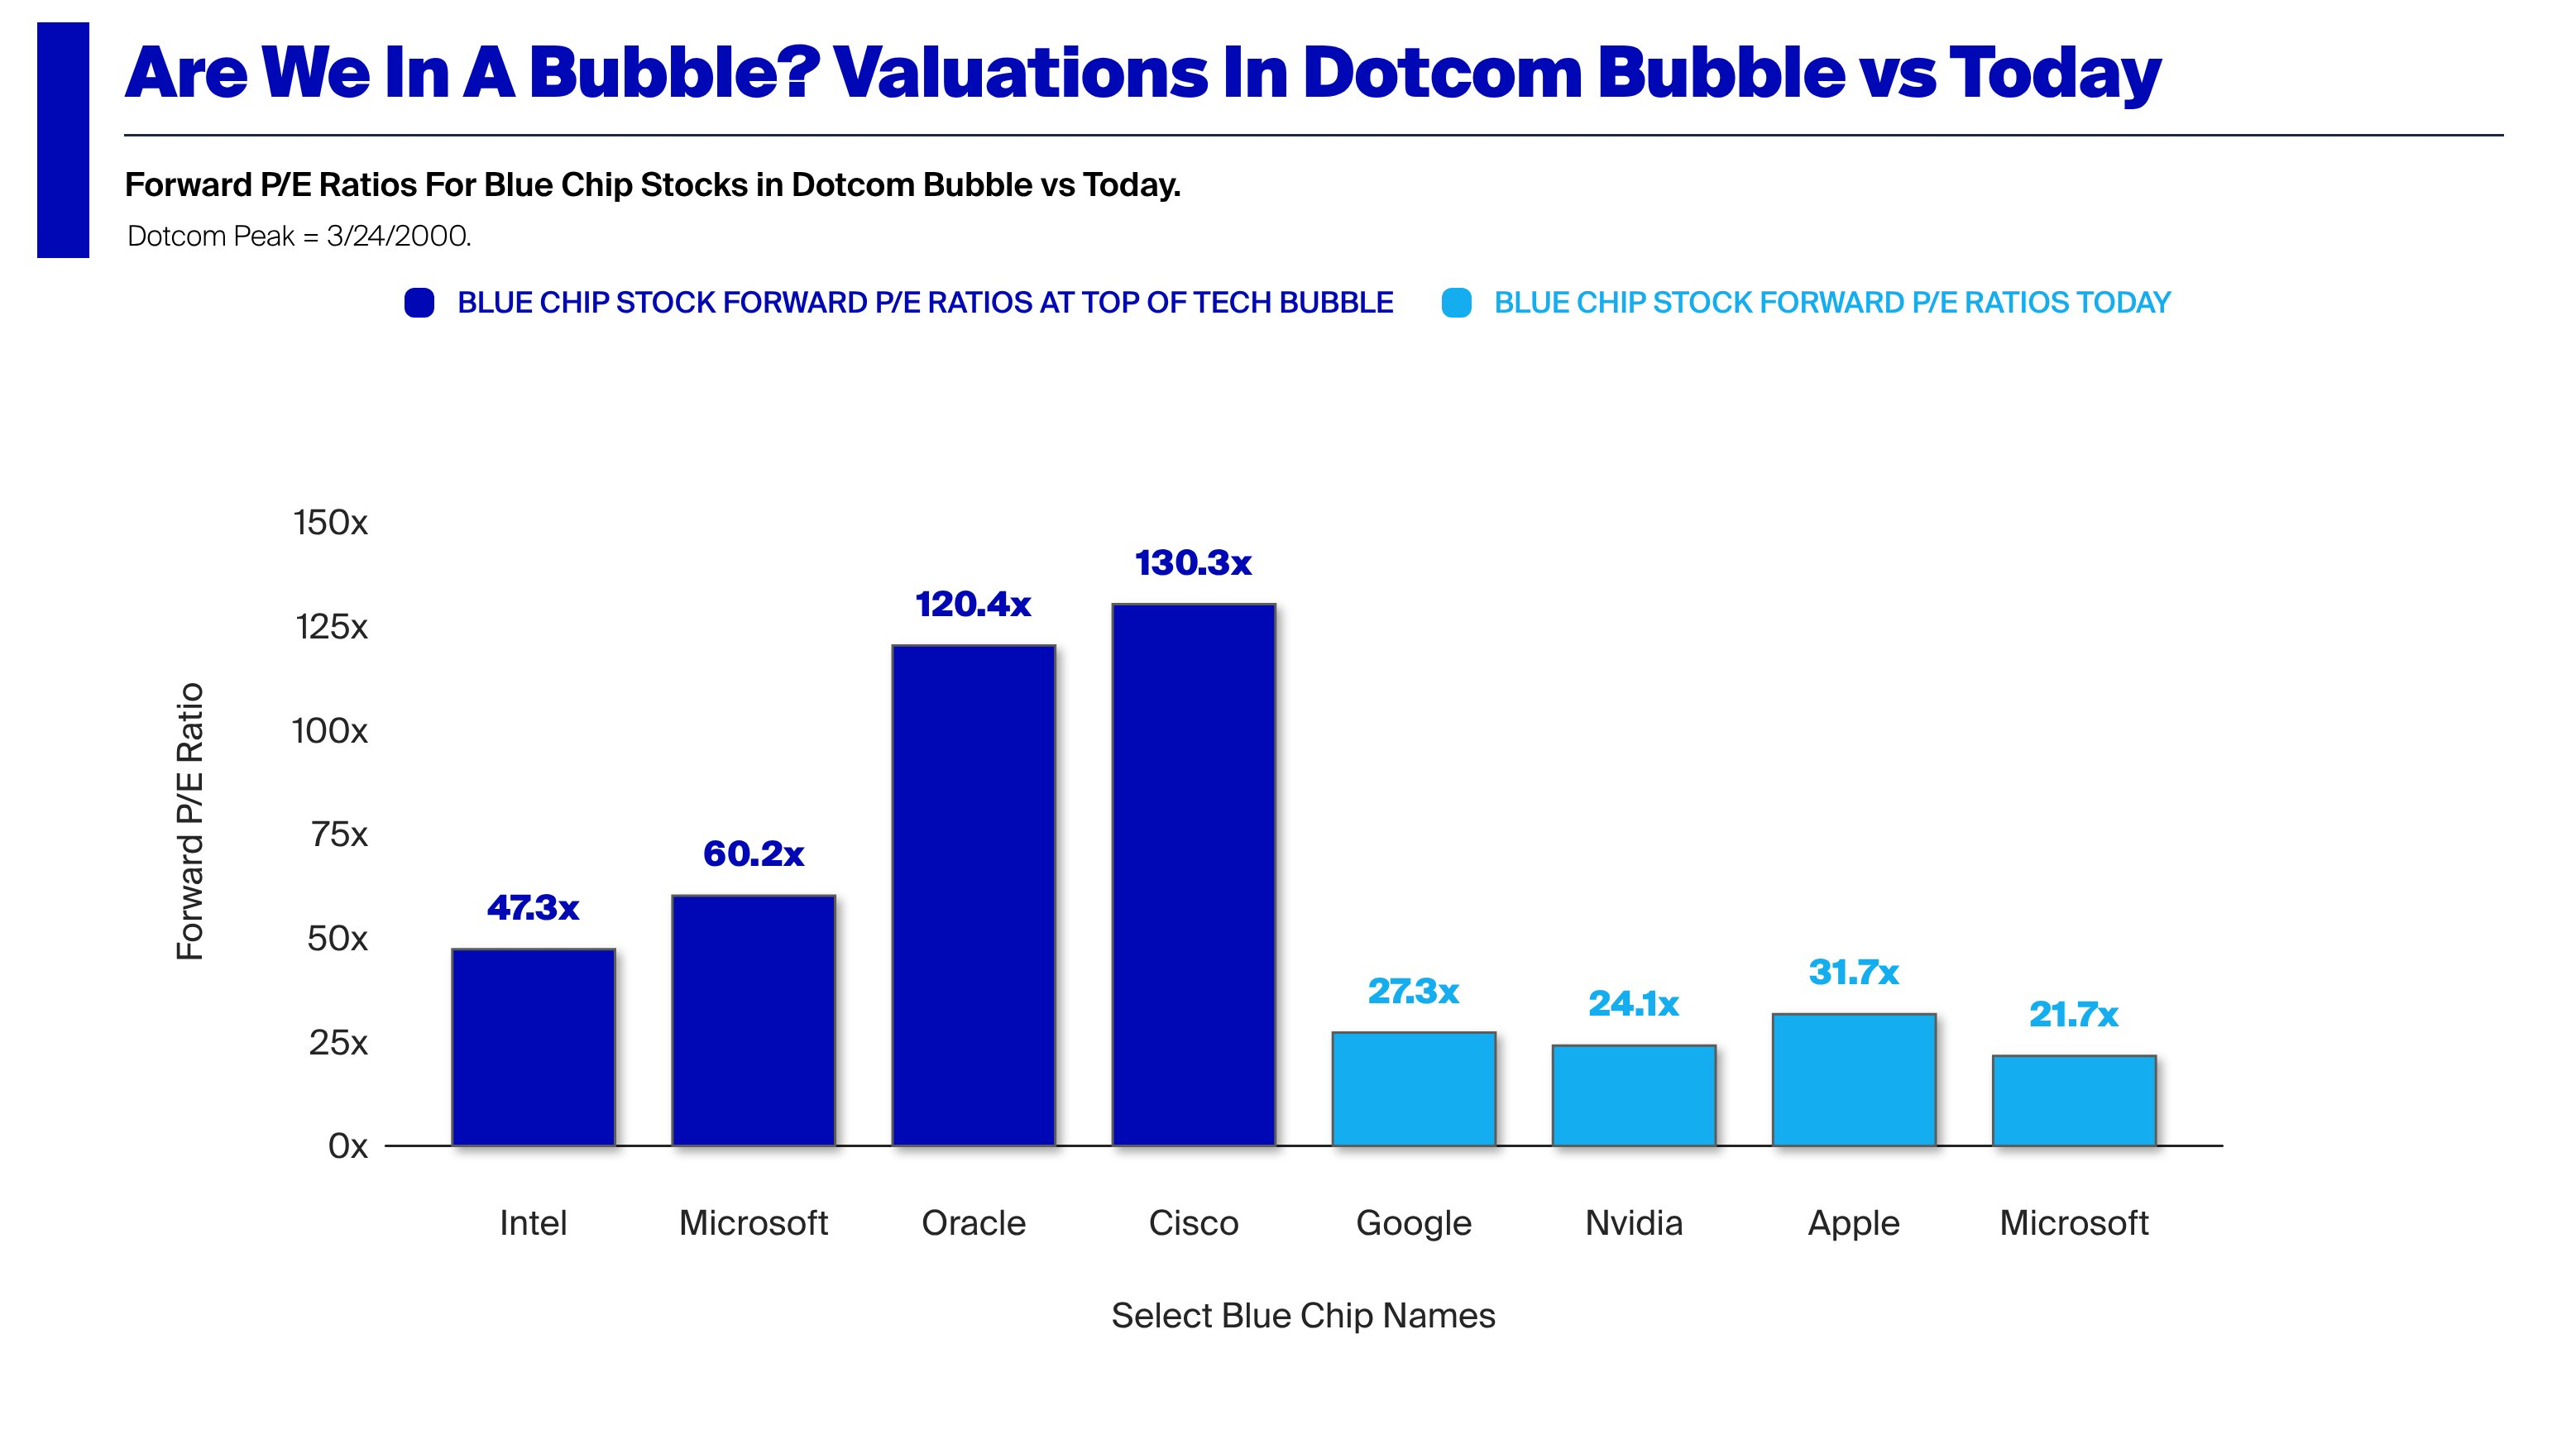
Consider the graph below showing the (forward) P/E ratios of the Dot Com market leaders vs. the market leaders today.
This even as share prices and value concentration have risen even faster than in the Dot Com era. Seen from the P/E basis, it does not look like we are in a bubble. Earning growth is way up so the share prices are not outrageous on that basis. That is contrary to 1999 when P/E ratios in the hundreds were considered normal. Expectations of an internet fueled boom were speculative. Expectation of an AI earnings boom seem well founded.
But these companies could still be over-valued. The P/E ratio is not the full picture. It is in fact a simplifying shortcut which ignores significant pockets and omissions of value.
For this analysis I'll use a sample including some of the largest market caps in the world with two exceptions. The exceptions are Lilly (LLY), Berkshire Hathaway (BRK-B) which are on the list but not in the top 10 (though in top 15) and Saudi Aramco and Broadcom which are in the top 10 but not on the list[1].
Company
Market Cap
NVDA
$5,709,746,405,376
AAPL
$4,379,916,369,920
GOOG
$4,811,891,146,752
MSFT
$3,041,424,048,128
AMZN
$2,874,514,866,176
TSM
$2,166,463,135,744
TSLA
$1,664,912,326,656
META
$1,569,837,154,304
BRK-B
$1,044,046,610,432
LLY
$897,716,060,160
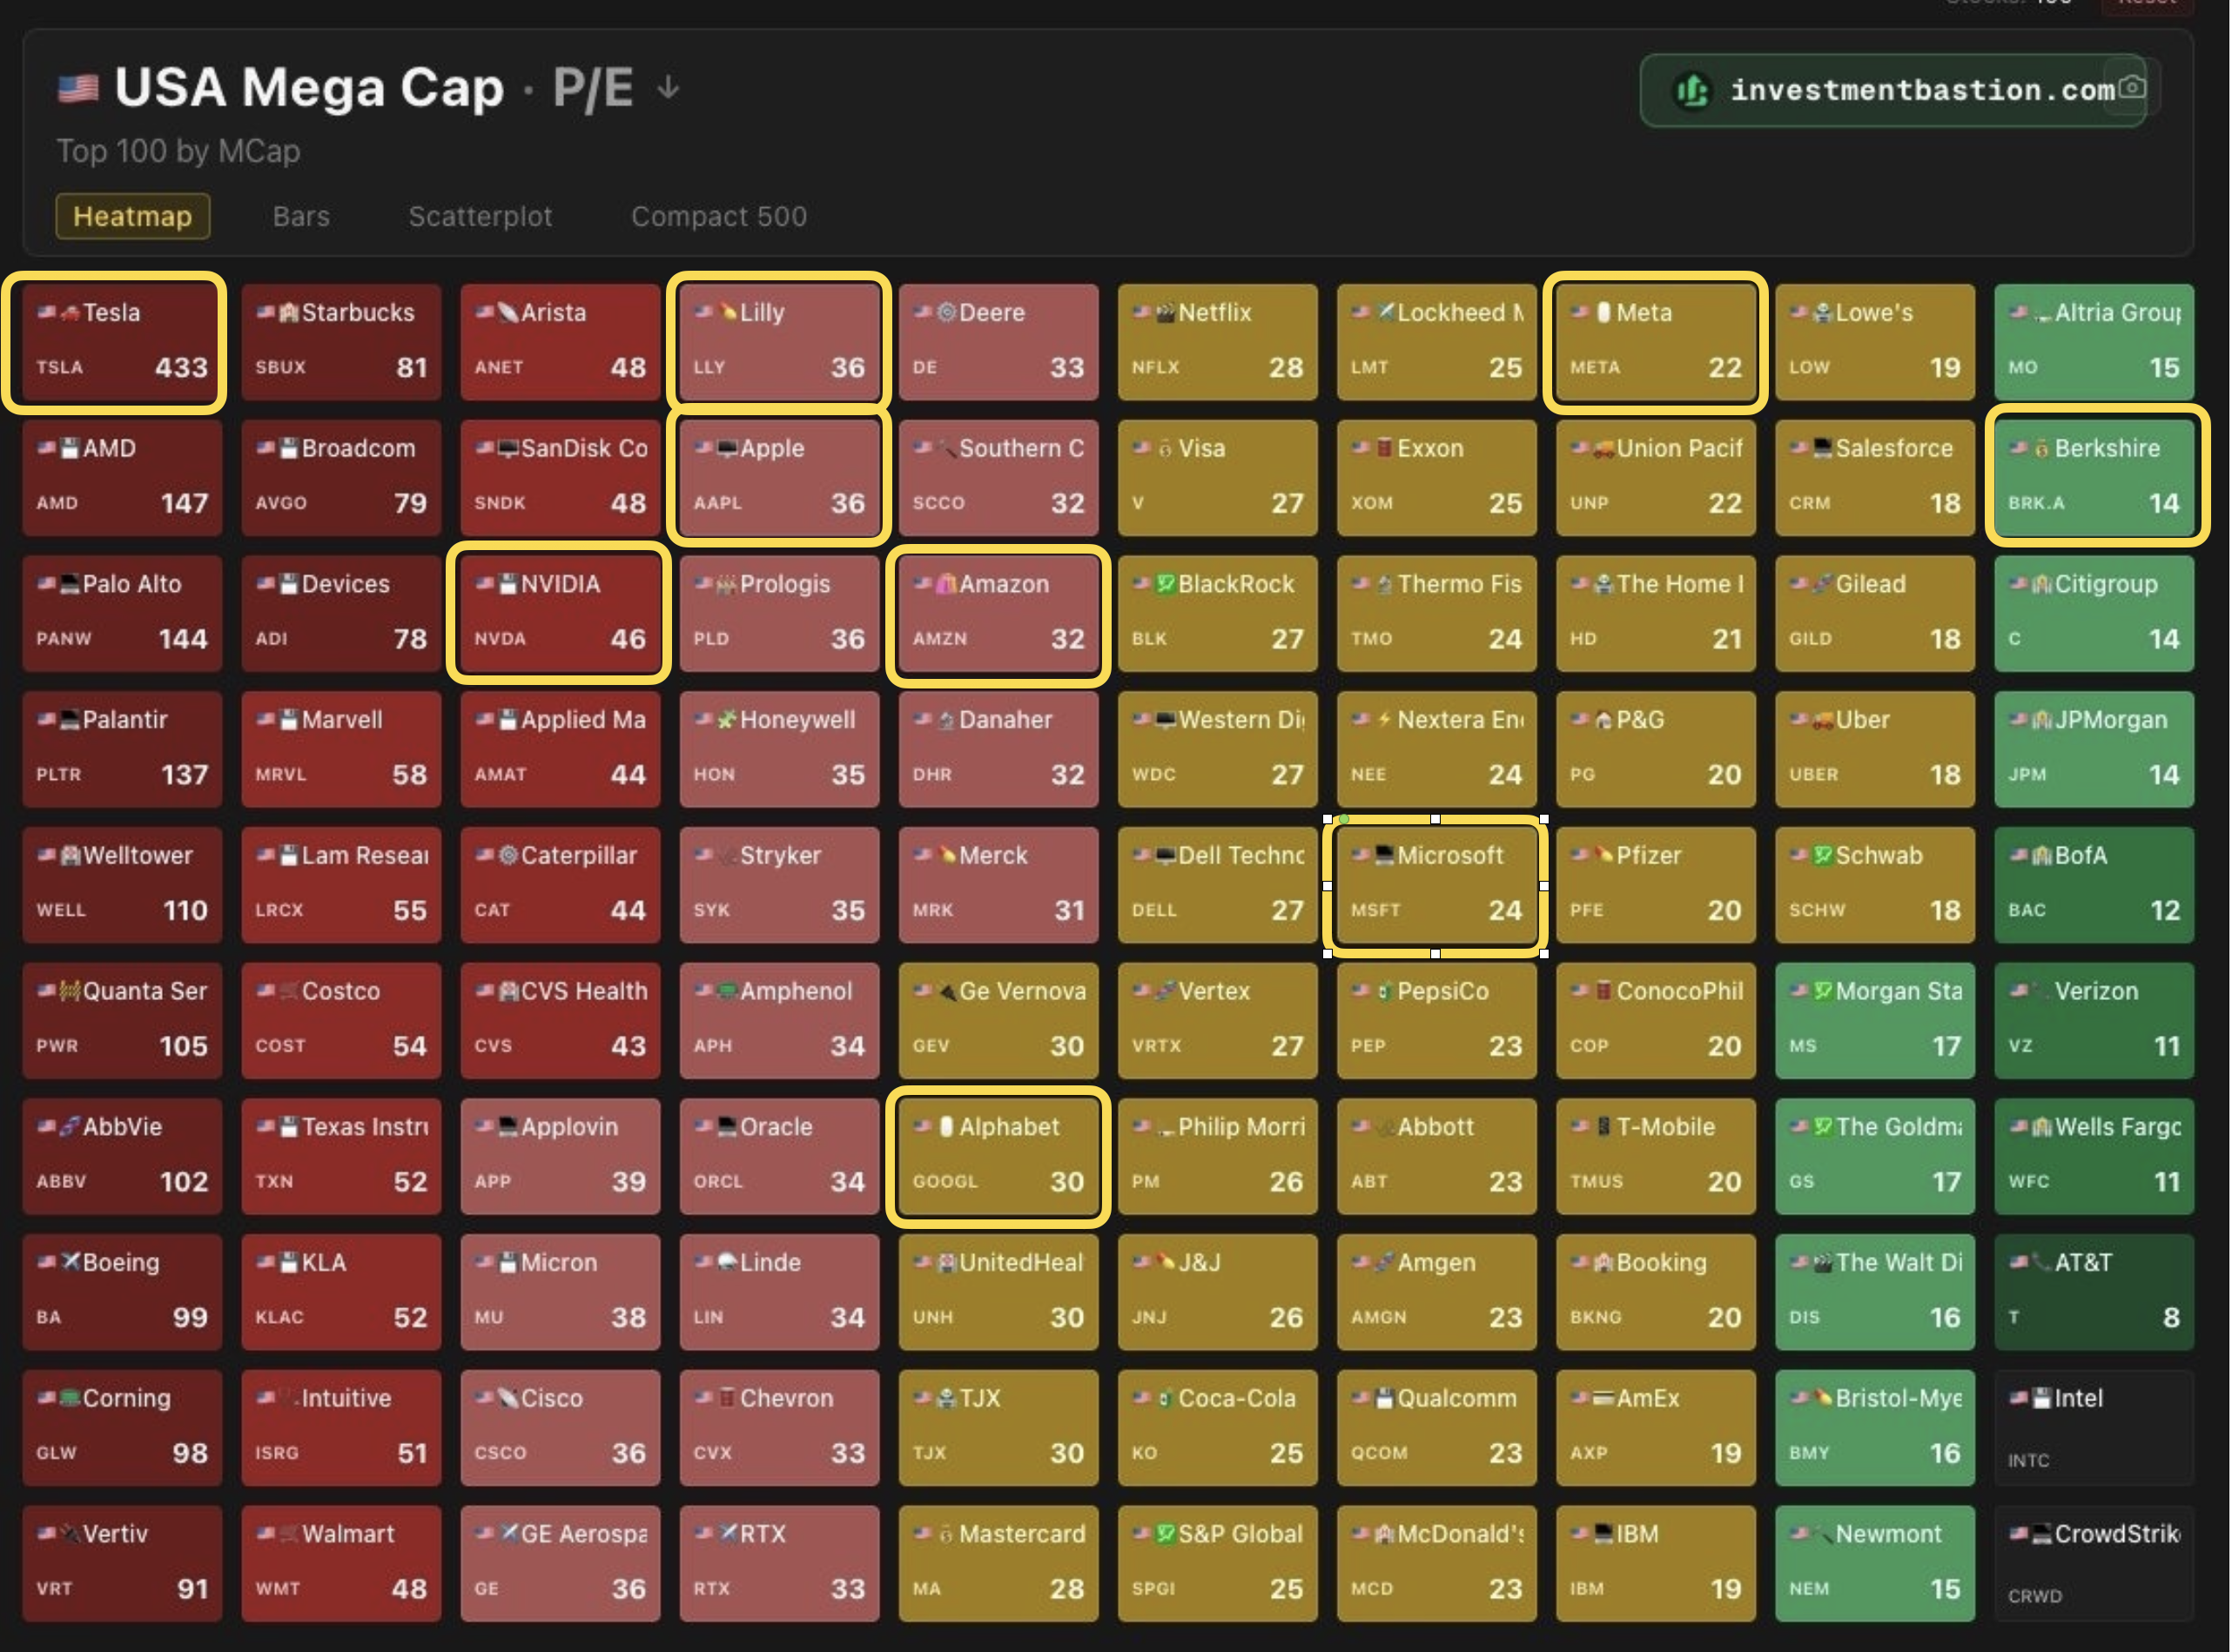
The following diagram shows the P/E ratios of the sample relative to the top 100 US market caps[2]. Note that, with one exception, the companies are not in the dark red zone with above P/E of 60. The exception is, of course, Tesla, which, at P/E of 400+ is 14x the average multiple.
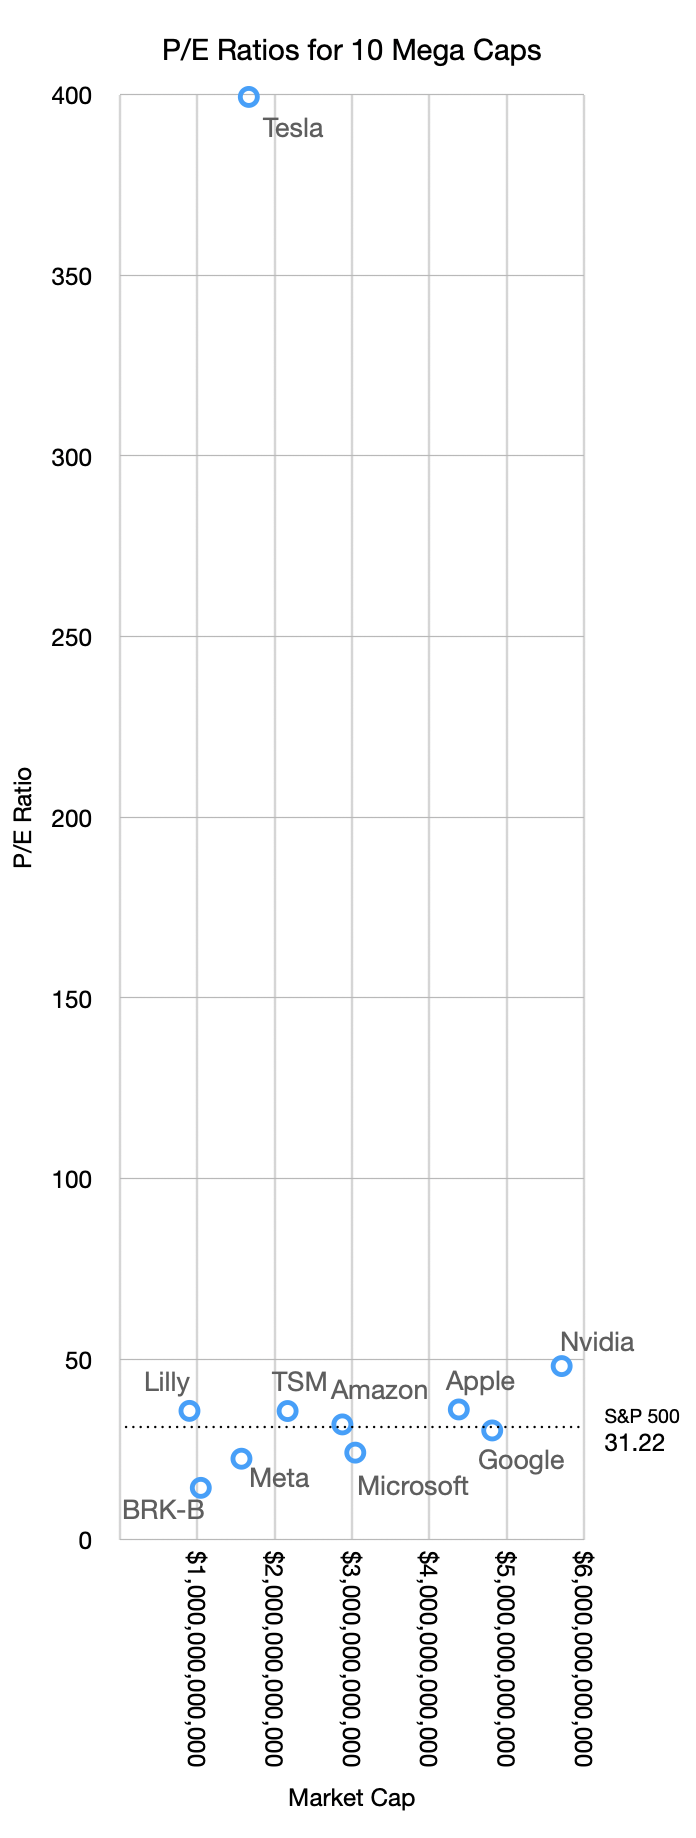
Moreover, compared with the S&P 500, these P/E ratios are in-line with the median. The following graph shows the sample set with P/E ratio vs. Market Cap.
Excluding the one anomaly the relationship seen is that higher market caps roughly correspond to higher P/Es. Nvidia has a market cap over $5.7 trillion with a P/E of 48 while Meta has a market cap of $1.5 trillion and a P/E of 22.5.
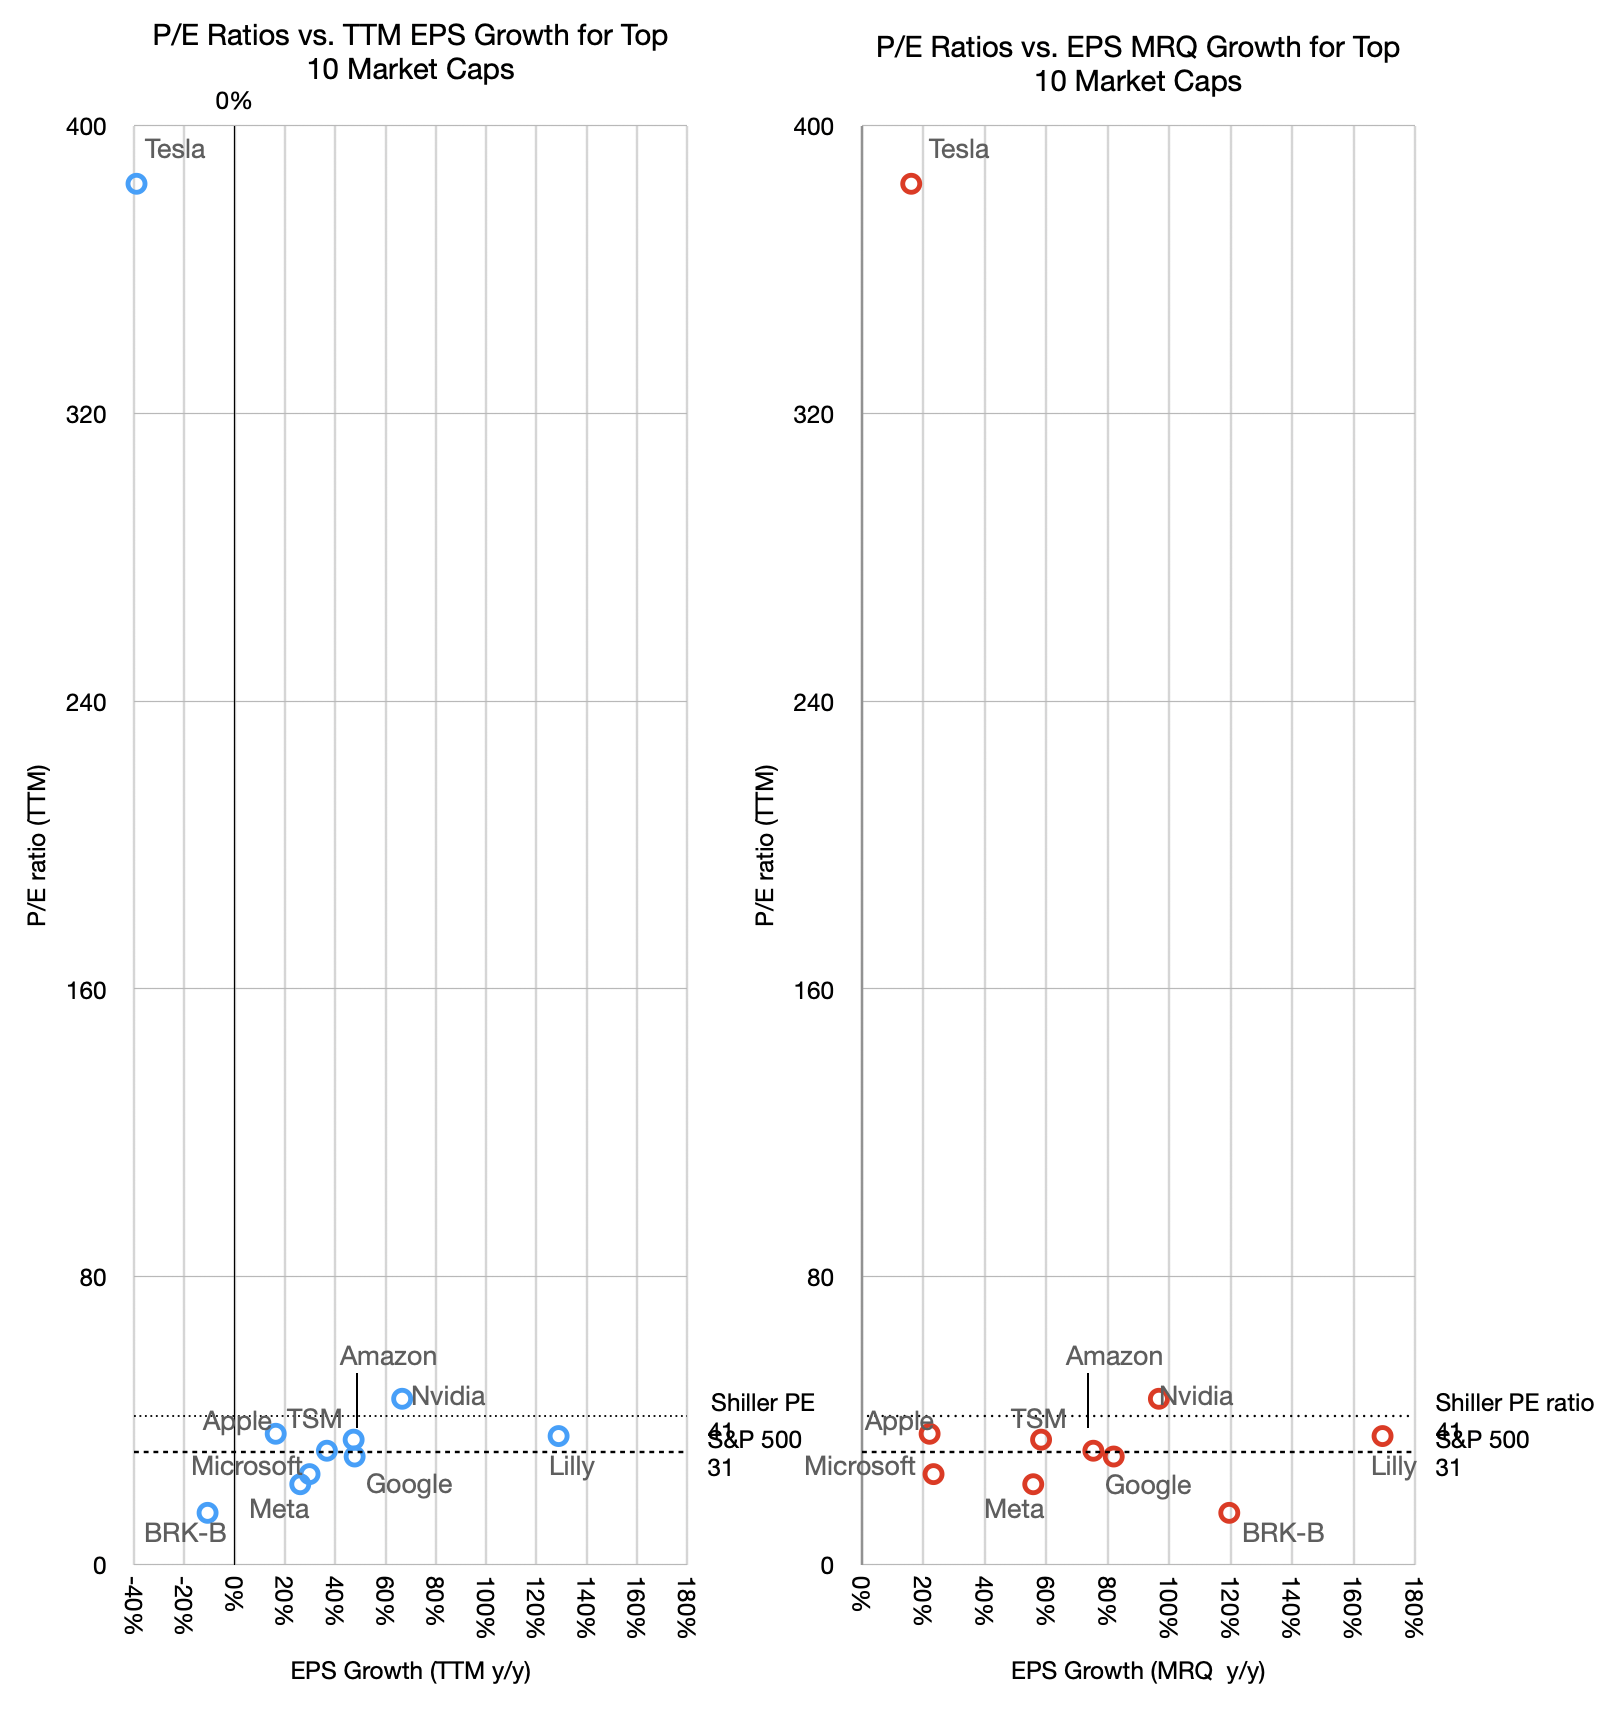
Higher P/Es should also correspond to higher growth rates. The graph below shows the relationship between P/E and growth, both in the most recent quarter (MRQ) and trailing twelve months (TTM).
There is a loose relationship between P/E and TTM growth but not with last quarter's growth. The one anomaly is even more prominent as it shows negative growth with exceptional valuation. Fundamentally however the relationship between P/E and growth is weak. Companies having widely divergent growth show similar P/E ratios. Alphabet for example has seen its P/E ratio in the 20s with growth in the 80s TTM and 50s MRQ.
This might sound familiar. From 2008 to 2020 Apple was trading at a P/E ratio in the teens and low 20s while growing as fast as 80%. The logic was captured by my analogy of the goose that lays the golden eggs. Apple was able to create extraordinary products but the market considered such hits fleeting. It valued consistency over heroism. Getting on base vs. home runs. And so the P/E began to rise only once Services became more prominent. Regardless of how foreseeable this pattern was, it took a decade and is still ongoing for the pricing to catch up.
But the situation with AI companies (that is, all the big tech companies but Apple) is that their earnings today are somewhat an illusion.
An old maxim that says "earnings are an opinion while cash flow is a fact.[3]"
This is because Net income can be manipulated by accounting abstractions, whereas cash flow is based on bank transactions.
To wit: Net income (earnings) is calculated using accrual accounting, which relies heavily on judgment calls rather than bank balances. Companies recognize revenues the moment a contract is signed, even if the cash won't be collected for months. Or they can dial in a delay as they desire.
Because of varying accounting policies, two identical companies with the exact same physical business can report vastly different earnings figures.
Cash flow is objective and simply tracks the actual movement of money in and out of the business. Real dollars either enter the bank account or they don't. A company can look highly profitable on an income statement but still go bankrupt if its cash is trapped in unpaid invoices or unsold inventory.
Finally, cash flow can be strongly negative while earnings are strongly positive. This is because investment in capital equipment does not appear in the income statement.
Therefore true economic value is determined by the cash a company can actually distribute or reinvest rather than how it declares profitability based on accounting abstractions.
AI companies are not necessarily hiding behind suspect earnings but their extraordinary capital expenditures are draining their cash and thus what investors have access to.
Earnings seem to be soaring so the ratio P/E suggests a modest valuation. This is based on opinion or at least incompleteness.
We should look at a better indicator. It's the EV/FCF ratio. We will look at this next.
The top 10 ranking can change rapidly and it makes analysis difficult over longer time periods. The inclusion of LLY and BRK-B allow for visibility outside of the tech sector and they were in the list mid 2025. Saudi Aramco is in a completely different environment influenced by non-economic factors.
TSMC is absent from the table as it is US only companies. It is notable perhaps that of the top 15, three are not US companies (TSMC, Samsung and Saudi Aramco). Furthermore the top Chinese company, Tencent is 25th, valued at $532 billion and the top European company is ASML at 21st and $610 billion.
Apple recently hit an all-time high. Today the stock is trading at a P/E of 35. The P/E ratio is the current share price P divided by the last four quarters’ net earnings per share E. But we also have a pretty good idea of the earnings for the next quarter, ending June (now almost half-way completed). The guidance very clearly suggests that on a one Quarter forward basis the P/E ratio is 34.
I’ve maintained for at least 15 years that a reasonable multiple for Apple is 35. This was mainly because other large cap technology companies were also trading around that number. While at this ratio, if a company is growing at 22% it means that an investor will make their money back in about 10 years. Thereafter all free cash flows will go entirely to the investor’s pocket. That seems a reasonable return. It’s not a particularly risky bet to assume 20% growth for 10 years if you look at (a) history and (b) how many people in the world have not yet started using Apple products and (c) assess how well management is doing their job.
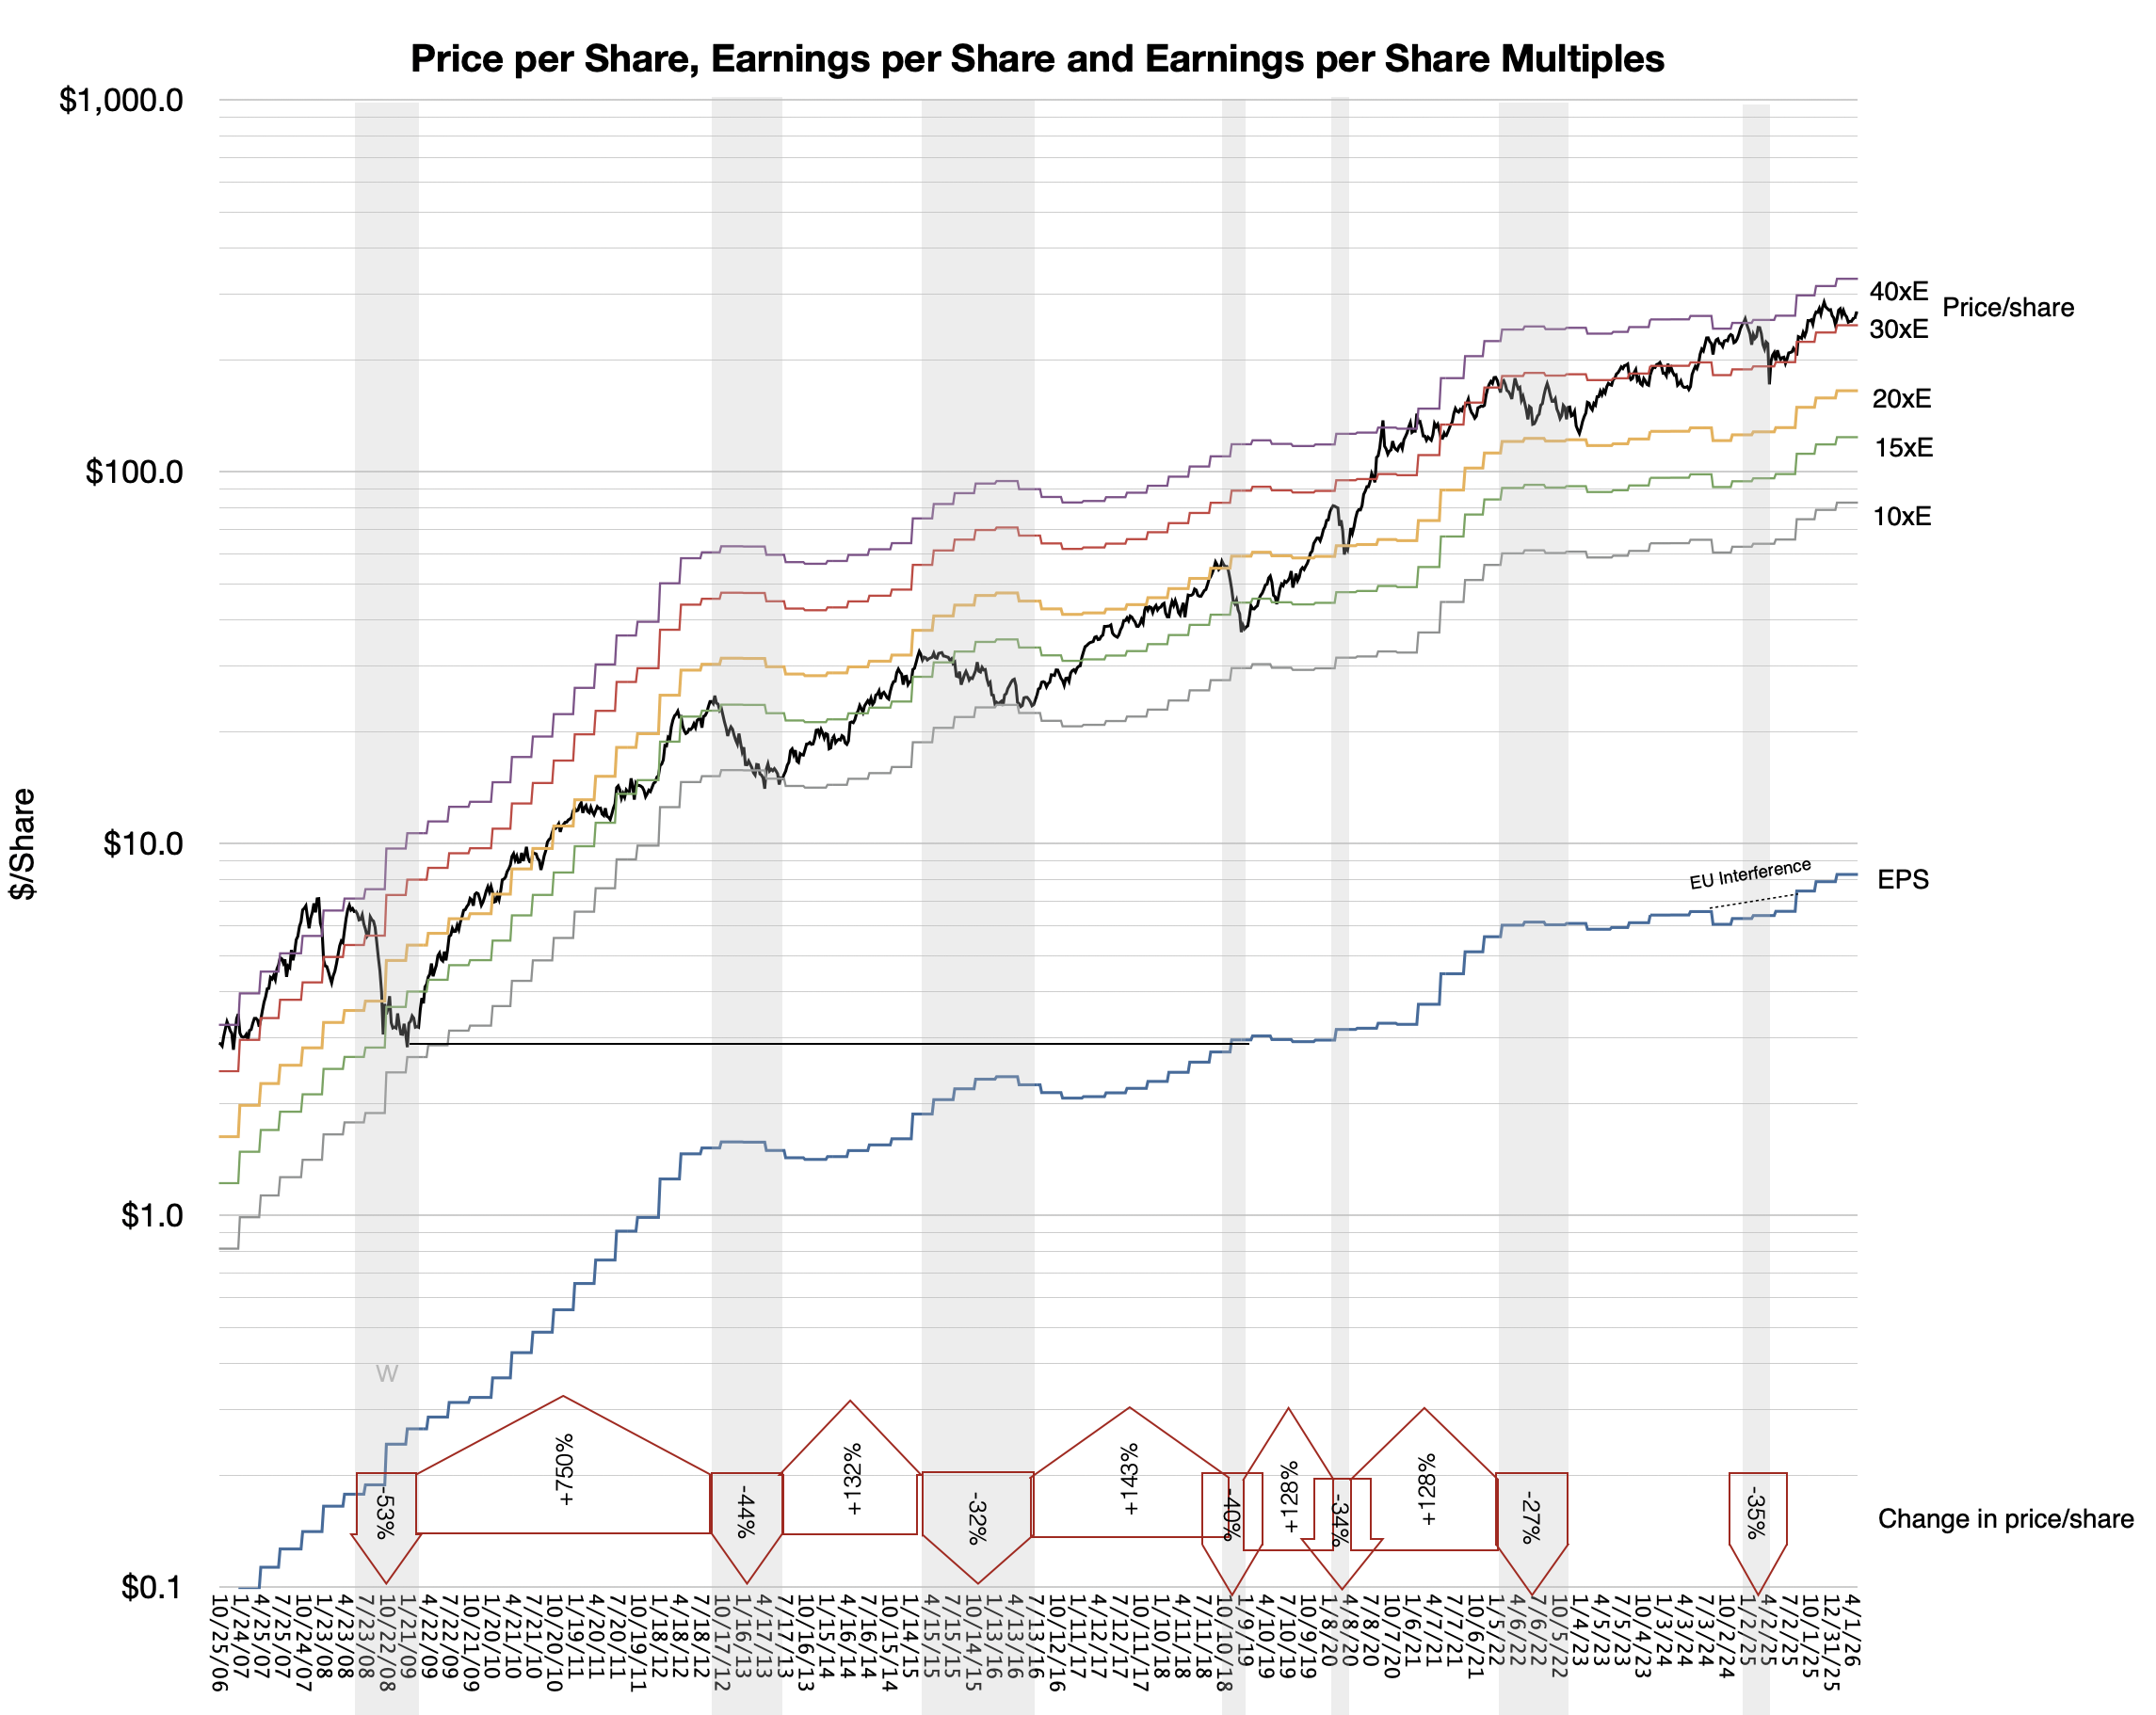
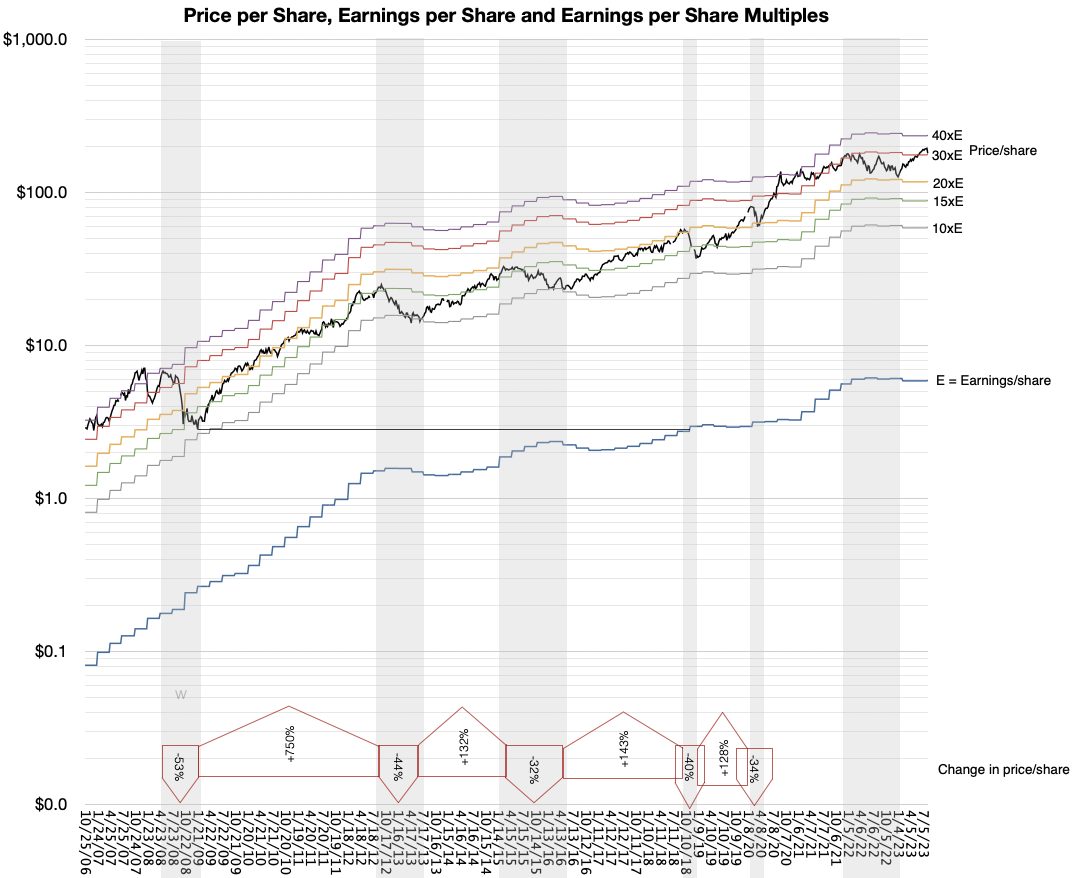
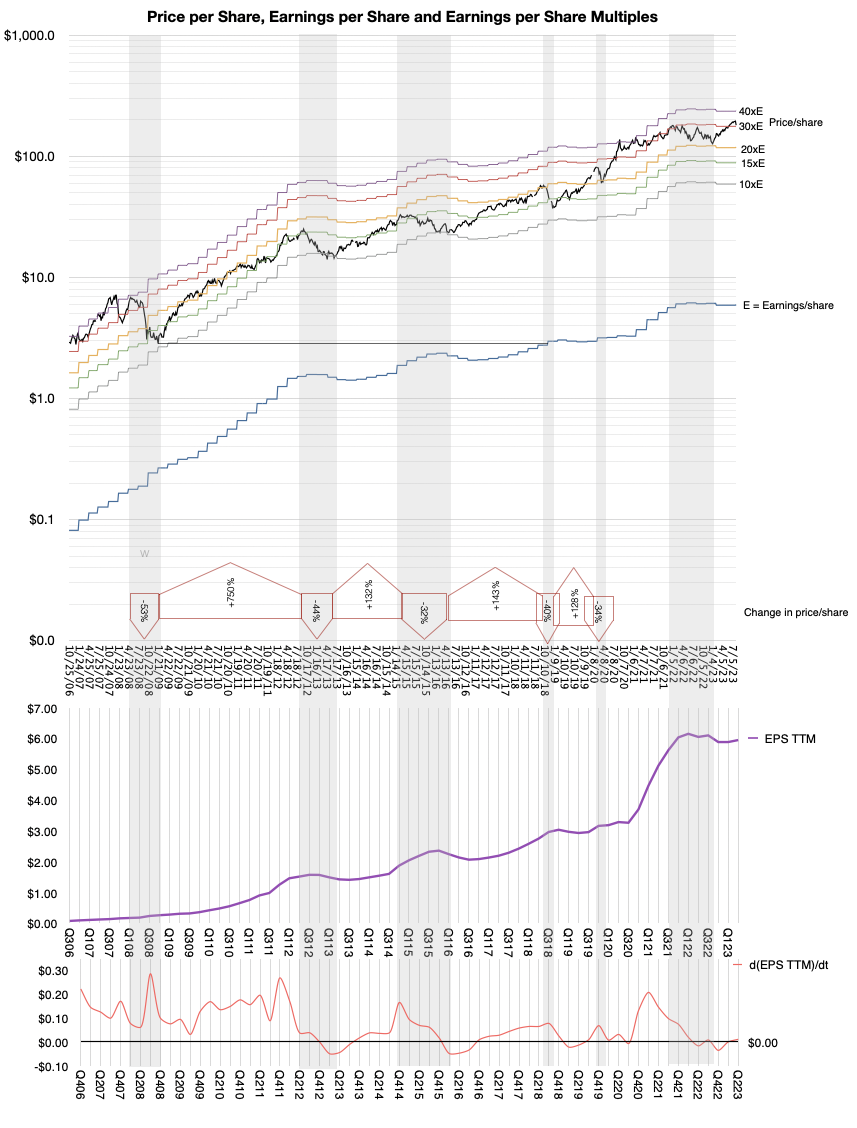
So by this measure, Apple seems to be reasonably priced. Historically it has not been reasonably priced but that is due to the disconnect between understanding the business and falling for the usual false tropes. The following graph shows the share price and where it fell between the bands of Earnings multiples. The grey areas represent periods of significant share price decline.
But much of the volatility of the stock is also due to overall sentiment collapse. That has happened on many occasions, most notably the 2008 financial crisis and “great recession.” (Another was the Covid crisis.) In these cases, regardless of underlying strength, the shares were available very cheaply.
Today perhaps we should ask if a bubble is forming due to exuberance around AI which is inflating the market in unsustainable ways.
There are four reasons why the current asset value explosion is different.
First, it is highly concentrated in a handful of names.
2005 S&P 500 top 10
% of the S&P index
2026 S&P 500 top 10
% of the S&P index
Exxon
3.1%
NVDA
7.8%
MSFT
2.5%
GOOG
7.3%
Citigroup
2.2%
AAPL
6.4%
GE
2.0%
MSFT
4.6%
Walmart
1.7%
AMZN
4.4%
BoA
1.6%
Broadcom
3.0%
J&J
1.6%
TSLA
2.4%
Pfizer
1.4%
META
2.3%
Intel
1.3%
Walmart
1.6%
AIG
1.3%
Berkshire Hathaway
1.5%
Total
18.7%
41.3%
Second it is fueled by equity not debt. Third, it involves disproportionate capital expenditure rather than M&A. Fourth it is accompanies by sharply growing revenues (though not as sharp as investment growth.)
In other words, whereas the equity value is growing rapidly, so is income and investment without leverage. This is a low-debt with high income scenario. Previous crises were high income with high debt (2008) or low income with low debt. (Dot Com).
That’s not to say that we have uniform fair equity values. We need to do quite a bit more due diligence to determine the state of the valuations precisely because we have unusual capital allocation strategies.
To cover this topic I’ll will break the analysis into multiple posts. They are:
Why the most common metrics for valuation are insufficient — the problem with the P/E ratio
What are the alternatives that into consideration exceptional cash and capital expenditures — The EV/FCF ratio
How does the P/E ratio differ from EV/FCF and what does it mean if they diverge one way or another
How do the Mag 7 et. al. appear on these Metrics
How to complement snapshots like valuation ratios with the time series of fundamentals
Why payback measures are the ultimate measure of valuation
What are the current payback measures for the Mag 7 et.al.
Compare Apple to its peer group
Finally assess whether a collapse in confidence is imminent
Please return to these pages in the next few days to read these posts.
Cash flow is a fact, earnings are an opinion and share price is a dream.
A company's total worth is the number of outstanding shares multiplied by their value. This product is called the market capitalization or Market Cap.
That's a simplification. If you want to be more accurate, you should take the Market Cap and net out cash and debt--these are not part of the future flows of cash that can benefit shareholders.
More precisely, there is another measure called the Enterprise Value (EV) which is the total price tag of a company, representing what it would cost to buy the entire business and pay off its debts. EV = Market Cap + Total Debt + Preferred Stock + Minority Interest - Cash and Cash Equivalents.
This is the precise and complete measure of the firm's value but we use the shortcut of Market Cap since In most cases the Preferred stock and minority interest are negligible and if cash equals debt then the result is EV =~ Market Cap. it's easier to calculate anyways as the shares outstanding and share price are easily available. Not so for EV.
To get a sense of how much you're paying for the company it makes sense to divide the Market Cap by the company's Earnings so you get an idea of how many years it will take to get back your investment. When dividing both Market Cap and Earnings by the number of shares it becomes the famous P/E ratio or Price per share / Earnings per share.
But if you want to be fully precise, instead of using Market Cap you should use Enterprise Value. In that case the denominator should be Free Cash Flow or FCF[1]. The ratio becomes EV/FCF. Free Cash Flow is a better measure than earnings because it takes into consideration depreciation, change in working capital and capital expenditures. It measures the actual cash a company generates after paying for its operating and capital expenditures.
EV/FCF takes into consideration unusual situations such as huge amounts of cash or debt or capital expenditures which removes shareholder access to what the company "earns" on paper. This why the adage of "earnings are an opinion but cash flow is a fact" exists.
I used EV/FCF years ago to value Apple because at a time when it held huge amounts of cash. This was before it began aggressively reducing its cash through its capital return program. The P/E ratio at the time was very low but excluding the cash, it was even lower. It was a huge red flag indicating that the company was being priced for liquidation, or as some analyst put it, priced like a steel mill going out of business. If at that time you did not believe that its demise was imminent you would have surely been richly rewarded.
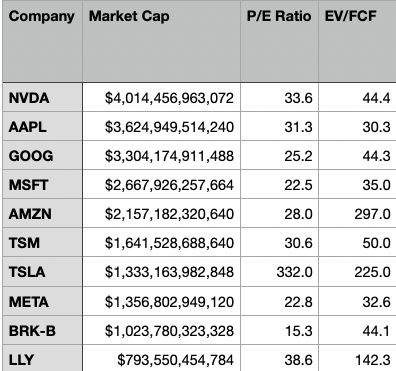
Today the anomaly that throws the P/E off is not Cash but CapEx. And it's not for Apple but for the other mega caps or AI "hyper scalers". Without worrying who is or isn't in the "Magnificent 7" I compiled the largest 10 market capitalization companies and looked at their P/E and EV/FCF ratios. At time of writing:
Company
Market Cap
P/E Ratio
EV/FCF
NVDA
$4,014,456,963,072
33.6
44.4
AAPL
$3,624,949,514,240
31.3
30.3
GOOG
$3,304,174,911,488
25.2
44.3
MSFT
$2,667,926,257,664
22.5
35.0
AMZN
$2,157,182,320,640
28.0
297.0
TSM
$1,641,528,688,640
30.6
50.0
TSLA
$1,333,163,982,848
332.0
225.0
META
$1,356,802,949,120
22.8
32.6
BRK-B
$1,023,780,323,328
15.3
44.1
LLY
$793,550,454,784
38.6
142.3
As recently as six months ago, there was a lot of talk about an AI bubble. Back then I looked at the data then and by looking at the P/E ratios convinced myself that the valuations were not "bubble" level. They were in the mid-thirties. These were not historical high especially when considering the growth these companies were experiencing (over 30%). Since then prices have come down significantly.
This is as the CapEx elephant in the room has been making itself known and there is renewed alarm at the scale of capital spending. This is reflected in the EV/FCF number but not in the P/E number.
The table above shows how much more elevated the EV/FCF ratio is relative to P/E for many of the companies. This "truer" measure of what you are paying as a share buyer is now reflecting in reduced share price and hence reduced P/E.
Of course, this is not true for Apple. Apple's P/E ratio and EV/FCF are nearly identical. To see this more clearly I put together these graphs.
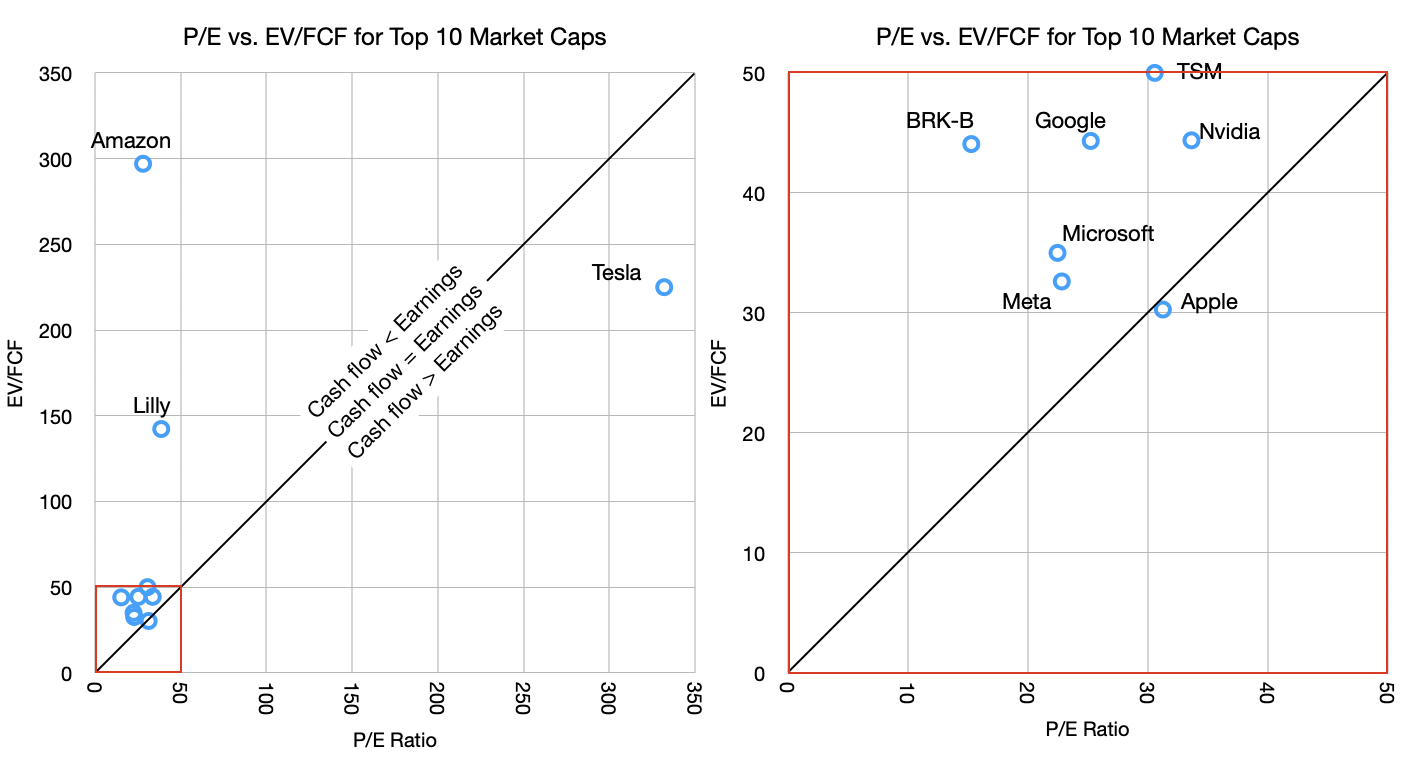
The graph shows the P/E vs. EV/FCF for the companies in the table. The graphs are the same data but the one on the right is zoomed in on the lower left corner (note the red squares).
The reason for the zoom is that there are three outliers. Tesla, Amazon and Lilly. Tesla has absurd valuation on both P/E (300 to 400 range in last 6 months) and EV/FCF while Amazon has an outrageous EV/FCF value due to abnormal capital spending. Basically, Tesla has negligible earnings (and negative growth) while holding astronomical share price and Amazon is spending far above its median on CapEx. Amazon's 10-year EV/FCF is much lower, at approximately 55.
But let's ignore the outliers and concentrate on the other seven in the cluster. These are below 50 P/E and 50 EV/FCF thresholds.
Note that I drew a diagonal line representing the equation of P/E = EV/FCF. This should, under normal circumstances, hold for most stocks. Just like Market Cap should roughly equal Enterprise Value so Earnings should equal Free Cash Flow.
Most companies should not stray too far from this line. But what we are seeing, with the notable exception of Apple, is that most tech companies have cash flow far below earnings. This is again due to the CapEx elephant.
The argument goes that this is a temporary situation with that capital being wisely deployed for returns from AI. Presumably, these companies will swing to the other side of the line, where cash flows will exceed earnings, compensating for the capex that was denied to the shareholders.
This is where the old adage comes into play: Earnings are an opinion but cash flow is a fact. I added to that "and share price is a dream". Take the free cash flow and multiply it by a "dream" and you get the price the market sets. This dream is the multiple.
What makes the AI "bubble" interesting is how it's not fueled by debt[2] but by cash flow. Companies are turning over large portions (almost all and sometimes more) of their cash flows to investing in the dream of AI profits. All but one, of course.
There is something obviously contrarian in Apple's strategy. Perhaps it's not Apple that is odd but rather there is groupthink on behalf of the others. The question of who's right will rest on whether it turns out that AI is going to commoditize quickly or perhaps never, whether AI turns out to be modular or integrated, whether AI exhibits disruptive or sustaining competitive responses, whether it's an infrastructure subject to regulatory corrosion or whether it will migrate to the edge and iterate freely, whether it's a new experience or simply better existing experiences, whether it creates new markets or just makes existing ones more efficient.
These are not new questions. They have been applied to all software and hardware innovations of the last 40 years. We have a lot of history to inform us.
“Given Apple’s free cash flow and we are about to embark on one of its most lucrative product rollouts since the big screen iPhones in 2014 - there is a case for Apple’s stock regaining some ground,” Melius analysts wrote in a note to clients.
Lately, Apple has announced the iPhone 17e and a refreshed iPad Air, a new MacBook Air, a MacBook Pro, new Studio Displays, the MacBook Neo, and an updated version of its over-the-ear headphones, the AirPods Max 2.
Apple shares were modestly higher in premarket trading but have lost some 8% year-to-date. Over the past 12 months, shares have gained 12%.
NB: Free cash flow (FCF) is the amount by which a business's operating cash flow exceeds its working capital needs and expenditures on fixed assets (known as capital expenditures). It is that portion of cash flow that can be extracted from a company and distributed to creditors and securities holders without causing issues in its operations. As such, it is an indicator of a company's financial flexibility and is of interest to holders of the company's equity, debt, preferred stock and convertible securities, as well as potential lenders and investors. It has come recently into vogue when the bill for AI infrastructures has come due...
The table above shows the P/E ratios vs. the EV/FCF ratios of the top 10 largest market caps in the world.
50 already? It seems only a blink of an eye since I wrote Apple at 40. Let's try copy & paste.
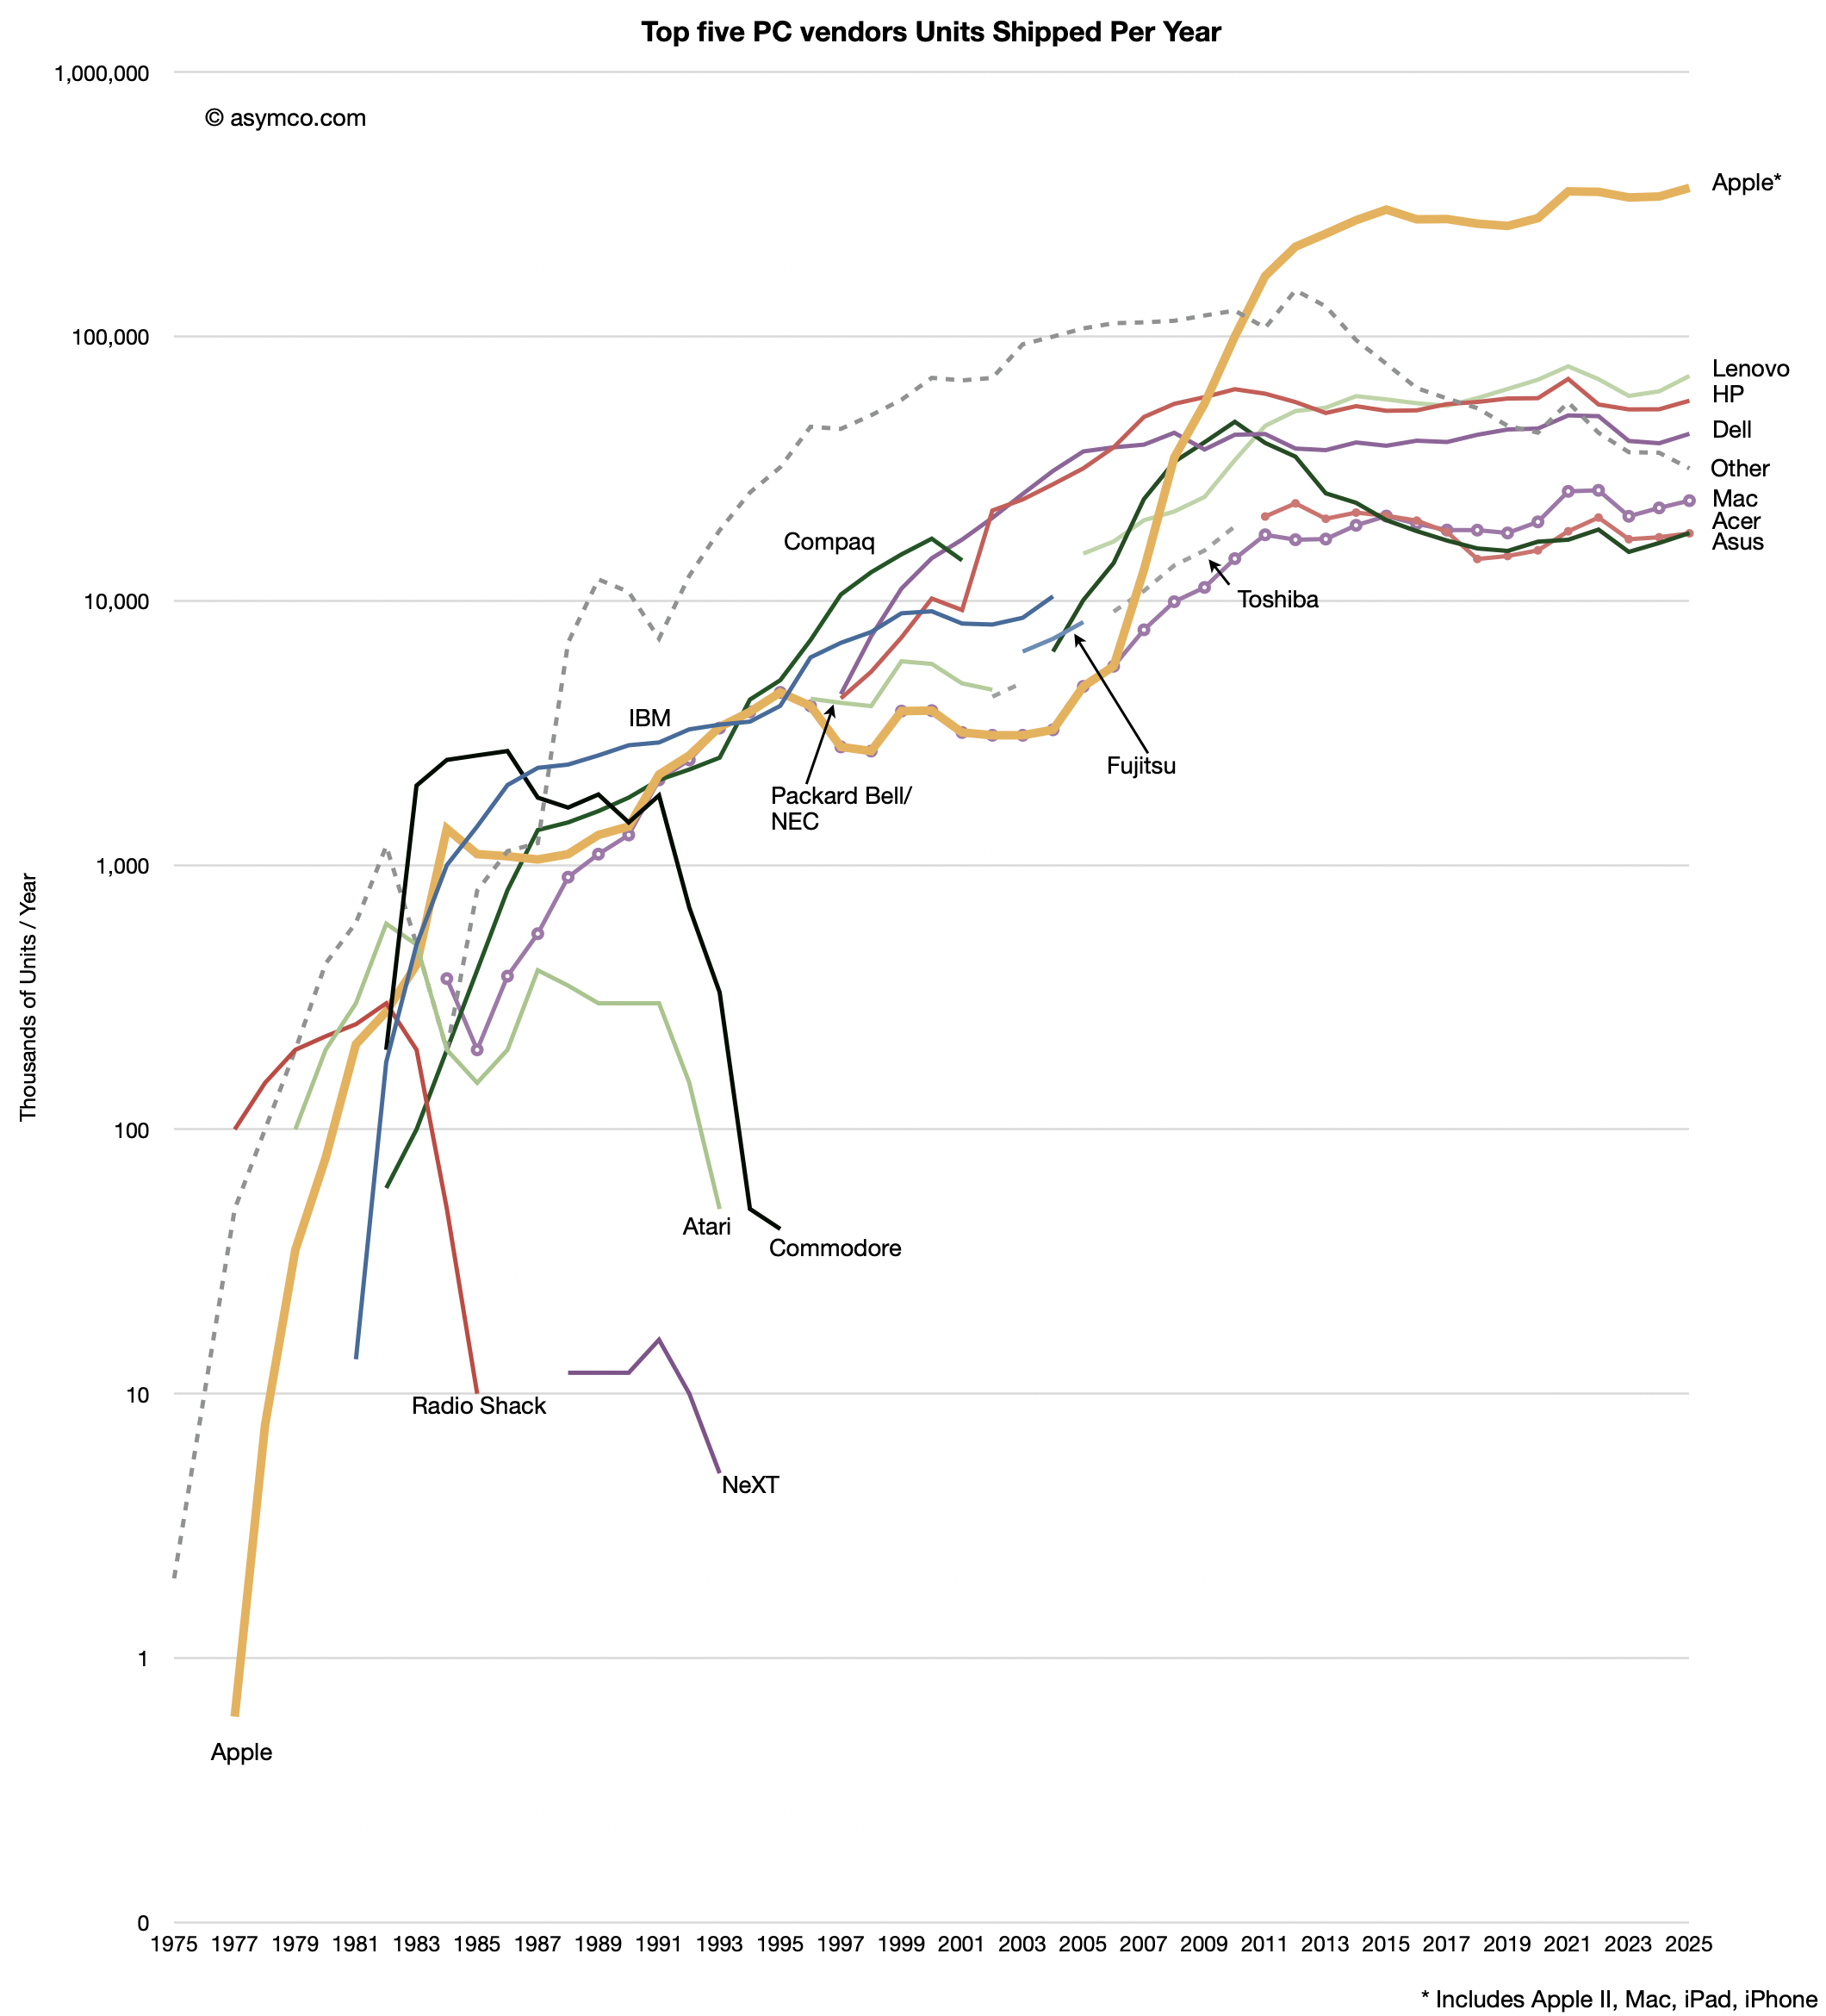
In Apple’s first 40 50 years it shipped 1,591,092,250 5,126,211,000 computers[1].
This shipment total is higher than any other computer company in its first 40 50 years. Actually there are no other PC makers that are 40 50 years old. One computer maker (IBM) is older but they only sold PCs for 24 years and what they still sell they don’t sell in high numbers.
That does not make Apple the top seller in a given year. Looking at only the Mac, Apple’s traditional form factor personal computer, Apple is fifth fourth in market share. If including the iPad, it was the top computer vendor in 2011 and, including the iPhone, it was first in 2009.
The following graph shows the top computer makers by units sold since 1975, a year before Apple was founded. (Click on the graph to see a higher resolution.)
Note that the graph is log scale and in multiples of 1000. Following the yellow Apple line we can see how it started with fewer than 1000 units shipped in its first year to today when it is shipping more than 1 million computers every day[2]. It's also quite remarkable to count how many other companies have come and gone in this top five list and imagine how many came and went in the "other" category.
Who remembers Atari, Commodore, Packard Bell, Compaq? Few said that they were doomed while they were in the running. Going back to Apple at 40,
After having a 40 50 year run and after selling more computers than all American and Japanese computer companies put together, how should we think about the next 40 50 years?
First, clearly Apple shifted from being a “computer company”. It has already changed its name to exclude the word “Computer.” That [came to mean that] it sells devices (which happen to also include computers.) We don't use computers to compute anyway. We use them to make decisions, keep track of things, speed things up and to communicate and to entertain.
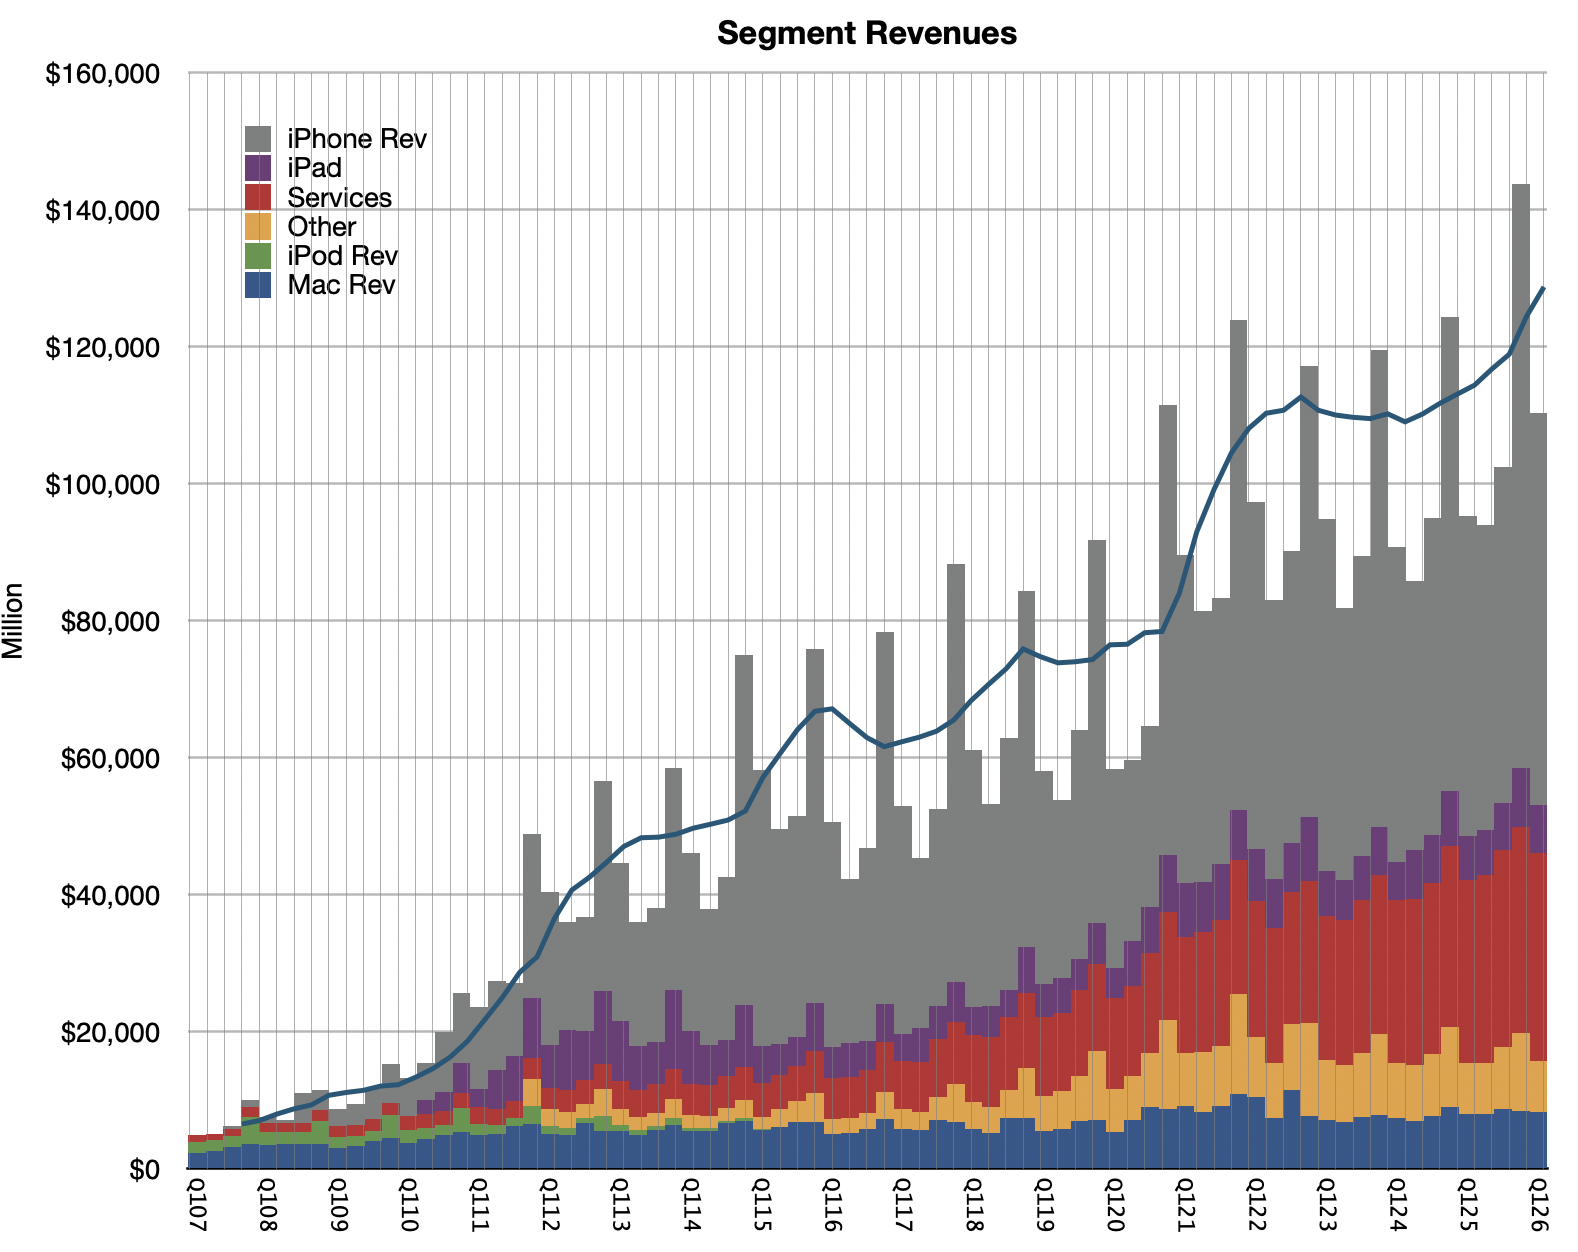
After convincing the world that it's a not just a computer company, the next challenge has been to convince the world that it's also not just a product company. It did so by launching Services as a group (formerly known as iTunes Software and Services) and then separating the financial reporting so that Services can be measured with its own gross margin. Year after year management emphasized Services growth in its commentary. Services has grown into the second largest segment, 26% of total revenues ($112.8 billion out of 435.6 billion in calendar 2025.)
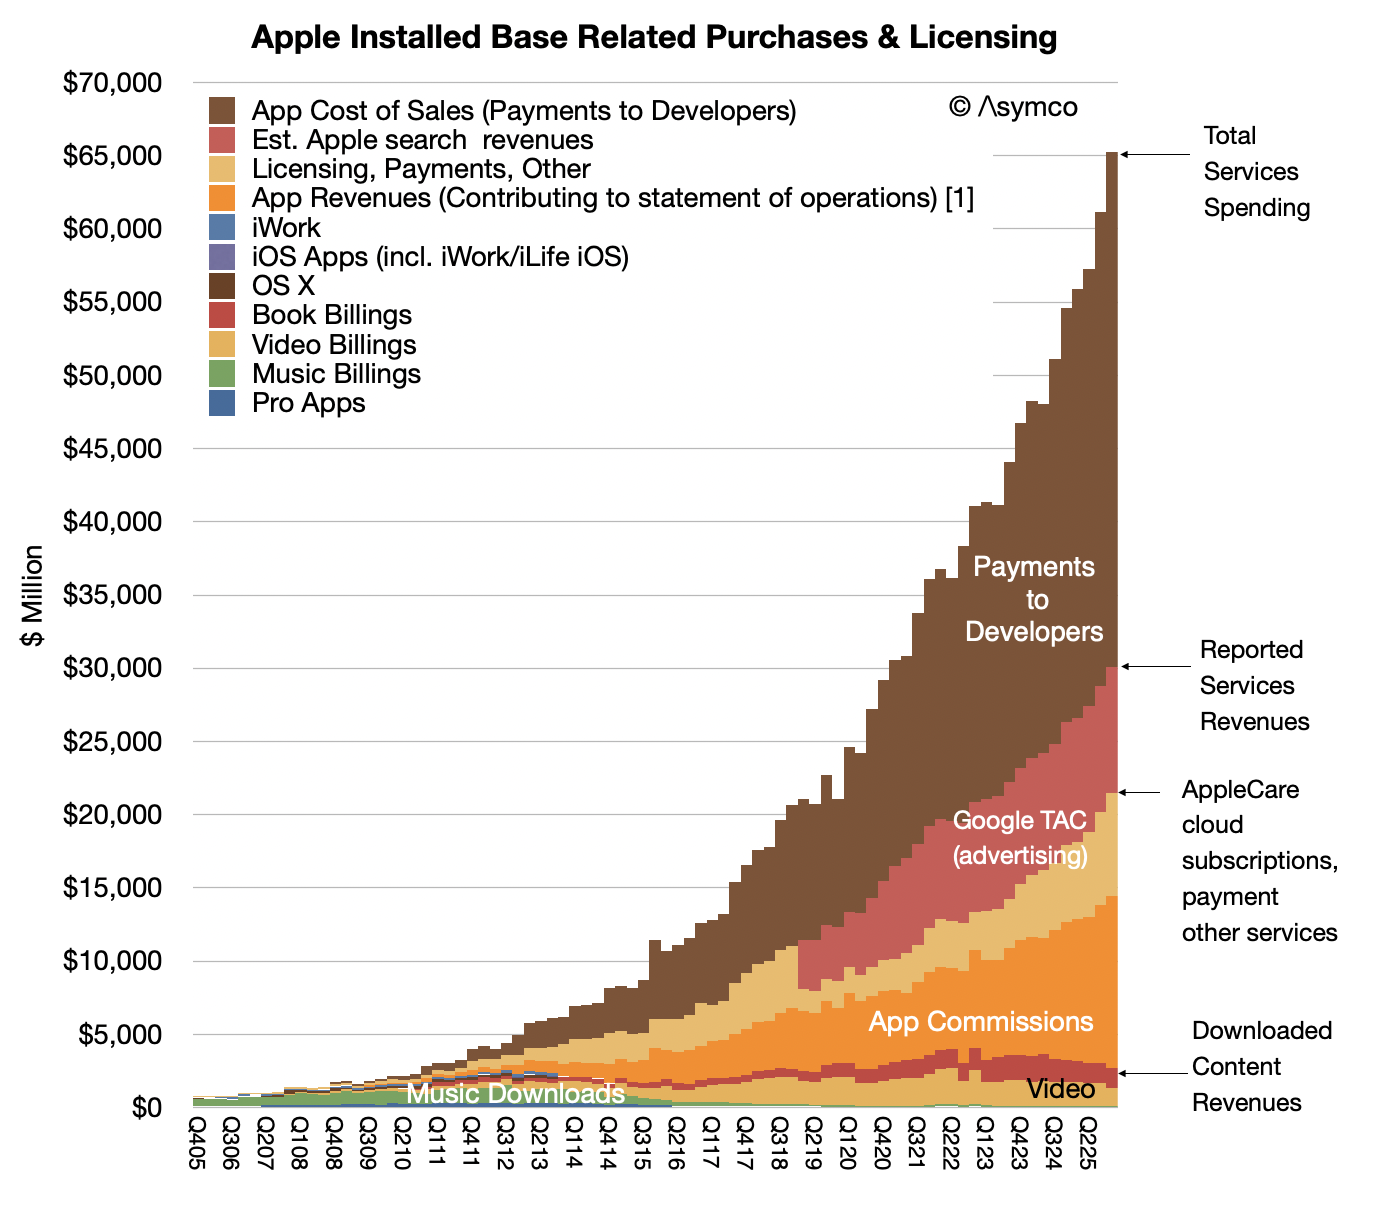
Services, if it stood alone, would be number 40 in the Fortune 500 list of largest companies by sales. It has been impossible to ignore it. Considering how much customers actually spend on Apps, Content and Services, the total is even bigger at $240 billion last year[3]. As a result, some, perhaps most, recognize Apple as a Products & Services company.
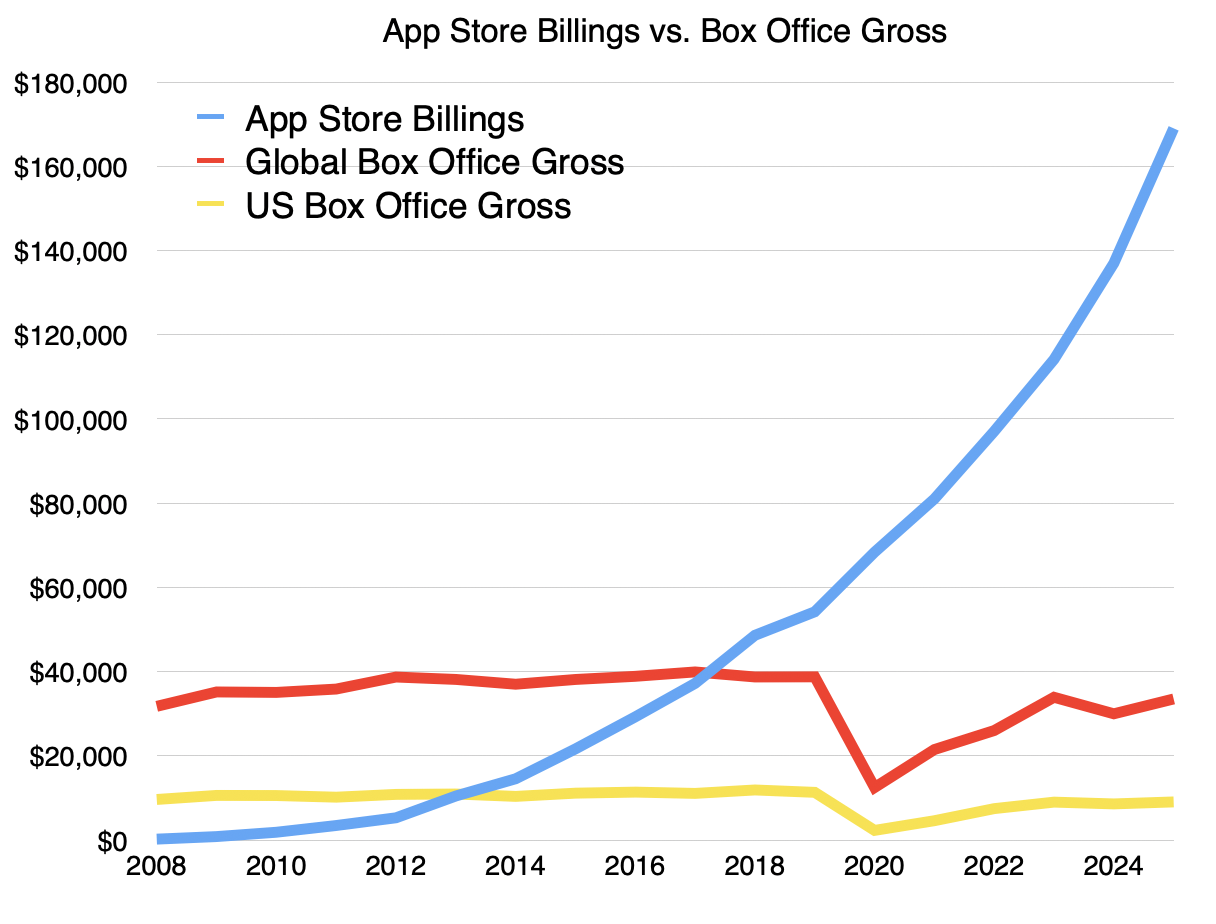
The App store alone attracts $169 billion in spending per year (2025) and that is now 5x what theatrical movie sales bring in world-wide.[4]
So if Apple is today at least a bundle of Products and Services then what will Apple be 50 years from now?
Again from Apple 40:
My simple proposal is to think of Apple as a customer creator. It creates and maintains customers. The more it creates, the more it prospers. The more customers it preserves the more it’s likely to persevere. This measure of performance for a company is not easy to obtain. It’s not a line item in any financial report.
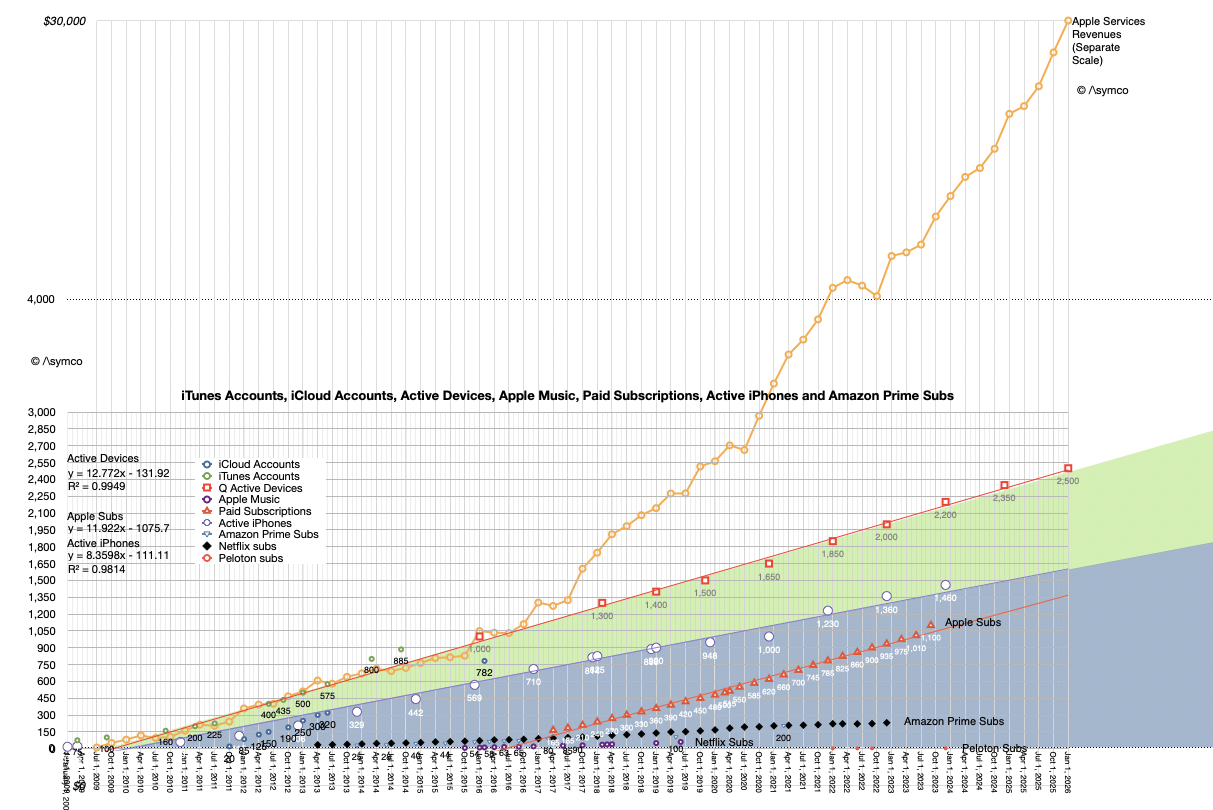
The closest figure we have is that today Apple has one 2.5 billion active devices in use. It has around 1.1 billion users [5]. Using the devices as a proxy, we can say that this audience has more than doubled in the last decade.
So we know that at least Apple has created a large number of customers. Knowing total devices sold and number in use means that we can be sure that 63% of all the computers Apple sold are still in use. This means that most customers are recent customers. Are they going to come back?
If we then factor in the size and persistence of Apple’s audience (customer base) we might conclude that there are factors which will allow it to grow rather than shrink. My analysis based on public data shows that the customer base has been increasing steadily.
And here is a graph showing the size of device base and implications for subscriptions. services and comparisons with other consumer aggregators. Note the forward looking nature of a linear extrapolation of the historical data.
10 years ago, I continued:
Combining the history of customer creation and customer preservation with the value obtained from each customer implies that the next 40 years will be about creating another large tranche of customers whose willingness to spend on whatever Apple creates will be relatively unchanged.
We don’t know the limit. One billion was hard to imagine even one year ago. We might see two billion devices in short order. Perhaps not. Perhaps as we have a multitude of devices about us all day the number will become less meaningful. But if the number of middle class customers grows and as Apple keeps its products within their reach, there is no reason to think that there will be a reversal of the last 40 years in terms of customer acquisition.
This analysis contradicts the current perception of the company as reflected by its stock price. That price assumes the audience will wither ((With a P/E ratio of 11, without a change in revenue per user, the only justification would be the audience shrinking by more than 90% over the next 20 years.)) That is not insanity. It is what we could expect if Apple were unexceptional.
We did see 2 billion. We actually saw 2.5 billion. The assumption of a company in distress as reflected by the P/E ratio of 11 is gone. It's safe to say that Apple is exceptional.
But note that we are only 10 years into that 40 year forecast from a decade ago. Do we still feel confident that the company can last 30 more years given what we've seen so far? If one company could get through the next 30 I would say it is Apple. And if it is so then I think it will get through the next 50.
One more Thing
So, the plan is to make more of the same. It's more than enough.
Including Apple II, Mac, iPhone, iPad and iPod touch; excluding Apple Vision Pro, Apple TV and other iPods. Includes Q1 shipments estimated
2025 shipments were above 364.9 million excluding Apple Vision Pro, Apple TV, Apple Watch.
A Fortune 15 ranking. This would be the case if payments to developers were counted as sales but that is not the case for accounting reasons. As a result Services margins are an extraordinary 76%, on the order of a software only business like Microsoft Office.
As an aside, when I first started tracking this data it was early 2015. The App store had just overtaken US Box Office revenues and the outrage at my comparison and the skepticism that this sustainable was impressive. Much of the outrage was due to my choice of the headline "Bigger Than Hollywood". You can still read the 72 comments. App store billings are now nineteen times bigger than US Box office billings. I still stand by the idea that the App Store is Bigger than Hollywood. It is in fact bigger than many other forms of entertainment combined--more about this later
Stay tuned for a detailed exposition of this audience
On March 5, TheFly reported that Barton Crockett of Rosenblatt Securities increased the price target on Apple Inc. from $267 to $268, maintaining the Neutral rating on the iPhone maker.
Crockett remains positive on Apple following the company’s recent event, in which it launched its MacBook Neo, tapping into the lower end of the laptop market. Apart from that, a lower-end iPhone 17e also adds to the company’s lineup in the budget hardware category. The analyst also mentioned that Apple’s high-end products account for a modest percentage of build-to-order, which could lead to in-line performance with its March-quarter guidance.
On January 30, Reuters reported that, according to the LSEG, Apple expects Q2 FY2026 revenue to increase by 13% to 16%, compared with analysts’ 10% growth rate. Despite strong performance, Crockett highlighted that Apple trades at a meaningful premium.
A majority of 52 analysts out of 54 have rated AAPL a Buy, while only two analysts rate the stock as a Hold. The average price target of $302.5 highlights an upside of over 16%, while Rosenblatt’s price target implies a modest increase of almost 3% as of March 10.
Compared to the aggregate P/E ratio of the 35.76 in the Technology Hardware, Storage & Peripherals industry, Apple Inc. has a lower P/E ratio of 35.21.
Before the iPhone launched in late 2007, Apple was trading consistently at a P/E ratio above 30. Here is a table for the P/E ratio on each Friday's closing price from May to August, 2007. The iPhone launched on June 29, 2007.
Apple's P/E ratio around the iPhone launch
Date
P/E Ratio
5/23/07
31.5
5/30/07
31.6
6/6/07
34.1
6/13/07
33.7
6/20/07
34.6
6/27/07
33.6 (2 days before iPhone launch)
7/11/07
37.2
7/18/07
34.6
7/25/07
34.3
8/1/07
33.3
8/8/07
34.2
8/15/07
30.2
Apple was not super powerful but it was not doomed either. It was a time when the iPod was dominant and the Mac was still alive. iTunes re-wrote the rules of the music industry and debate was raging whether Apple should be considered a media company. Platforms were not its strength but Steve Jobs showed he was still able to distort reality.
These good times did not last. The first year of the iPhone was a period of minimal contribution from the new category with Apple still largely valued on the basis of the iPod. The predictions of failure for the new communications product, especially given its high price, were legendary. It wasn't until 2008 that the iPhone began accelerating and making a meaningful contribution to the bottom line.
It was then, in late 2008, that Apple's valuation broke. The P/E ratio fell from above 30 to nearly 10. The following graph shows the catastrophic 53% share price collapse coupled to the triple digit surge in earnings which led to the P/E ratio tanking.
[The graph shows earnings per share for the trailing 12 months (blue line) and 10x, 15x, 20x, 30x and 40x that value (colored lines). The share price is the black line. The share prices are sampled every Friday. The graph is notably logarithmic. The grey shaded areas are periods of significant contraction. The percent drops/increases during these periods of contraction/expansion are shown in the annotation arrows near the bottom.]
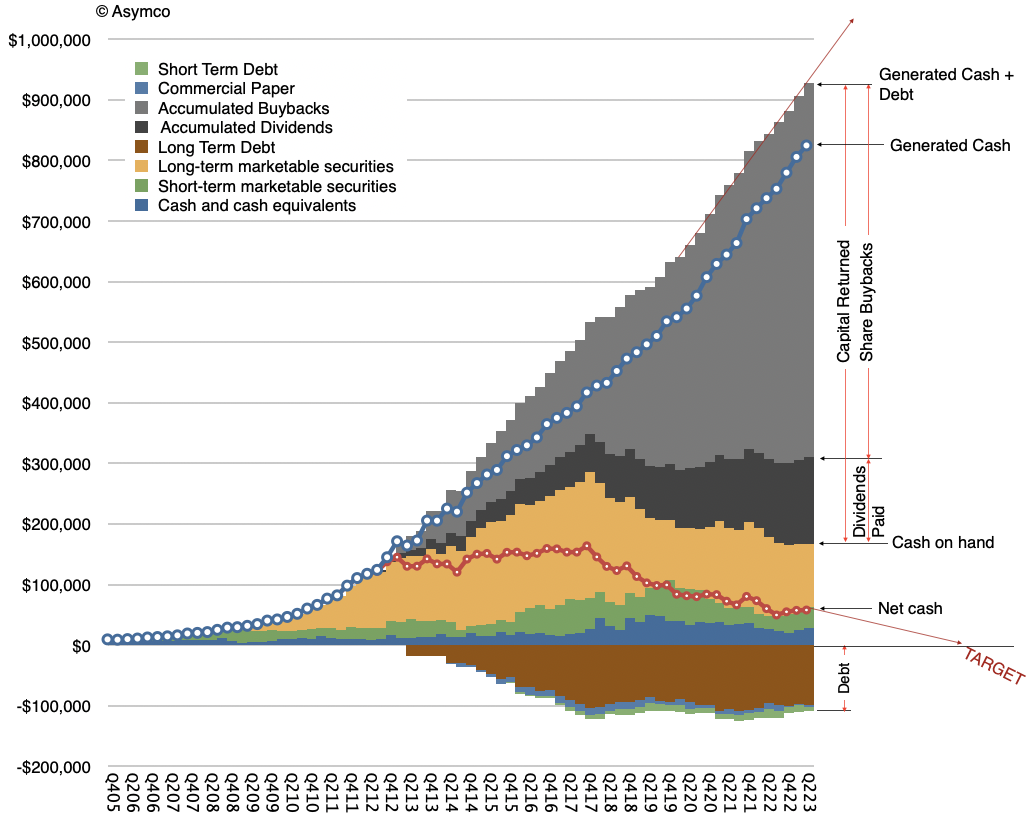
The valuation remained broken for 12 years, between late 2008 and late 2020. This period being, arguably, the most remarkable wealth creation event in history of business. For evidence see the following graph showing the amount of retained earnings returned to shareholders building inexorably toward one trillion dollars. This is not share price appreciation but cash returns. [If you have evidence of a larger wealth-creation event do let me know.]
The creation of $800 billion of shareholder wealth at fire-sale share pricing.
As I explained throughout this period, motivation to dispose of shares which create immense wealth is explained by the fable The Goose That Laid the Golden Eggs but the question some are asking now is whether more wealth can still be created, and if so, can we expect Apple's valuation to collapse accordingly?
I should note that during the long, dark years of wealth creation, other technology companies such as FaceBook, Amazon and Netflix, Google (so-called FAANG) and Microsoft enjoyed far higher multiples than Apple, sometimes 3x higher. This was not seen as abnormal by analysts because those companies were always assumed to have higher growth potential, with a diverse portfolio of opportunities while Apple's growth was perpetually in its past, based on one product.
Paradoxically perhaps, since the Covid-19 pandemic Apple shares have enjoyed P/E ratio roughly equivalent to the other tech companies. For instance, peaking at 42 in January 2021, the P/E ratio has averaged about 27.5 since then. Simultaneously, diversified companies such as FaceBook (now Meta) and Netflix collapsed due to serious business model flaws (based on single sources of income) and Google (now Alphabet) and Amazon have slowed growth and are facing anti-trust scrutiny. Having lost any presence in mobile computing Microsoft has become entrenched in enterprise, finding new businesses in cloud and (possibly) generative AI. As a result of these reversals, the contrast between Apple and the mega-cap cohort has become fuzzy.
So back to the question: does it make sense to price Apple in the 30x P/E or should it go back in the gutter at 10 to 20?
I would argue that the big change in perception hasn't been the surge in earnings during Covid (see graph below). The big change is the realization that Apple is no longer about to go out of business.
How could Apple not be going out of business?
Remember that a P/E ratio in the teens is a clear signal from the market that the company is a questionable "going concern". This is parlance indicating doubt that the company will continue in its present form..
What has changed since 2020 is that even though there were a multitude of crises—from war to pestilence—the eggs kept coming. Perhaps, perhaps, Apple was not doomed after all. In that time it managed to create 1 billion customers. Perhaps having 1 billion customers was a positive outcome. Perhaps counting iPhones during a single quarter was not the only way to value the company. Perhaps having 1 billion satisfied customers made it viable. Perhaps having 1 billion satisfied and loyal customers returning every year was interesting. Perhaps having 1 billion satisfied wealthy customers meant the end is not around the corner. Perhaps having 2 billion active devices in use was sustainable. Perhaps providing services to 1 billion customers using 2 billion devices delivered through 1 billion subscriptions made some sense. Perhaps having all this data in a linear graph made it predictable?
Perhaps. Though Apple provided updates on these figures regularly, the questions everyone asked were still on unit shipments (which Apple stopped providing.) While Services grew at double digits and 70% margins the questions from analysts on conference calls persist on the iPhone and currency or production "headwinds". Perceptions take time to change. They are still changing.
Maybe at this point it's time to agree that Apple's end will not come through being easily replaced by the competition (first Windows then Android, etc.) but by having access to its markets restricted. Being the only American company to have cracked the China puzzle, it's surely vulnerable there. And please don't mention India.
Apple is no longer doomed because it's too weak. It's doomed because it's too strong.
It seems that it's not too hard to believe the end is still near.
Almost a year ago, on March 1st, 2021, I tweeted a snapshot of the "FAANG" P/E ratios. They were:
Netflix: 88.63
Amazon: 73.94
Microsoft: 34.65
Google: 34.75
Apple: 32.89
Facebook: 25.53
Today same companies have the following ratios:
Netflix: 19.34
Amazon: 46.08
Microsoft: 30.17
Google: 22.35
Apple: 27.79
Facebook: 13.67
What a difference 13 months makes. Microsoft and Apple saw modest falls 13% to 16%. Amazon, Google and Facebook saw large falls in their ratios: 38%, 36% and 48%. Facebook (now renamed pitifully as "Meta") in particular saw its valuation collapse by half! This is largely because in February the company forecasted lower than expected revenue growth in the next quarter, blaming privacy changes in iOS, macroeconomic challenges, and the market finally realizing that it's an evil and despicable company.
Microsoft and Apple grew their businesses nicely and have been resilient post-Covid. They are now revenue-reliable "blue chip" tech companies with large user bases that encompass high value, loyal customers. Google and Amazon are a bit more precarious given exposure to macro conditions and unclear new market opportunities but Amazon is still sporting a very healthy 46 ratio which is largely due to its investment-heavy approach to cash flow.
But the star of the show, the real blockbuster, is Netflix. It fell from P/E of 88 to P/E of 19. Even six months ago the P/E was close to 70. What happened?
Remember that P/E is an indication of growth potential. A P/E of 19 implies that the equity should be priced at 19 times last year's earnings, which are roughly indicative of profit in a year and thus P/E is a time horizon: how many years would I wait before I got my investment capital back (and thus break-even).
Well, one could say that a P/E of 13 or 19 (FB or NFLX) is pretty reasonable. It's reasonable to pay that many years' profit for a company. The large ratios only make sense if a company is growing rapidly. 20% to 30% growth can justify P/E of above 20. But what would justify a P/E of 88?
The market has always given Netflix high valuation because it was growing and when the growth stopped the P/E fell to a more reasonable level. Unfortunately that means the share price had to fall over 70% from its peak. More than 40% in two days. Tragic.
The stock peaked at $700 in October and is $221 now. Why were investors betting on high growth, just a few months ago?
I think it was because investors like movies. And the Internet. Investors like movies and the Internet.
Netflix was never a great business. The logic evolved from sending movies as DVDs by email, ordered through an online catalog, to having the same selection available for download (streaming). Everything was subscription-based so bundling gave movies a "binging" consumption option.
But this depended on the having access to good titles. The access was easy at first since Netflix was a new channel and it was a bonus for the movie publisher. Pure margin. But over time the movie publishers saw the new channel eating into existing distribution and they thought they could deliver it themselves, increasing margins. The catalogs were suddenly cut off.
Netflix responded bravely: they would make their own movies. Out came the checkbooks and the distributor became the producer.
Amazing.
But is that really a good business? You have to make movies which are very expensive. Some will be hits, some won't. You thus have to make a lot of them. And then you have diverse demand. People want to have all kinds of genres. So you have to make them all. And what's more you can't really market them as events because they are so numerous. It sounds really hit-and-miss with a huge risk.
At this point you have to raise pricing. And then came the competition who, like Disney, said "we have better, more targeted family content". Or Apple TV+ which simply said "we have better quality." Many other streamers offered alternatives like Amazon Prime with a smorgasbord approach. Sure, households could subscribe to all these services, but the bill would start to be painful. Not much savings over the cable bundle. Netflix increasing price sends many for the exits.
The company then drops a bomb: they feel they can't grow subscribers because they are "near saturation" and the families which are not yet paying are probably using "shared" passwords. It can only grow if it converts the non-payers.
That all happened rather quickly. The market loves movies and the internet and who doesn't. It's just that movies and the internet don't make a great business.
Movies look to be more of a feature of an internet service bundle. That's Apple's approach. They don't see video as a business but as hygiene: must-have something to put in a bundle.
So Netflix, who first unbundled the neighborhood video store, then bundled production and distribution was itself not much more than a substitutable piece of a bigger bundle.
For this reason I always wondered why there was an "N" in FAANG. Netflix always seemed more a transient idea: yes people like movies, as they like music and books and magazines. And producing and distributing media has undergone dramatic change with computing and internet. But a business that only produces and distributes a single media type may be an ok business but should it be put on the same level as platform companies with billions of users?
Netflix has 200 million subs but that is not a big number. Apple distributes 785 million subscriptions to over 1 billion customers. Google has at least 2 billion users, Microsoft about 1.5 billion and Meta is over 3 billion. Netflix says it can't get many more and indeed they forecast losing 2 million next quarter.
It's a bit sad, but reminiscent of the games industry: it has its limits and the limits mean that it can't be seen as a ubiquitous and hence maximally valuable asset.
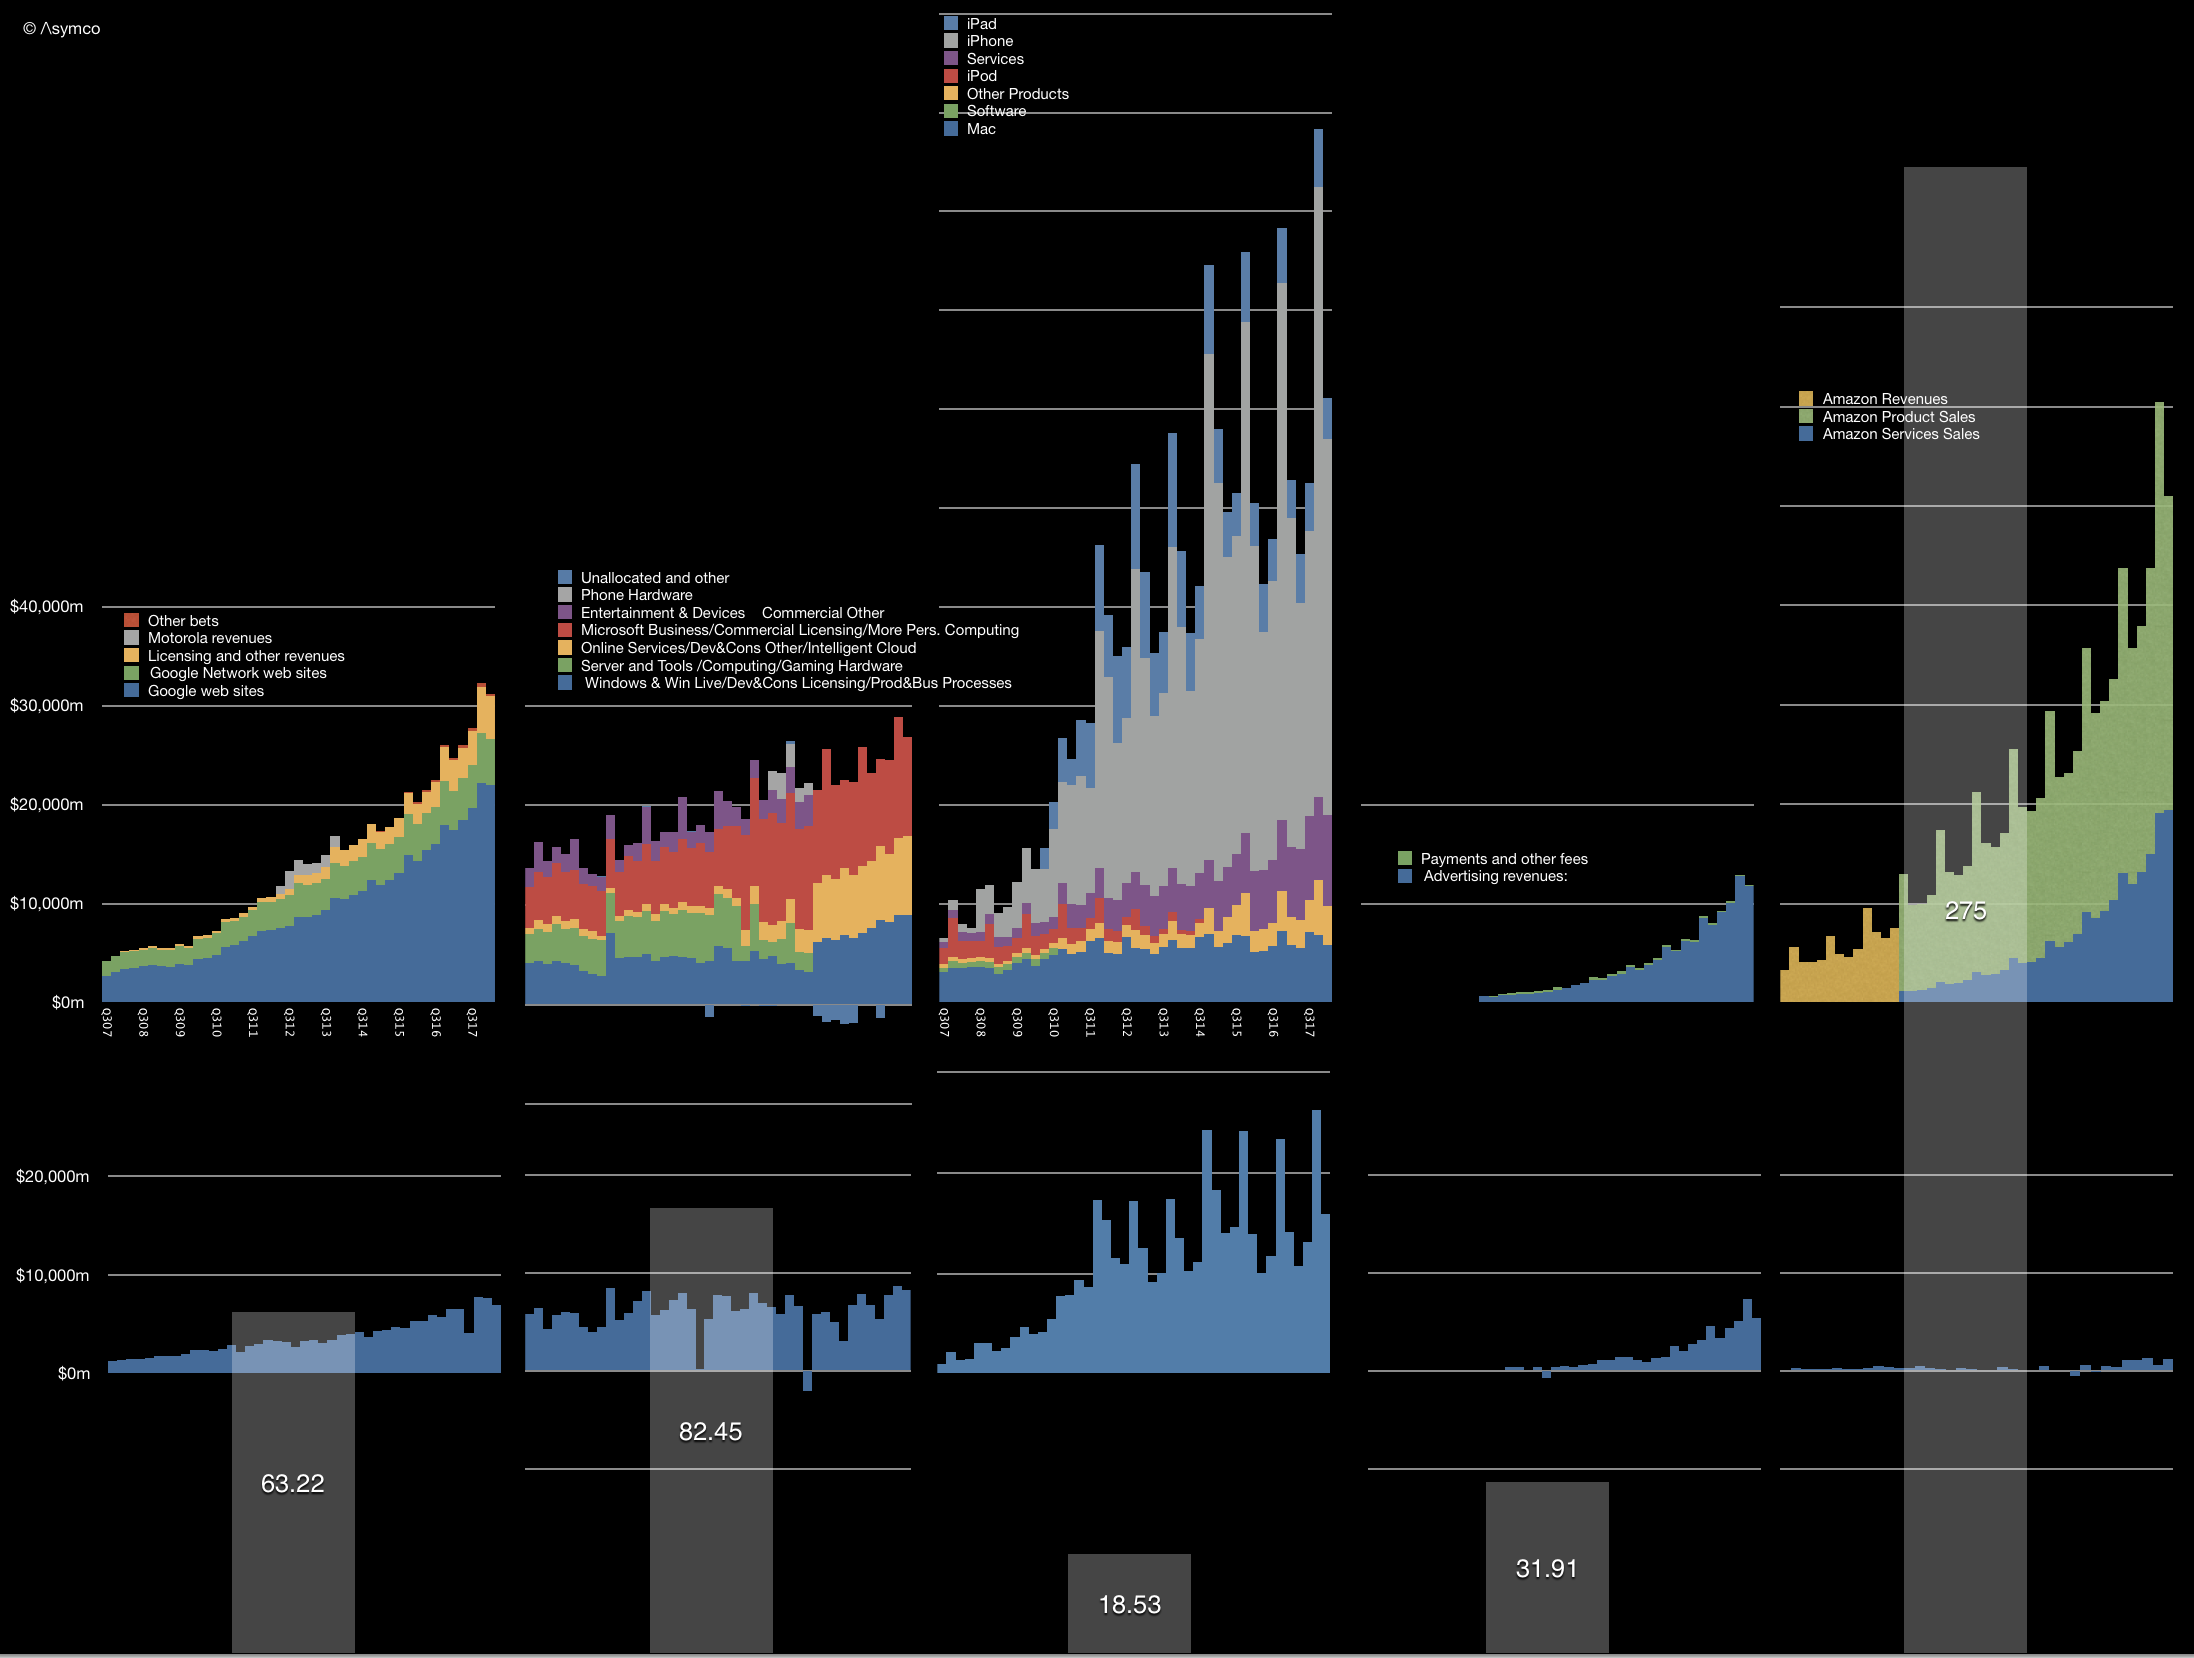
At the latest Apple Summit in Los Angeles the question of Apple's valuation was foremost on many minds. The illustration I used there to discuss valuation is shown below.
It shows the history of revenues (by reported segments) and gross margin for the five largest companies in the world by market capitalization. I have been publishing this illustration for five years ((initially with Samsung rather than Facebook because it was originally a set of "challengers" to Apple. The fact that with only one substitution the illustration turned into a view of the five largest companies in the world was a welcome surprise.)) in order to contrast the growth and perception of value between companies that might be considered comparable with Apple. Thus the graphs show the top and (near) bottom lines of the companies over an epoch of about a decade. ((This being the iPhone epoch))
In contrast with the histories above, there is a price set on the equities today. These prices are captured by the market capitalizations as follows:
Current market cap (billion)
Peak market capitalization (Billion)
Apple
$918
$955
Amazon
$844
$856
Alphabet
$810
$825
Microsoft
$780
$789
Facebook
$584
$589
Market capitalizations are interesting because they show perceptions of value. The traders in the equity are negotiating with each other on what the shares are worth and, as a voting system in a liquid public asset, share pricing is very representative of the perceptions about that asset. Representative because there are literally millions of decisions being made on a daily basis which determine this price.
The sales and profit data in the illustration above is about the past. In contrast the market engine is voting about the future. Any student of finance knows: the value of a company is the net present value of all future discounted cash flows (plus any current assets.)
So what would history have to do with it? What use is the trajectory?
This goes to a deeper question: How does history inform the future? What is the value in knowing previous performance when thinking about future performance? The common caveat in mutual fund prospectuses is "Past performance is no guarantee of future results". We are repeatedly warned of this because it is within our nature to look at history and recognize patterns. But beware! At least beware those whom you might entrust with your fortune.
But consider that it's conventional wisdom to also say that culture and preparation are the best ways to ensure a prosperous future. Ask athletes or coaches and they will say that practice and dedication lead to success. Sports fans know that a team or player with a record of success is more likely to succeed in the future. In this way sport is, in many ways, a simulation of reality. Which is why it's so popular: a metaphor of life teaches as well as entertains.
Knowing how to read ability as well as conscientiousness are keys to scouting talent. Again, it's not a guarantee, but in various fields of human endeavor the past does predict, with high accuracy, the future.
This relationship between past and future is what education is based on. We spend our lives preparing and training ourselves and our children and their children with the implicit hope that this leads to better outcomes for everyone. We establish a pattern of success because it is the best predictor of future success. Practice, learn, commit, defer satisfaction, trade time for knowledge, fight, lose and try again. These are the qualities we look for in the past of individuals when assessing their potential for the future. Culture is everything, we are told. Build a track record, we tell the young.
So what does this have to do with valuation?
We can't easily measure the cultures of persistence and perseverance in companies. Grit, guts, stoicism, fortitude, courage, the Finnish "sisu". These are not measurable in financial reports. Yet our language is as filled with words to describe character and our financial reports are empty of them.
It's left to investors to work it out. The exercise of relating the future to the past is the calculation of the ratio between Price (future) and Earnings (past). A high P/E ratio suggests repeated success from past success. A low P/E is a disbelief in a future repeating the past.
The P/E ratio thus allows us to say to what degree recent past performance is repeatable. I.e. how many `last years' can we expect in the future. A P/E of 1 means a company is worth what it earned last year. A P/E of 10 means it is worth ten years' proceeds. ((We could easily calculate P/E for more than one year but the default is one year.))
This P/E ratio is shown for the five companies above as the overlaid bars in the graph above.
Sure, you say, but it depends on the industry and circumstances. A future divorced of the past is more likely in an environment where there is rapid, chaotic change. The more volatility in fundamentals, the more uncertainty. Technology is changing rapidly and therefore it's quite possible that Apple's low P/E reflects this disconnect.
If so then what about its peers? Why would Apple be subject to different technological risk than other technology companies? All of the top five companies are considered "tech". Indeed, Apple is perhaps the least technologically oriented as it has a brand and consumer orientation. It operates hundreds of stores, and sells design as much as it sells algorithms. It fundamentally tries to deconstruct human needs and package those needs in products.
Alphabet, Microsoft and Facebook primarily don't "sell" to end-users. The revenues come from businesses in the form of advertising or licensing. They don't have support staff, interacting with people who buy what they use. They need to understand needs but they trade other things. And Amazon offers AWS to enterprises as its own unique product. Other than AWS it operates a marketplace, acting as an intermediary.
Apple is a consumer company depending on consumer tastes as a brand. This is more typical of a non-tech company in a boring business of consumer brands.
But it's not valued as either a tech company or a consumer company. Both have typically higher P/E ratios. In fact, Apple's P/E ratio is lower than the S&P 500 and has been below that level for almost the entire history of the iPhone, regardless of growth rate.
A track record of hit products and the stability of a brand seem to be of no value. Perseverance, consistency and stability are not valued. If it were an athlete with a track record of world-record performance and a spectacular reputation with the public, it would not be granted an above-average pay for its performance.
In the past I've argued anti-fragility as a cause. In the context of the other companies, Apple is at the center of perceived vulnerabilities and is thus perceived as vulnerable . The other four are at the center of no competition and perceived as invulnerable. And yet Apple, so far, has survived. So have the others, but apart from Microsoft, they are much younger. I argued that Apple exhibits anti-fragility and has unrecognized robustness. Perhaps Warren Buffet now agrees and this is encouraging to the thesis.
Yet, at an even deeper level, in Apple's valuation we see how culture is not valued. How the idea of character assessment is not applied to businesses. How ethos is unquantifiable and thus discounted. How markets, accustomed to weighing things, reflective of collective human judgement, demonstrate that we are woefully incapable of valuing that which matters most.
Oscar Wilde famously said that the cynic knows the price of everything and the value of nothing. Here's to the sentimentalist, because at the end of the day those who change the world know the value of everything and the price of nothing.