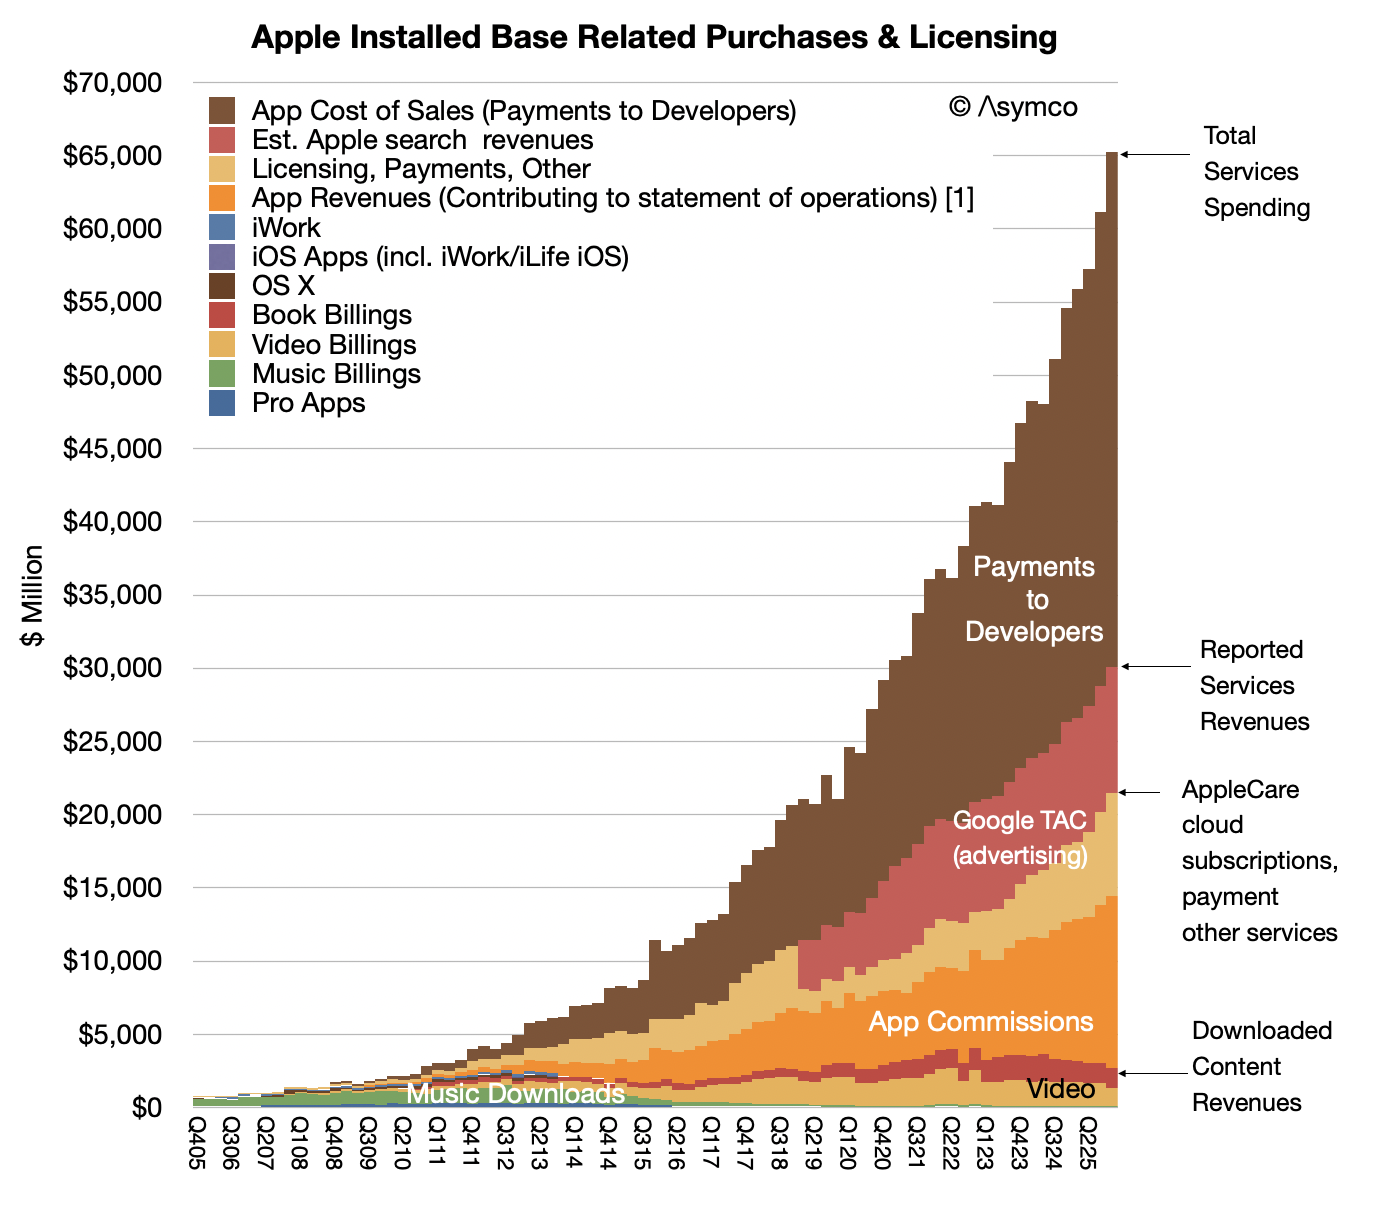
Recording and transcript of the June 9, 2026 Asymco One Office Hours, recorded the day after Apple's WWDC 2026 keynote. Horace Dediu shares his impressions of the event and takes questions from Asymco One subscribers.
Morgan Stanley analyst Erik Woodring believes Apple’s upcoming Worldwide Developers Conference could begin to change that perception. The 5-star analyst reiterated his Overweight rating and $330 price target, arguing that a successful AI strategy could unlock a higher valuation for Apple stock, with a bull-case scenario reaching as high as $440 per share.
He noted that Apple’s recent strength has been driven by its products and services business rather than AI. However, companies viewed as “AI winners” have often earned higher valuations over the past two years, and Woodring believes Apple could soon be seen as one of them.
Why WWDC Could Be a Turning Point for Apple
Woodring believes Apple now has more of the tools needed to compete in AI. He pointed to Google’s Gemini models supporting Apple Foundation Models, Apple’s strong focus on privacy, and what appears to be a renewed push around Siri and Apple Intelligence. Unlike many of its rivals, Apple is not spending heavily on building AI infrastructure. Instead, the company can use its massive base of iPhone, iPad, and Mac users to bring new AI features to consumers. That approach could help Apple grow its AI offerings without the huge costs faced by some competitors.
The analyst also sees an opportunity for Apple to help ease some of the industry’s AI capacity constraints. A more capable Siri and improved Apple Intelligence platform could bring AI tools to millions of users through Apple’s existing ecosystem.
For investors, the bigger story may be valuation. Woodring believes that if WWDC shows a clear path for Apple’s AI plans, the stock could earn a higher multiple. In that scenario, he sees shares reaching $365 to $385, with a bull-case valuation of as much as $440.
Why the most common measure for valuation is inadequate in an age of AI
Software and services companies like Google, Microsoft, Amazon, Meta are spending on Capital Expenditures at the rate of heavy industry manufacturing. This defies their description as "asset light" business models which depend on services, distribution or platform economics.
The problem isn't just semantic. It is that for their entire existence, these companies were valued for their profitability and measured in terms of a P/E ratio and earnings growth. The situation has changed dramatically. Their revenues are up, the earnings are up and growth is up and share prices are way up. But not their P/E ratios. Why is this?
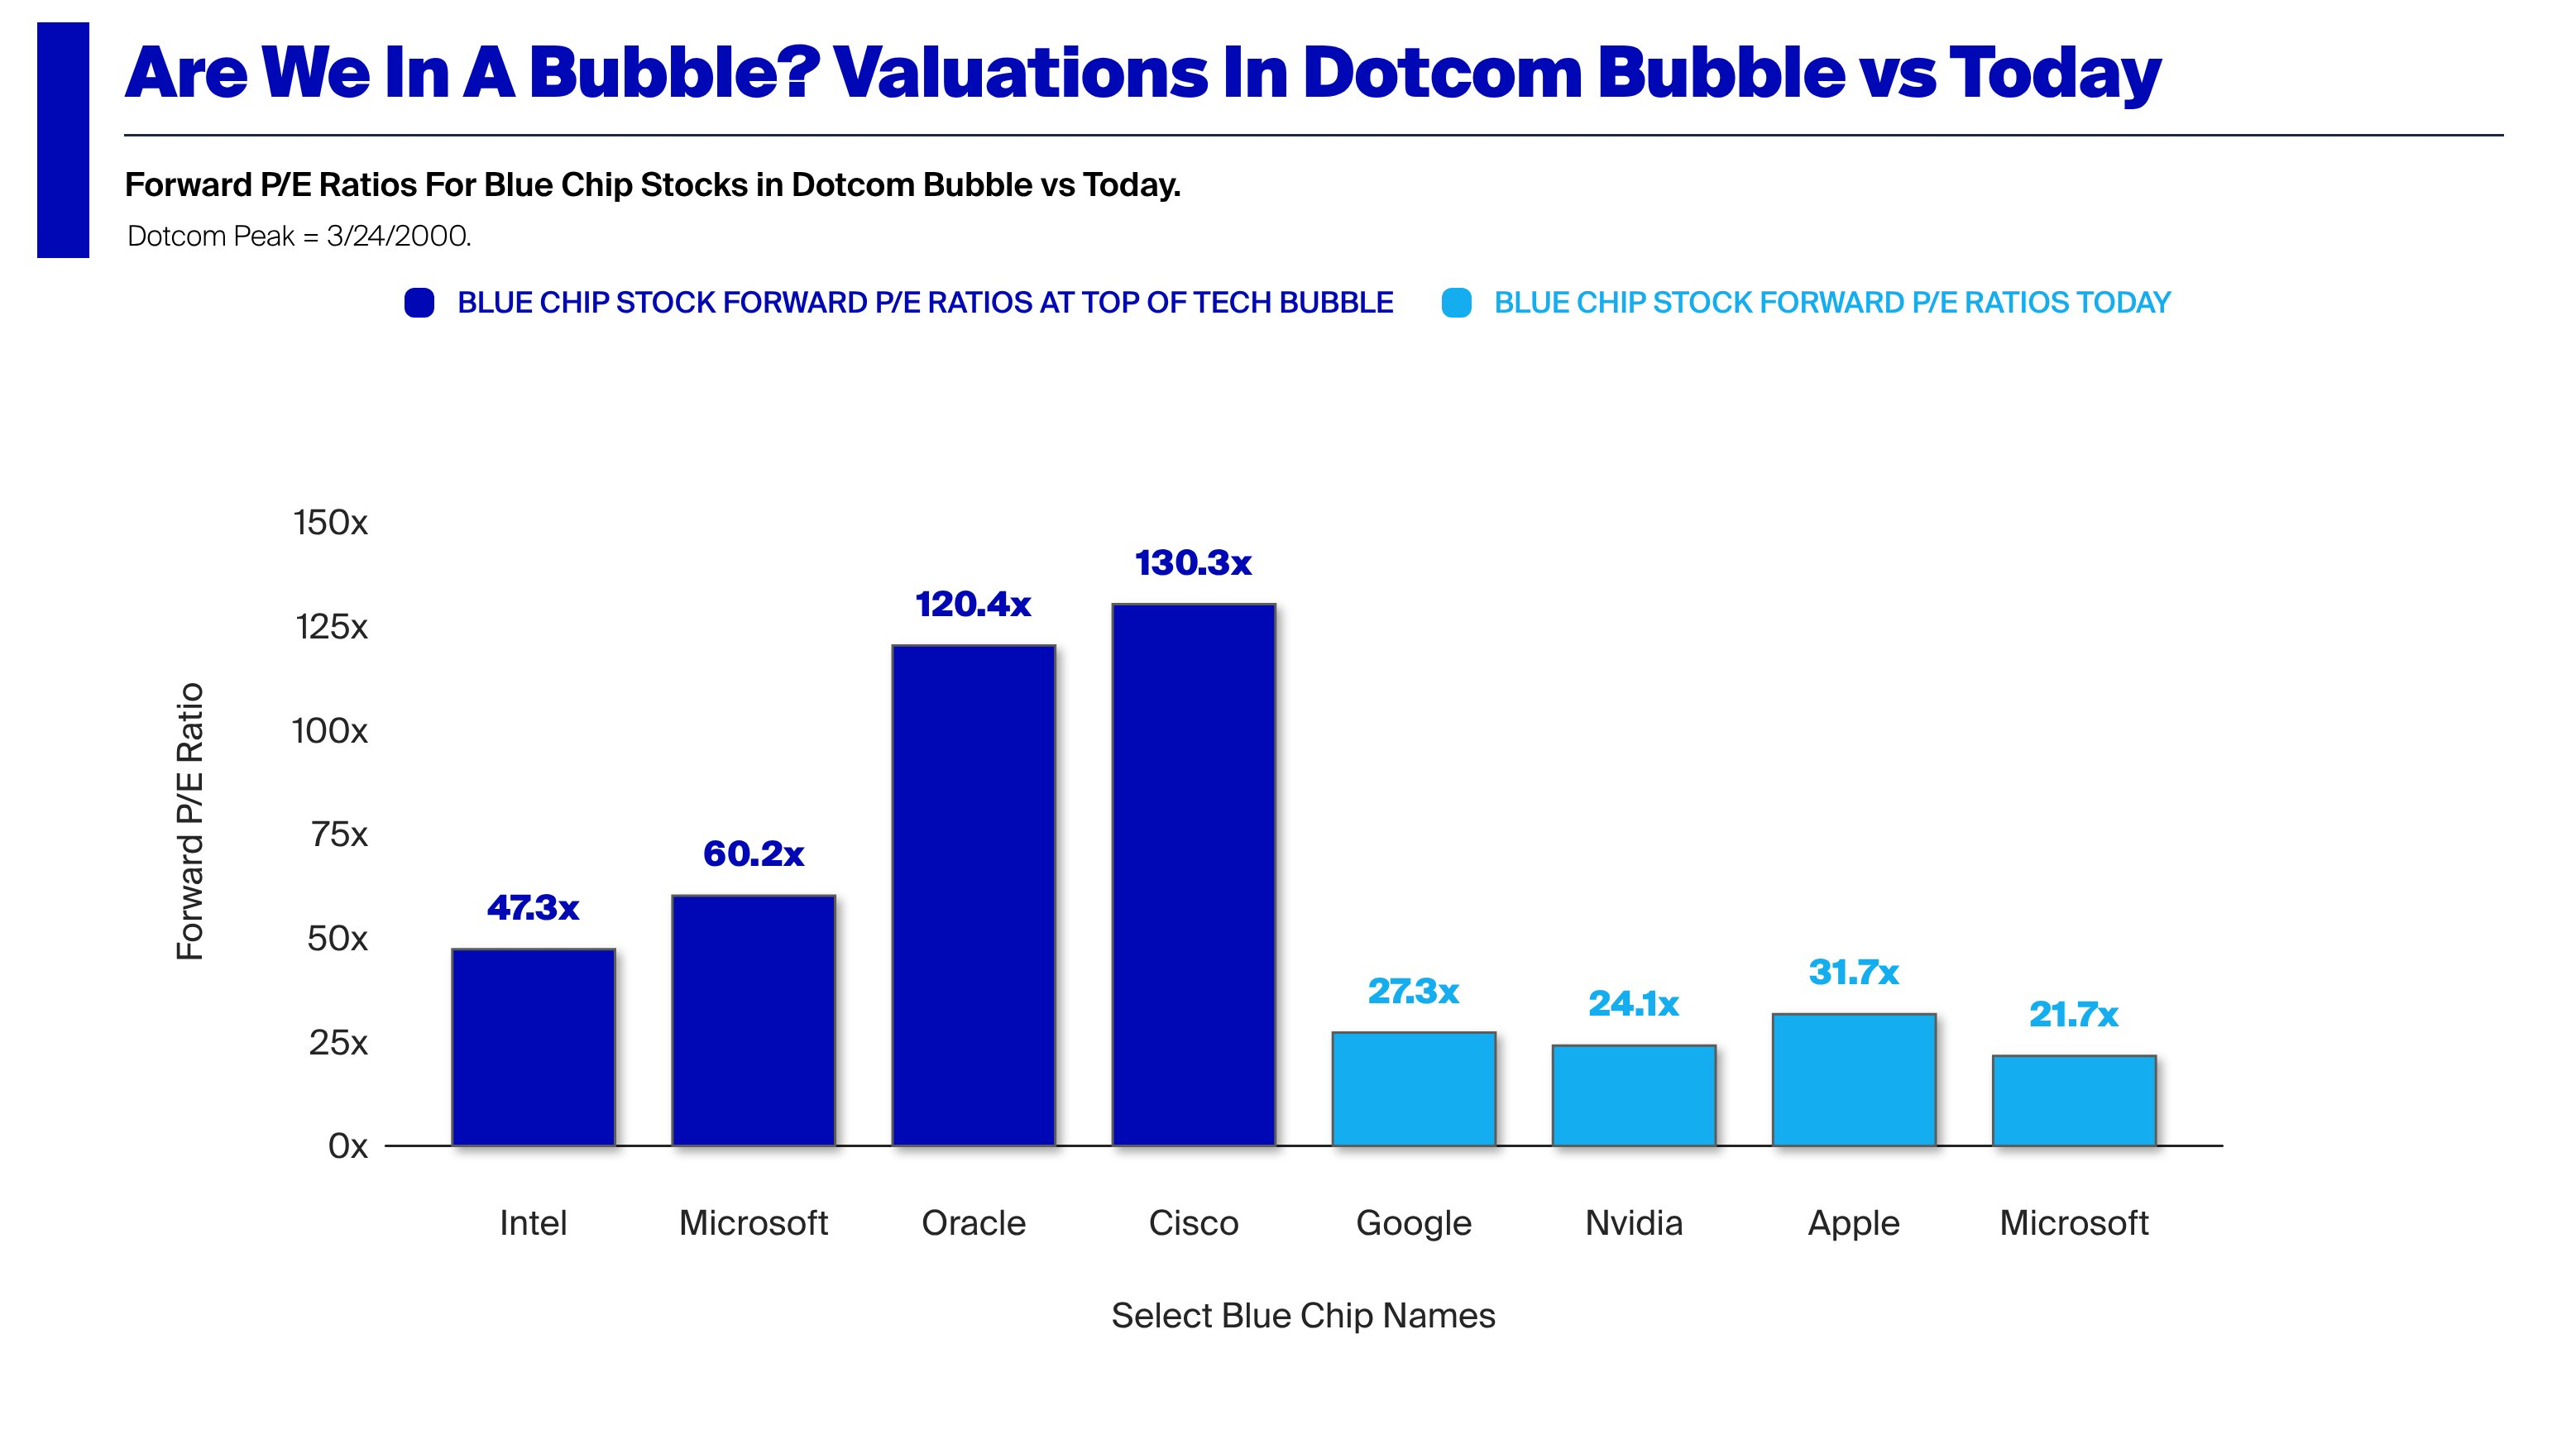
Consider the graph below showing the (forward) P/E ratios of the Dot Com market leaders vs. the market leaders today.
This even as share prices and value concentration have risen even faster than in the Dot Com era. Seen from the P/E basis, it does not look like we are in a bubble. Earning growth is way up so the share prices are not outrageous on that basis. That is contrary to 1999 when P/E ratios in the hundreds were considered normal. Expectations of an internet fueled boom were speculative. Expectation of an AI earnings boom seem well founded.
But these companies could still be over-valued. The P/E ratio is not the full picture. It is in fact a simplifying shortcut which ignores significant pockets and omissions of value.
For this analysis I'll use a sample including some of the largest market caps in the world with two exceptions. The exceptions are Lilly (LLY), Berkshire Hathaway (BRK-B) which are on the list but not in the top 10 (though in top 15) and Saudi Aramco and Broadcom which are in the top 10 but not on the list[1].
Company
Market Cap
NVDA
$5,709,746,405,376
AAPL
$4,379,916,369,920
GOOG
$4,811,891,146,752
MSFT
$3,041,424,048,128
AMZN
$2,874,514,866,176
TSM
$2,166,463,135,744
TSLA
$1,664,912,326,656
META
$1,569,837,154,304
BRK-B
$1,044,046,610,432
LLY
$897,716,060,160
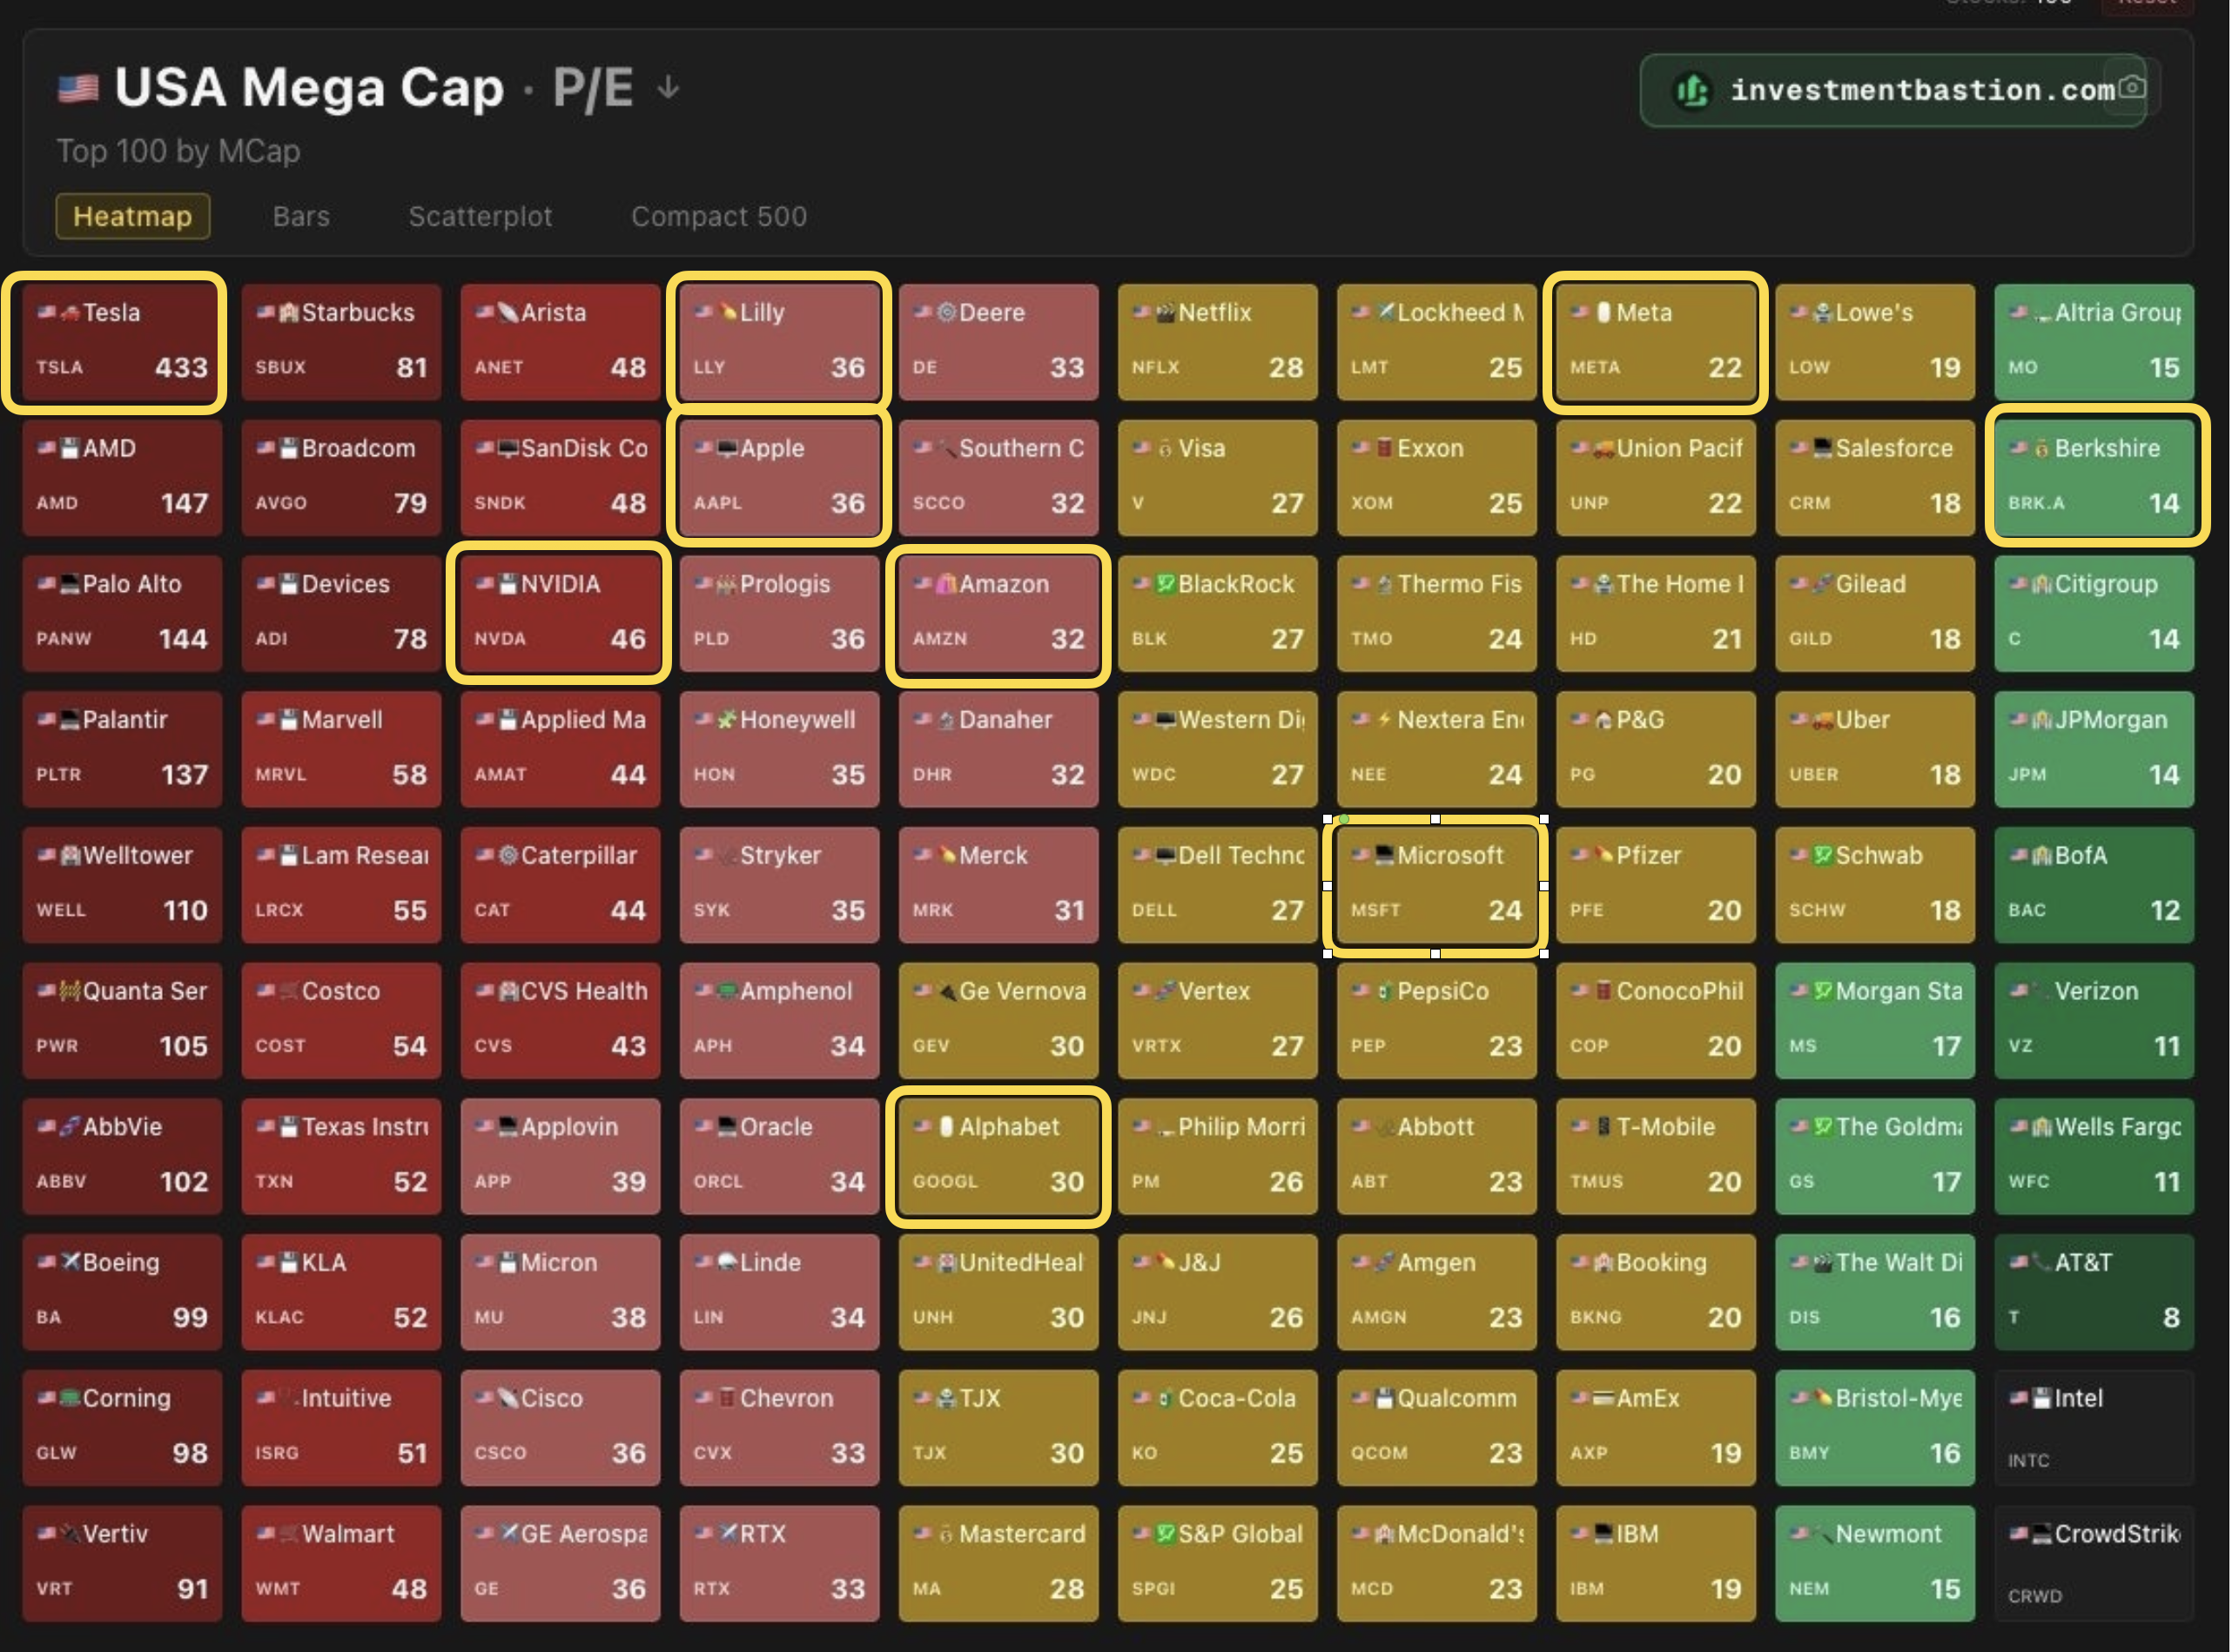
The following diagram shows the P/E ratios of the sample relative to the top 100 US market caps[2]. Note that, with one exception, the companies are not in the dark red zone with above P/E of 60. The exception is, of course, Tesla, which, at P/E of 400+ is 14x the average multiple.
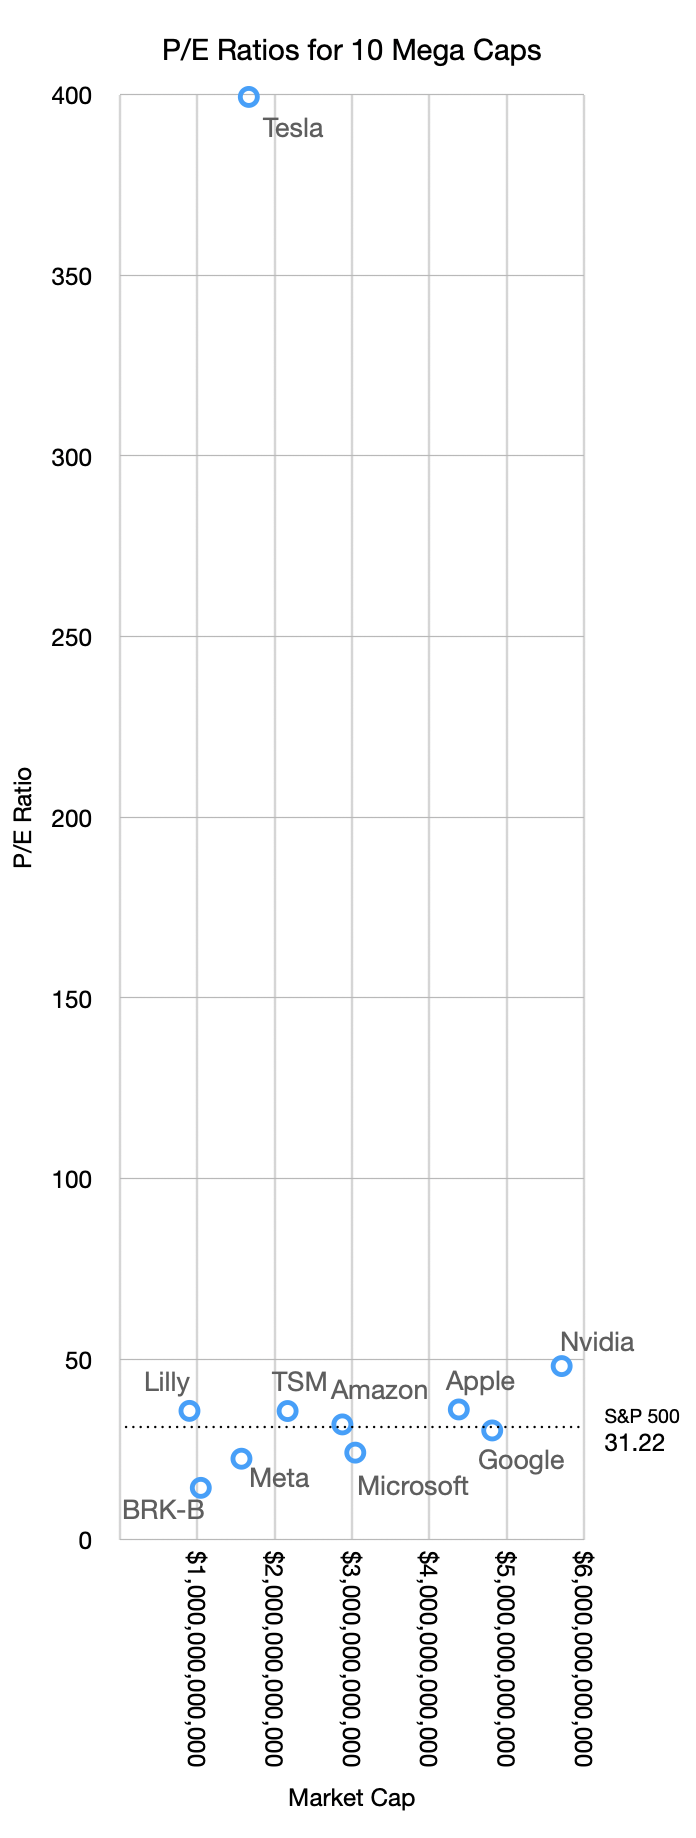
Moreover, compared with the S&P 500, these P/E ratios are in-line with the median. The following graph shows the sample set with P/E ratio vs. Market Cap.
Excluding the one anomaly the relationship seen is that higher market caps roughly correspond to higher P/Es. Nvidia has a market cap over $5.7 trillion with a P/E of 48 while Meta has a market cap of $1.5 trillion and a P/E of 22.5.
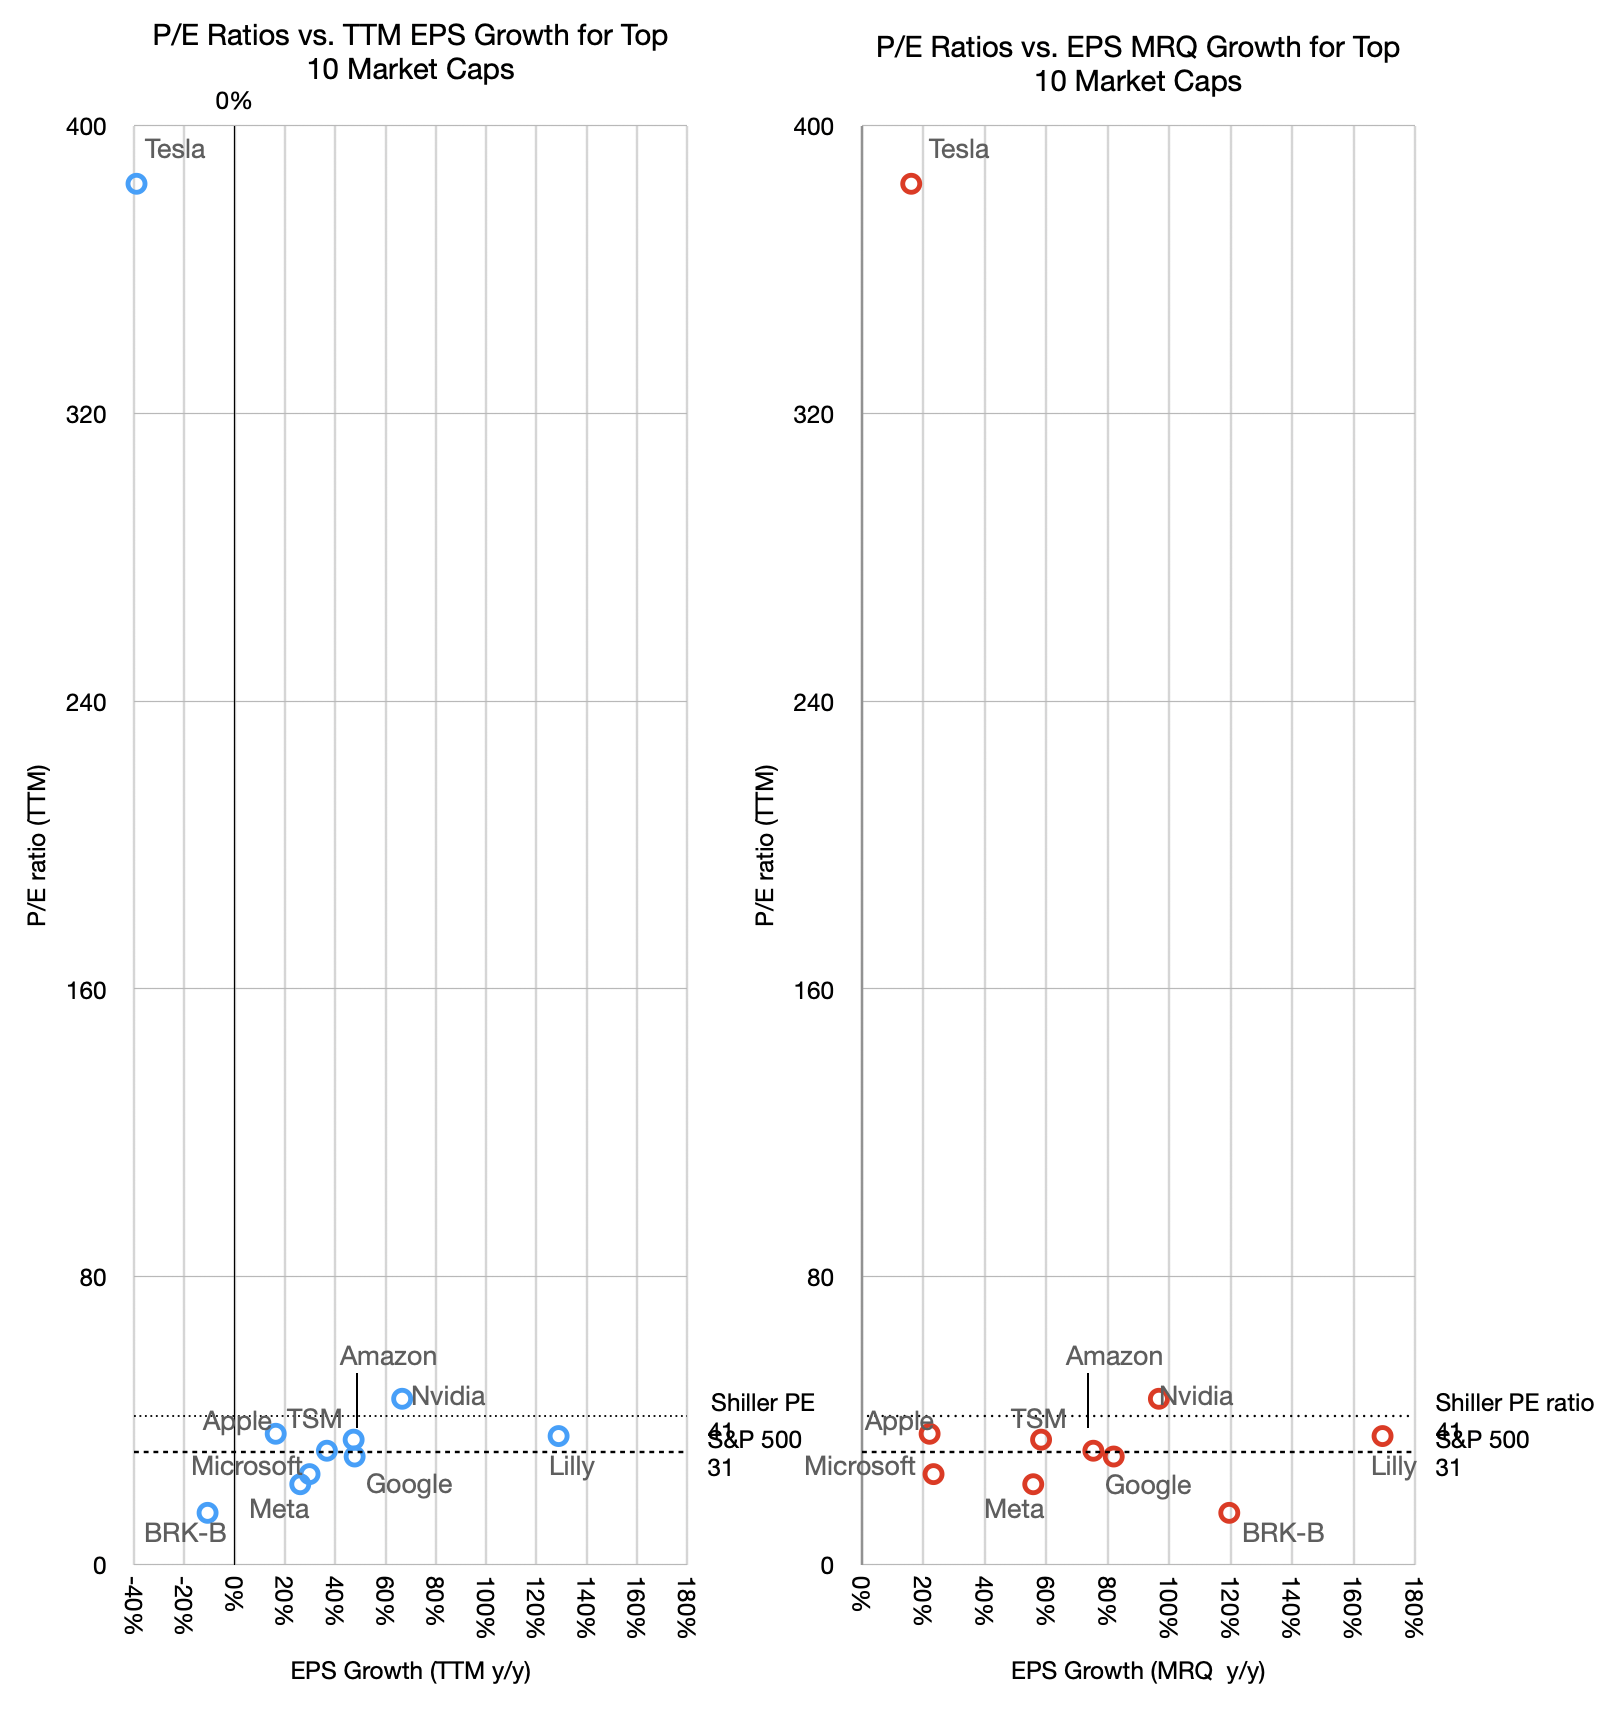
Higher P/Es should also correspond to higher growth rates. The graph below shows the relationship between P/E and growth, both in the most recent quarter (MRQ) and trailing twelve months (TTM).
There is a loose relationship between P/E and TTM growth but not with last quarter's growth. The one anomaly is even more prominent as it shows negative growth with exceptional valuation. Fundamentally however the relationship between P/E and growth is weak. Companies having widely divergent growth show similar P/E ratios. Alphabet for example has seen its P/E ratio in the 20s with growth in the 80s TTM and 50s MRQ.
This might sound familiar. From 2008 to 2020 Apple was trading at a P/E ratio in the teens and low 20s while growing as fast as 80%. The logic was captured by my analogy of the goose that lays the golden eggs. Apple was able to create extraordinary products but the market considered such hits fleeting. It valued consistency over heroism. Getting on base vs. home runs. And so the P/E began to rise only once Services became more prominent. Regardless of how foreseeable this pattern was, it took a decade and is still ongoing for the pricing to catch up.
But the situation with AI companies (that is, all the big tech companies but Apple) is that their earnings today are somewhat an illusion.
An old maxim that says "earnings are an opinion while cash flow is a fact.[3]"
This is because Net income can be manipulated by accounting abstractions, whereas cash flow is based on bank transactions.
To wit: Net income (earnings) is calculated using accrual accounting, which relies heavily on judgment calls rather than bank balances. Companies recognize revenues the moment a contract is signed, even if the cash won't be collected for months. Or they can dial in a delay as they desire.
Because of varying accounting policies, two identical companies with the exact same physical business can report vastly different earnings figures.
Cash flow is objective and simply tracks the actual movement of money in and out of the business. Real dollars either enter the bank account or they don't. A company can look highly profitable on an income statement but still go bankrupt if its cash is trapped in unpaid invoices or unsold inventory.
Finally, cash flow can be strongly negative while earnings are strongly positive. This is because investment in capital equipment does not appear in the income statement.
Therefore true economic value is determined by the cash a company can actually distribute or reinvest rather than how it declares profitability based on accounting abstractions.
AI companies are not necessarily hiding behind suspect earnings but their extraordinary capital expenditures are draining their cash and thus what investors have access to.
Earnings seem to be soaring so the ratio P/E suggests a modest valuation. This is based on opinion or at least incompleteness.
We should look at a better indicator. It's the EV/FCF ratio. We will look at this next.
The top 10 ranking can change rapidly and it makes analysis difficult over longer time periods. The inclusion of LLY and BRK-B allow for visibility outside of the tech sector and they were in the list mid 2025. Saudi Aramco is in a completely different environment influenced by non-economic factors.
TSMC is absent from the table as it is US only companies. It is notable perhaps that of the top 15, three are not US companies (TSMC, Samsung and Saudi Aramco). Furthermore the top Chinese company, Tencent is 25th, valued at $532 billion and the top European company is ASML at 21st and $610 billion.
Apple recently hit an all-time high. Today the stock is trading at a P/E of 35. The P/E ratio is the current share price P divided by the last four quarters’ net earnings per share E. But we also have a pretty good idea of the earnings for the next quarter, ending June (now almost half-way completed). The guidance very clearly suggests that on a one Quarter forward basis the P/E ratio is 34.
I’ve maintained for at least 15 years that a reasonable multiple for Apple is 35. This was mainly because other large cap technology companies were also trading around that number. While at this ratio, if a company is growing at 22% it means that an investor will make their money back in about 10 years. Thereafter all free cash flows will go entirely to the investor’s pocket. That seems a reasonable return. It’s not a particularly risky bet to assume 20% growth for 10 years if you look at (a) history and (b) how many people in the world have not yet started using Apple products and (c) assess how well management is doing their job.
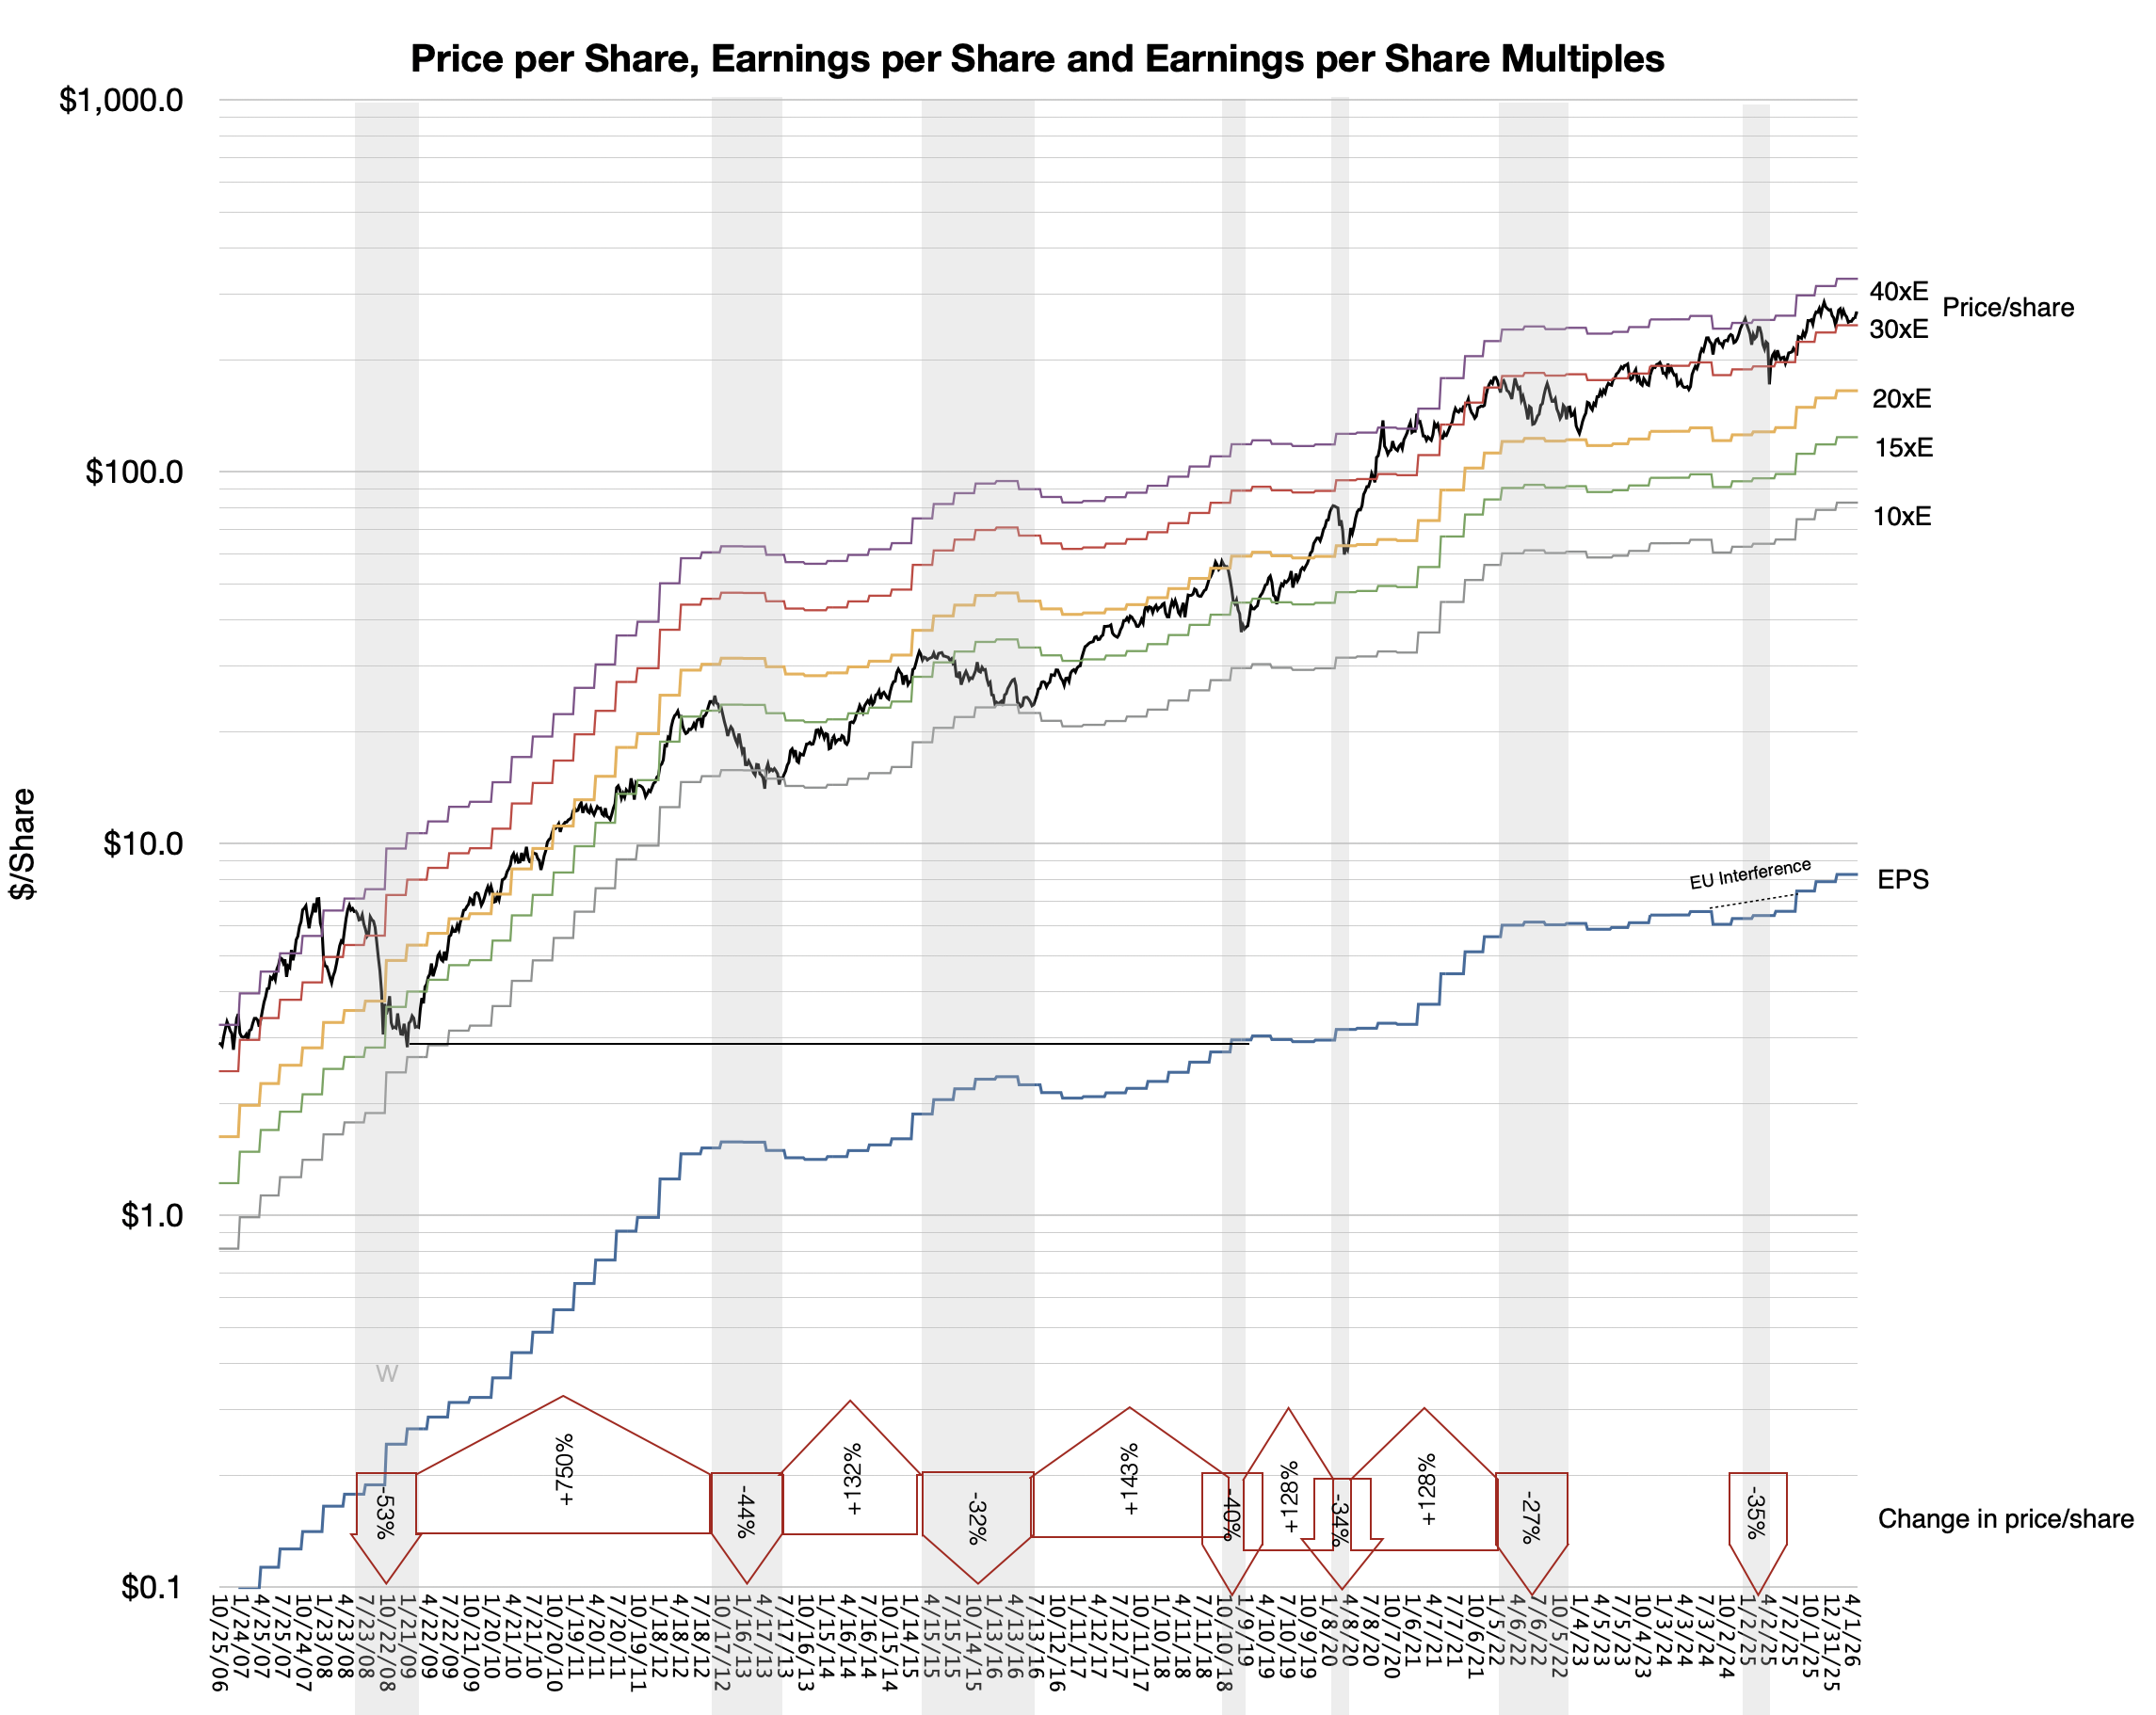
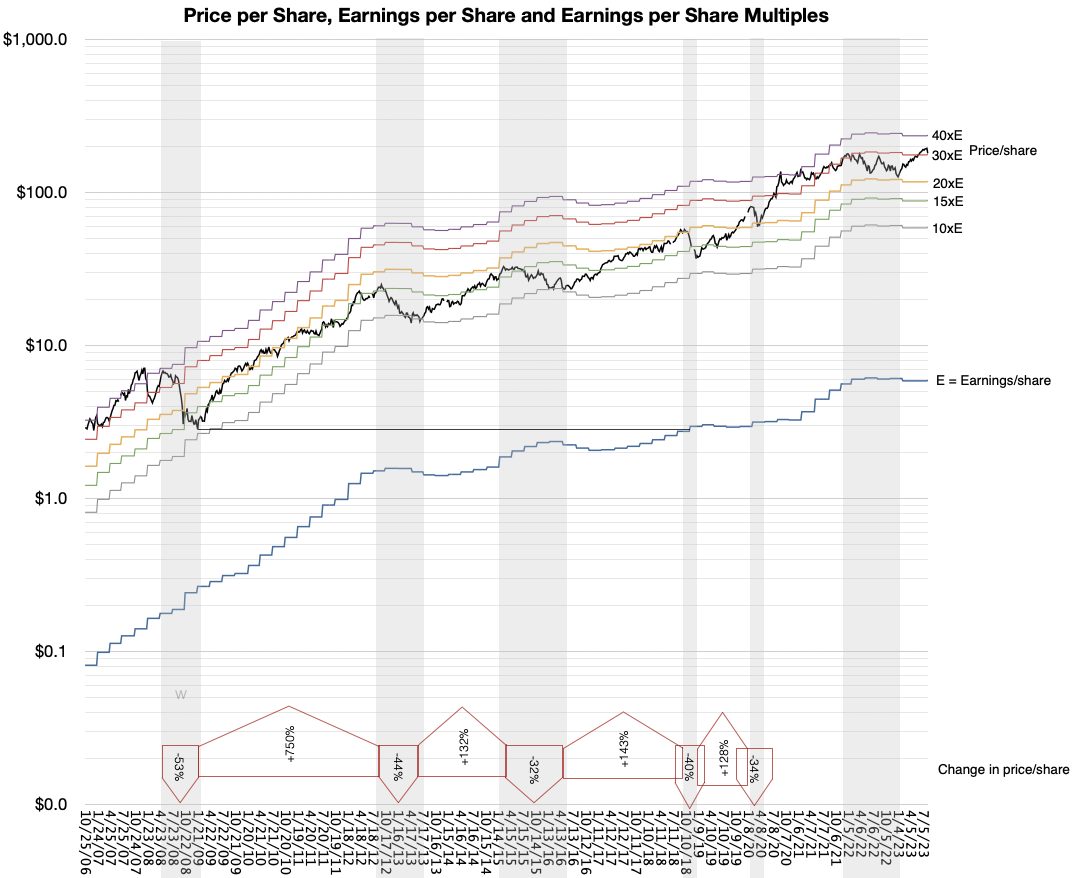
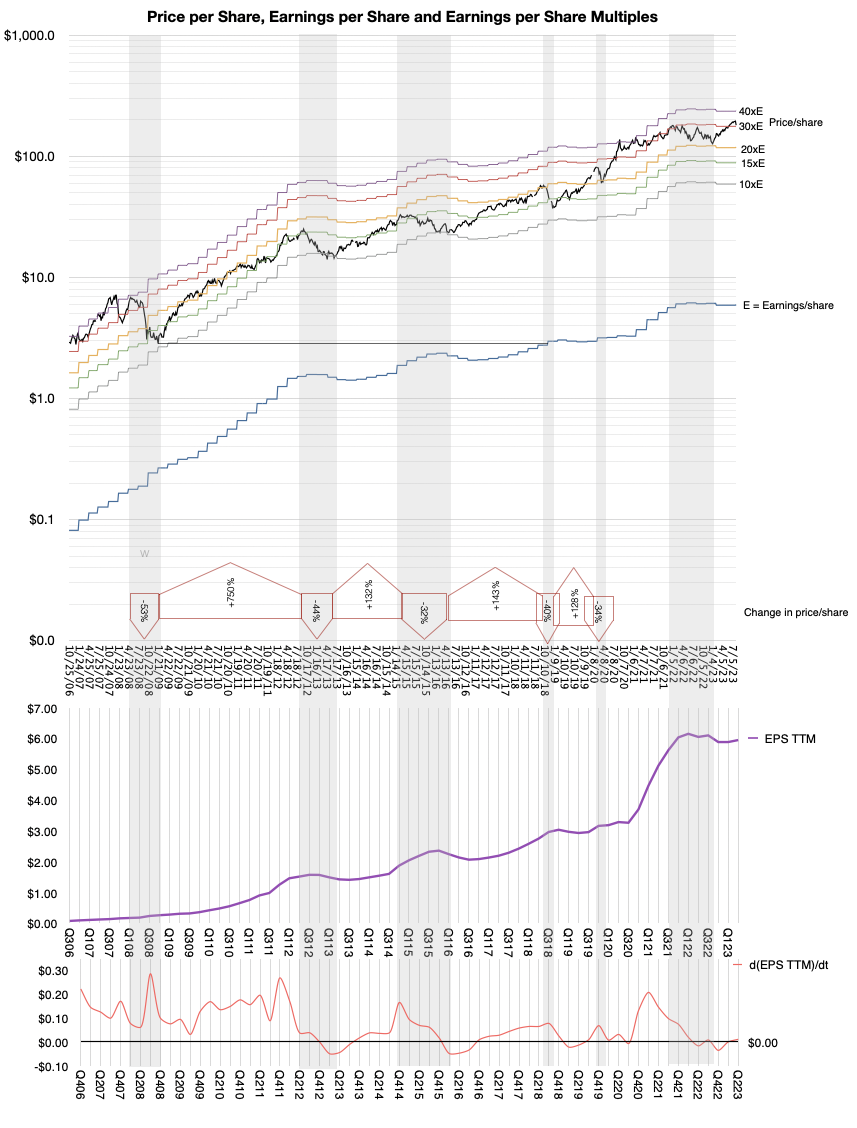
So by this measure, Apple seems to be reasonably priced. Historically it has not been reasonably priced but that is due to the disconnect between understanding the business and falling for the usual false tropes. The following graph shows the share price and where it fell between the bands of Earnings multiples. The grey areas represent periods of significant share price decline.
But much of the volatility of the stock is also due to overall sentiment collapse. That has happened on many occasions, most notably the 2008 financial crisis and “great recession.” (Another was the Covid crisis.) In these cases, regardless of underlying strength, the shares were available very cheaply.
Today perhaps we should ask if a bubble is forming due to exuberance around AI which is inflating the market in unsustainable ways.
There are four reasons why the current asset value explosion is different.
First, it is highly concentrated in a handful of names.
2005 S&P 500 top 10
% of the S&P index
2026 S&P 500 top 10
% of the S&P index
Exxon
3.1%
NVDA
7.8%
MSFT
2.5%
GOOG
7.3%
Citigroup
2.2%
AAPL
6.4%
GE
2.0%
MSFT
4.6%
Walmart
1.7%
AMZN
4.4%
BoA
1.6%
Broadcom
3.0%
J&J
1.6%
TSLA
2.4%
Pfizer
1.4%
META
2.3%
Intel
1.3%
Walmart
1.6%
AIG
1.3%
Berkshire Hathaway
1.5%
Total
18.7%
41.3%
Second it is fueled by equity not debt. Third, it involves disproportionate capital expenditure rather than M&A. Fourth it is accompanies by sharply growing revenues (though not as sharp as investment growth.)
In other words, whereas the equity value is growing rapidly, so is income and investment without leverage. This is a low-debt with high income scenario. Previous crises were high income with high debt (2008) or low income with low debt. (Dot Com).
That’s not to say that we have uniform fair equity values. We need to do quite a bit more due diligence to determine the state of the valuations precisely because we have unusual capital allocation strategies.
To cover this topic I’ll will break the analysis into multiple posts. They are:
Why the most common metrics for valuation are insufficient — the problem with the P/E ratio
What are the alternatives that into consideration exceptional cash and capital expenditures — The EV/FCF ratio
How does the P/E ratio differ from EV/FCF and what does it mean if they diverge one way or another
How do the Mag 7 et. al. appear on these Metrics
How to complement snapshots like valuation ratios with the time series of fundamentals
Why payback measures are the ultimate measure of valuation
What are the current payback measures for the Mag 7 et.al.
Compare Apple to its peer group
Finally assess whether a collapse in confidence is imminent
Please return to these pages in the next few days to read these posts.
Expectations are low due to memory pricing, apparently.
Apple has multiple catalysts for strong revenue growth, so investors shouldn’t be spooked by any margin pressure from rising memory…
“Memory inflation will pressure margins, but this is well-known, and iPhone revenue upside sets up for a better than feared June quarter guide,” Woodring wrote.
He added that any announcements regarding an AI powered Siri at the company’s Worldwide Developers Conference in June, and the expected release of a foldable iPhone, would be positive tailwinds that can help push the stock higher after earnings.
Woodring, who rates the stock as Overweight with a $315 price target, also thinks Apple stands out against large tech peers as the company continues to report strong free cash flow while competitors continue to spend massive amounts of capex on building out AI infrastructure.
We expect gross margin downside to be more than offset by revenue upside in the June quarter guide, making for a better than feared earnings and a clearing event into WWDC this June, and the iPhone launch in September.
While our gross margin forecast remains below Consensus given rising memory cost pressure, continued strength in iPhone, Mac, and Services revenue should more than offset this pressure and result in a June quarter implied EPS guide in-line with Street estimates (~$1.74) – a better-than-feared outcome against relatively low expectations.
At 28x next year GAAP EPS – roughly the midpoint of Apple's historical 24-34x valuation range – valuation is neither cheap nor taxing, but with our ~$10 of FY27 EPS 5% above Consensus, we see a path to $300 for Apple shares by this September, driven by modest multiple expansion and more robust positive EPS revisions.
Much more was said of Jobs’ departure signaling the end of Apple than of Gates’ departure signaling the end of Microsoft. And much more was celebrated of Apple 50 than Microsoft 50. Why is that?
If you were to structure an experiment to determine the influence of processes and personalities on the outcomes of a company, you would be hard pressed to find a better pair to study. Apple and Microsoft were founded almost at the same time, due to the same enabling technologies (microprocessors) and led by two iconoclastic founders of the same age acting out of similar impulses.
The divergences were that one concentrated on software while the other on hardware. But rather than pairing up in a match made in heaven, both tried to outmaneuver the other in order to avoid dependency. →
Cash flow is a fact, earnings are an opinion and share price is a dream.
A company’s total worth is the number of outstanding shares multiplied by their value. This product is called the market capitalization or Market Cap.
That’s a simplification. If you want to be more accurate, you should take the Market Cap and net out cash and debt–these are not part of the future flows of cash that can benefit shareholders.
More precisely, there is another measure called the Enterprise Value (EV) which is the total price tag of a company, representing what it would cost to buy the entire business and pay off its debts. EV = Market Cap + Total Debt + Preferred Stock + Minority Interest – Cash and Cash Equivalents.
This is the precise and complete measure of the firm’s value but we use the shortcut of Market Cap since In most cases the Preferred stock and minority interest are negligible and if cash equals debt then the result is EV =~ Market Cap. it’s easier to calculate anyways as the shares outstanding and share price are easily available. Not so for EV. →
What are the odds of it surviving another year, ten years, 50 years?
Companies don’t last long. A recent study that analyzed thousands of European firms yielded a corporate life expectancy figure of 12.5 years. The Boston Consulting Group analyzed the entry, growth, and exit dates of 35,000 publicly listed companies and determined that one in ten of all public companies fail each year, a fourfold increase since 1965.
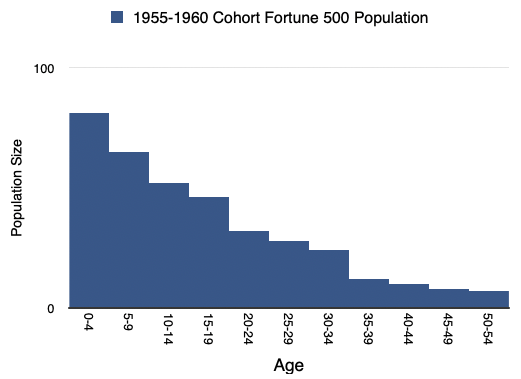
As I illustrated many years ago in a talk titled “The Unfortunate 500” most companies die not long after adolescence. Of the Fortune 500 1955-1960 cohort, the 81 companies which joined the index in those years, only 7 remain there today. One third of the corporations on the 1970 Fortune 500 list were no longer in existence thirteen years later. Broadly speaking, as a population, large companies that make it to the Fortune 500 listing have life expectancy within that group of 17 years. →
Today marks the 16th anniversary of when Apple released the first-generation iPad.
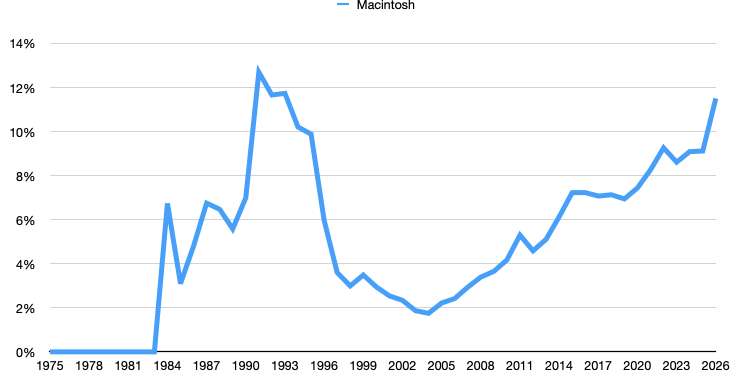
To many, including Alan Kay, the tablet form factor makes much more sense than the PC form factor. It’s more approachable, more intuitive and certainly smaller and more portable. As the graph shows, quickly after launch, the iPad overtook sales of the Mac.
The problem arose that whereas the iPad was smaller, the iPhone what smaller still–so much so that users would take phones with them everywhere. At the same time, the “PC” shrank as well so that many notebook (laptop) computers became thin, light and had day-long battery life. The Mac at least became no bigger a burden to carry than an iPad.
So the iPad was stuck in the middle between an iPhone, that did more and more, and a Mac that was very portable. At this point many said that the iPad was a dead end form factor. →
ON September 3, 1821, 37 years after James Watt invented the concept of horsepower and started charging £5/horsepower/year for the use of his steam engine, the first demonstration of the production of a mechanical force by the interaction of an electric current and a magnetic field was given by Michael Faraday in the basement of the Royal Institution in London.
1820 is, in many chronicles, noted as beginning of the industrial revolution. It marked the end of 50 years of war, whose conclusion unleashed pent-up demand. That demand was served by relatively free trade, guaranteed by British naval power, coupled with property rights and financial instruments which allowed inventions of the previous century to finally be harnessed for commercial gain. The steam engine is the canonical invention of the era and its implementation as a source of power for factories, shipping, rail and machinery is legend.
Not usually noted as coincidental to this period is the electric motor. Yet not long after Faraday’s 1821 demonstration in London, the first DC electric motor capable of turning machinery was invented by William Sturgeon. In 1832 he built on Faraday’s electromagnet by incorporating a commutator which oscillated the direction of current to ensure continuous rotation.
Nota Bene.
The Motley Fool asks: Where Will Apple Stock Be in 5 Years? → Not reading this article is probably a wise decision. Shares could perform in line with the S&P 500’s long-term average Investors can follow a straightforward exercise to try and figure out where Apple’s stock price will be in late March 2031. It’s important to consider both the valuation and profit gains. We just released a […] →
Apple’s services continue to see increased engagement, spending → The survey of 3,500 smartphone users reveals a significant rise in average monthly spend on Apple services to $13, driven by increased adoption of premium offerings like AppleCare/One, Apple TV+, and Apple Music, with notable shifts towards AI features despite muted upgrade intent, though potential US bias may affect overall accuracy. →
iPhone sales continue to surge into February – Bernstein → February saw robust iPhone sales driven by the iPhone 17 line, with global unit sales up 26% and ASP climbing 6.9%, yet January-February revenue estimates oddly lag behind projections, sparking confusion. →
Morgan Stanley has a stark message for investors in Apple → Morgan Stanley's survey indicates strong potential for Apple stock, highlighting record iPhone upgrade intentions, especially in China, improved switching rates, and significant interest in a future foldable iPhone. These factors support robust FY26 shipment forecasts and suggest a possible revenue boost from new products. Despite some concerns about declining willingness to pay for AI features, Morgan Stanley maintains an optimistic outlook with a $315 price target. The article criticizes TheStreet's editorial approach for misrepresenting the positive survey findings as negative news about Apple. →
Mac mini and Mac Studio orders booming → Apple's Mac sales are surging due to the M5 chips' enhanced AI capabilities, outpacing other platforms and driving demand despite current shipping delays. →
Gartner adds their Mac Q1 estimate to the pile → In Q1 2026, Apple's Mac sales surged impressively by 10.7% to 12.7% year-over-year, driven by the MacBook Neo's appeal, securing a 10.6% global market share and maintaining fourth place among PC vendors, amidst a 4% rise in overall PC shipments. →
Cash flow is a fact, earnings are an opinion and share price is a dream.
A company's total worth is the number of outstanding shares multiplied by their value. This product is called the market capitalization or Market Cap.
That's a simplification. If you want to be more accurate, you should take the Market Cap and net out cash and debt--these are not part of the future flows of cash that can benefit shareholders.
More precisely, there is another measure called the Enterprise Value (EV) which is the total price tag of a company, representing what it would cost to buy the entire business and pay off its debts. EV = Market Cap + Total Debt + Preferred Stock + Minority Interest - Cash and Cash Equivalents.
This is the precise and complete measure of the firm's value but we use the shortcut of Market Cap since In most cases the Preferred stock and minority interest are negligible and if cash equals debt then the result is EV =~ Market Cap. it's easier to calculate anyways as the shares outstanding and share price are easily available. Not so for EV.
To get a sense of how much you're paying for the company it makes sense to divide the Market Cap by the company's Earnings so you get an idea of how many years it will take to get back your investment. When dividing both Market Cap and Earnings by the number of shares it becomes the famous P/E ratio or Price per share / Earnings per share.
But if you want to be fully precise, instead of using Market Cap you should use Enterprise Value. In that case the denominator should be Free Cash Flow or FCF[1]. The ratio becomes EV/FCF. Free Cash Flow is a better measure than earnings because it takes into consideration depreciation, change in working capital and capital expenditures. It measures the actual cash a company generates after paying for its operating and capital expenditures.
EV/FCF takes into consideration unusual situations such as huge amounts of cash or debt or capital expenditures which removes shareholder access to what the company "earns" on paper. This why the adage of "earnings are an opinion but cash flow is a fact" exists.
I used EV/FCF years ago to value Apple because at a time when it held huge amounts of cash. This was before it began aggressively reducing its cash through its capital return program. The P/E ratio at the time was very low but excluding the cash, it was even lower. It was a huge red flag indicating that the company was being priced for liquidation, or as some analyst put it, priced like a steel mill going out of business. If at that time you did not believe that its demise was imminent you would have surely been richly rewarded.
Today the anomaly that throws the P/E off is not Cash but CapEx. And it's not for Apple but for the other mega caps or AI "hyper scalers". Without worrying who is or isn't in the "Magnificent 7" I compiled the largest 10 market capitalization companies and looked at their P/E and EV/FCF ratios. At time of writing:
Company
Market Cap
P/E Ratio
EV/FCF
NVDA
$4,014,456,963,072
33.6
44.4
AAPL
$3,624,949,514,240
31.3
30.3
GOOG
$3,304,174,911,488
25.2
44.3
MSFT
$2,667,926,257,664
22.5
35.0
AMZN
$2,157,182,320,640
28.0
297.0
TSM
$1,641,528,688,640
30.6
50.0
TSLA
$1,333,163,982,848
332.0
225.0
META
$1,356,802,949,120
22.8
32.6
BRK-B
$1,023,780,323,328
15.3
44.1
LLY
$793,550,454,784
38.6
142.3
As recently as six months ago, there was a lot of talk about an AI bubble. Back then I looked at the data then and by looking at the P/E ratios convinced myself that the valuations were not "bubble" level. They were in the mid-thirties. These were not historical high especially when considering the growth these companies were experiencing (over 30%). Since then prices have come down significantly.
This is as the CapEx elephant in the room has been making itself known and there is renewed alarm at the scale of capital spending. This is reflected in the EV/FCF number but not in the P/E number.
The table above shows how much more elevated the EV/FCF ratio is relative to P/E for many of the companies. This "truer" measure of what you are paying as a share buyer is now reflecting in reduced share price and hence reduced P/E.
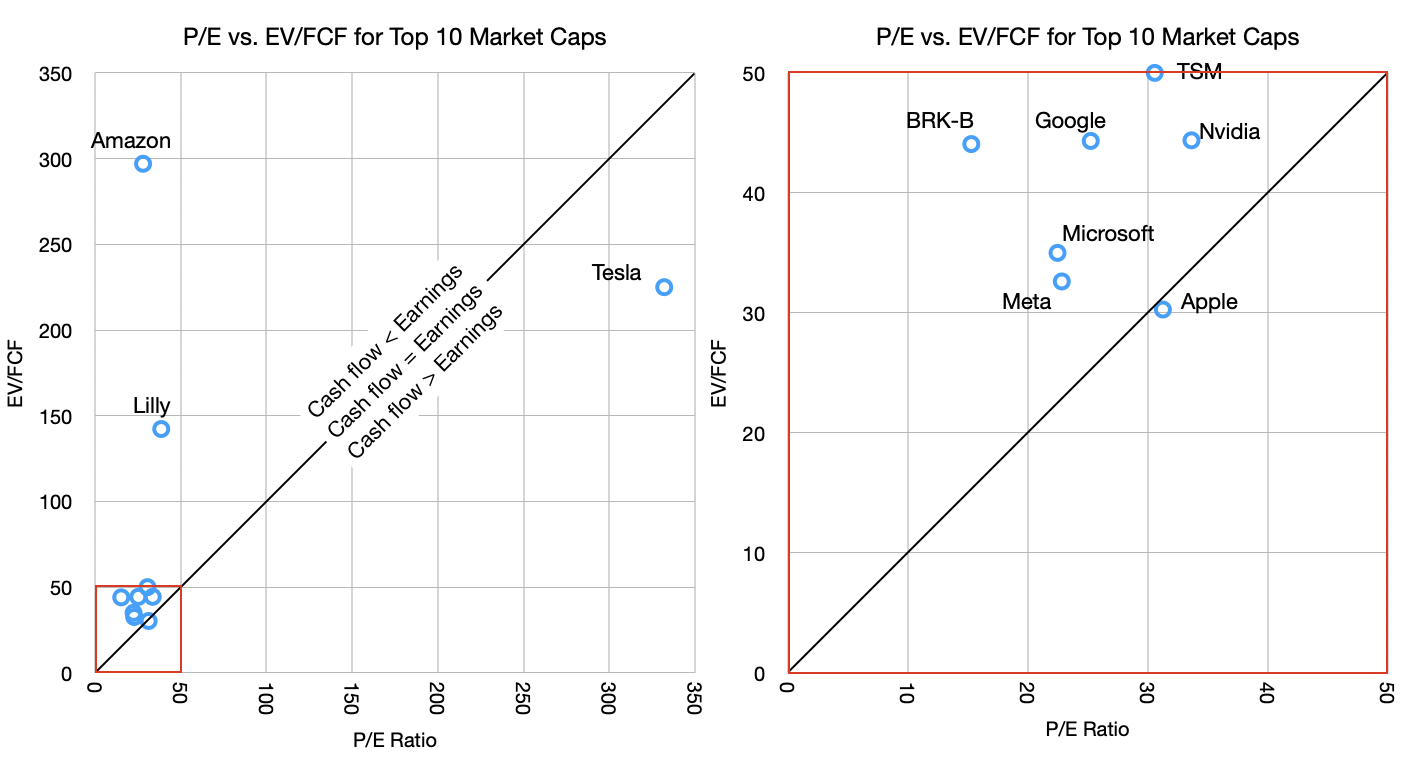
Of course, this is not true for Apple. Apple's P/E ratio and EV/FCF are nearly identical. To see this more clearly I put together these graphs.
The graph shows the P/E vs. EV/FCF for the companies in the table. The graphs are the same data but the one on the right is zoomed in on the lower left corner (note the red squares).
The reason for the zoom is that there are three outliers. Tesla, Amazon and Lilly. Tesla has absurd valuation on both P/E (300 to 400 range in last 6 months) and EV/FCF while Amazon has an outrageous EV/FCF value due to abnormal capital spending. Basically, Tesla has negligible earnings (and negative growth) while holding astronomical share price and Amazon is spending far above its median on CapEx. Amazon's 10-year EV/FCF is much lower, at approximately 55.
But let's ignore the outliers and concentrate on the other seven in the cluster. These are below 50 P/E and 50 EV/FCF thresholds.
Note that I drew a diagonal line representing the equation of P/E = EV/FCF. This should, under normal circumstances, hold for most stocks. Just like Market Cap should roughly equal Enterprise Value so Earnings should equal Free Cash Flow.
Most companies should not stray too far from this line. But what we are seeing, with the notable exception of Apple, is that most tech companies have cash flow far below earnings. This is again due to the CapEx elephant.
The argument goes that this is a temporary situation with that capital being wisely deployed for returns from AI. Presumably, these companies will swing to the other side of the line, where cash flows will exceed earnings, compensating for the capex that was denied to the shareholders.
This is where the old adage comes into play: Earnings are an opinion but cash flow is a fact. I added to that "and share price is a dream". Take the free cash flow and multiply it by a "dream" and you get the price the market sets. This dream is the multiple.
What makes the AI "bubble" interesting is how it's not fueled by debt[2] but by cash flow. Companies are turning over large portions (almost all and sometimes more) of their cash flows to investing in the dream of AI profits. All but one, of course.
There is something obviously contrarian in Apple's strategy. Perhaps it's not Apple that is odd but rather there is groupthink on behalf of the others. The question of who's right will rest on whether it turns out that AI is going to commoditize quickly or perhaps never, whether AI turns out to be modular or integrated, whether AI exhibits disruptive or sustaining competitive responses, whether it's an infrastructure subject to regulatory corrosion or whether it will migrate to the edge and iterate freely, whether it's a new experience or simply better existing experiences, whether it creates new markets or just makes existing ones more efficient.
These are not new questions. They have been applied to all software and hardware innovations of the last 40 years. We have a lot of history to inform us.
Not reading this article is probably a wise decision.
Shares could perform in line with the S&P 500's long-term average
Investors can follow a straightforward exercise to try and figure out where Apple's stock price will be in late March 2031. It's important to consider both the valuation and profit gains.
We just released a brand-new report with the full story and the company’s name.
Apple shares current trade at a price-to-earnings ratio of 31.5. I believe it's reasonable that this multiple could drop to 30 in five years, which is still a premium valuation.
On the other hand, sell-side analysts hold a consensus view that diluted earnings per share will rise at a compound annual rate of 11.6% between fiscal 2025 and fiscal 2028. If we assume that this pace of growth continues in the years after this explicit forecast period, then Apple's stock price will be around $410 in five years. This translates to a 10.5% annualized gain.
This is obviously a very rough guide that may or may not prove to be correct. Apple's earnings could surprise to the upside or disappoint to the downside. And market sentiment is also extremely unpredictable, which will impact the stock's valuation. [Seriously?-ed]
That expected rate of return mimics the S&P 500's long-term average. But if the widely followed benchmark keeps up its performance from the past decade, then Apple will lag the market.
Asymco Bulletin is a digest of all the work we have published for the week ending Apr 5, 2026.
Podcast
Apple at 50: Ben Thompson of Stratechery interviews Horace Dediu → Horace describes his journey from Romania to becoming a leading tech analyst, highlighting his experiences at GTE Labs, business school under Clayton Christensen, and Nokia during the iPhone's birth. He emphasizes Apple's customer-centric approach and its potential to navigate AI challenges. Dediu also shares insights on his new paid service, Asymco One, and reflects on the importance of understanding market dynamics and customer satisfaction. He expresses optimism about Apple's future and underscores the value of deep, long-term analysis in tech forecasting. →
Apple’s Business Strategy → Apple's enterprise growth is driven by its strong consumer base. Do new services like Apple Business suggest a new emphasis? →
Melius highlights FCF while reiterating buy on Apple → In the AI era, valuation shifts from traditional P/E to EV/FCF, highlighting Apple's robust financial health and fair valuation amidst its significant product launches. →
The iPhone 50 years from now – and why Apple won’t have AI execs → Rumors suggest the iPhone 70th anniversary edition might feature an innovative new camera system, while Apple CEO Tim Cook dismisses the idea of AI-led executives due to legal and functional constraints. →
Apple may not have a clear trigger to push the stock higher right now, according to top KeyBanc analyst Brandon Nispel. He reiterated a Sector Weight (Neutral) rating on the stock, saying recent spending data and current valuation leave limited room for near-term upside.
KeyBanc’s consumer spending tracker showed indexed spending down 9% month over month in February, worse than the three-year average decline of about 4%. On a yearly basis, spending rose 4%, slightly above January’s 3% growth. Nispel said the data from January and February remains mixed, making it difficult to draw firm conclusions about Apple’s demand this quarter.
KeyBanc also updated its forecasts after Apple’s recent product launches. The firm now expects Apple’s Fiscal 2026 revenue to reach about $466.5 billion. It also raised its Fiscal 2026 earnings estimate to $8.52 per share and Fiscal 2027 earnings to $9.11 per share. For the second quarter of 2026, KeyBanc estimates revenue of about $108.7 billion, which would represent roughly 14% year-over-year growth.
With Apple trading close to its historical valuation levels, Nispel said he does not see a “clear near-term catalyst” that could push the stock higher.
Turning to Wall Street, analysts have a Moderate Buy consensus rating on AAPL stock based on 15 Buys, nine Holds, and one Sell assigned in the past three months. Furthermore, the average AAPL price target of $305.18 per share implies 17% upside potential.
Before the iPhone launched in late 2007, Apple was trading consistently at a P/E ratio above 30. Here is a table for the P/E ratio on each Friday's closing price from May to August, 2007. The iPhone launched on June 29, 2007.
Apple's P/E ratio around the iPhone launch
Date
P/E Ratio
5/23/07
31.5
5/30/07
31.6
6/6/07
34.1
6/13/07
33.7
6/20/07
34.6
6/27/07
33.6 (2 days before iPhone launch)
7/11/07
37.2
7/18/07
34.6
7/25/07
34.3
8/1/07
33.3
8/8/07
34.2
8/15/07
30.2
Apple was not super powerful but it was not doomed either. It was a time when the iPod was dominant and the Mac was still alive. iTunes re-wrote the rules of the music industry and debate was raging whether Apple should be considered a media company. Platforms were not its strength but Steve Jobs showed he was still able to distort reality.
These good times did not last. The first year of the iPhone was a period of minimal contribution from the new category with Apple still largely valued on the basis of the iPod. The predictions of failure for the new communications product, especially given its high price, were legendary. It wasn't until 2008 that the iPhone began accelerating and making a meaningful contribution to the bottom line.
It was then, in late 2008, that Apple's valuation broke. The P/E ratio fell from above 30 to nearly 10. The following graph shows the catastrophic 53% share price collapse coupled to the triple digit surge in earnings which led to the P/E ratio tanking.
[The graph shows earnings per share for the trailing 12 months (blue line) and 10x, 15x, 20x, 30x and 40x that value (colored lines). The share price is the black line. The share prices are sampled every Friday. The graph is notably logarithmic. The grey shaded areas are periods of significant contraction. The percent drops/increases during these periods of contraction/expansion are shown in the annotation arrows near the bottom.]
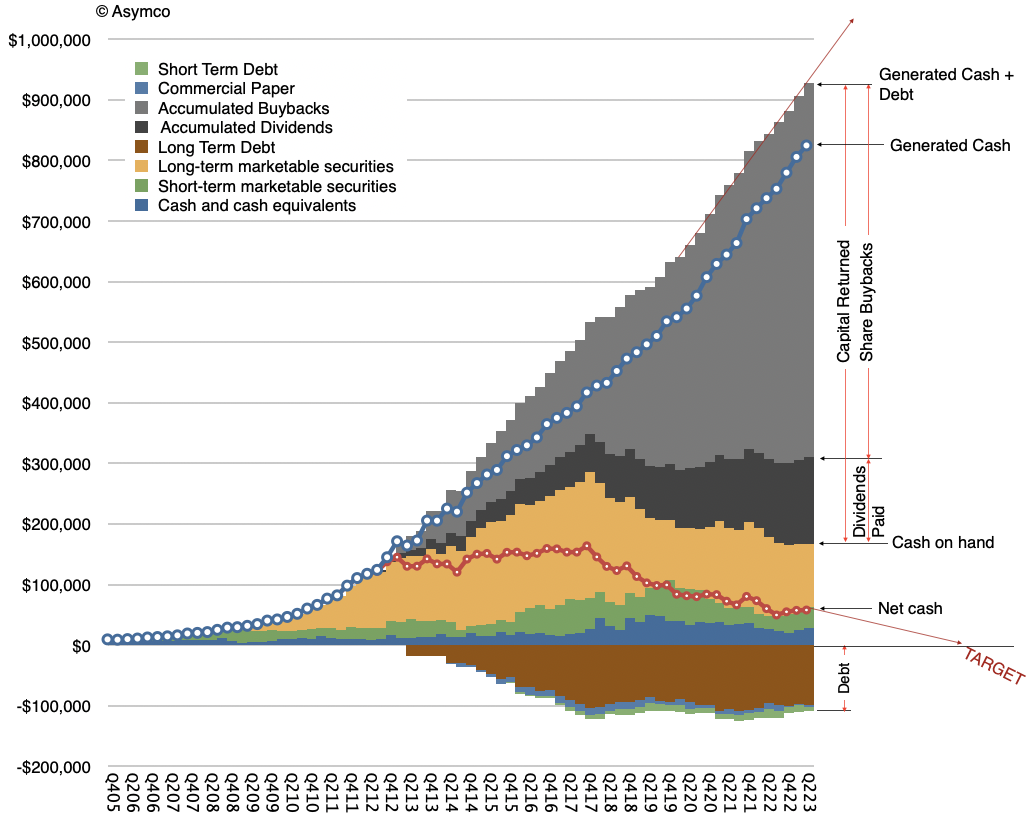
The valuation remained broken for 12 years, between late 2008 and late 2020. This period being, arguably, the most remarkable wealth creation event in history of business. For evidence see the following graph showing the amount of retained earnings returned to shareholders building inexorably toward one trillion dollars. This is not share price appreciation but cash returns. [If you have evidence of a larger wealth-creation event do let me know.]
The creation of $800 billion of shareholder wealth at fire-sale share pricing.
As I explained throughout this period, motivation to dispose of shares which create immense wealth is explained by the fable The Goose That Laid the Golden Eggs but the question some are asking now is whether more wealth can still be created, and if so, can we expect Apple's valuation to collapse accordingly?
I should note that during the long, dark years of wealth creation, other technology companies such as FaceBook, Amazon and Netflix, Google (so-called FAANG) and Microsoft enjoyed far higher multiples than Apple, sometimes 3x higher. This was not seen as abnormal by analysts because those companies were always assumed to have higher growth potential, with a diverse portfolio of opportunities while Apple's growth was perpetually in its past, based on one product.
Paradoxically perhaps, since the Covid-19 pandemic Apple shares have enjoyed P/E ratio roughly equivalent to the other tech companies. For instance, peaking at 42 in January 2021, the P/E ratio has averaged about 27.5 since then. Simultaneously, diversified companies such as FaceBook (now Meta) and Netflix collapsed due to serious business model flaws (based on single sources of income) and Google (now Alphabet) and Amazon have slowed growth and are facing anti-trust scrutiny. Having lost any presence in mobile computing Microsoft has become entrenched in enterprise, finding new businesses in cloud and (possibly) generative AI. As a result of these reversals, the contrast between Apple and the mega-cap cohort has become fuzzy.
So back to the question: does it make sense to price Apple in the 30x P/E or should it go back in the gutter at 10 to 20?
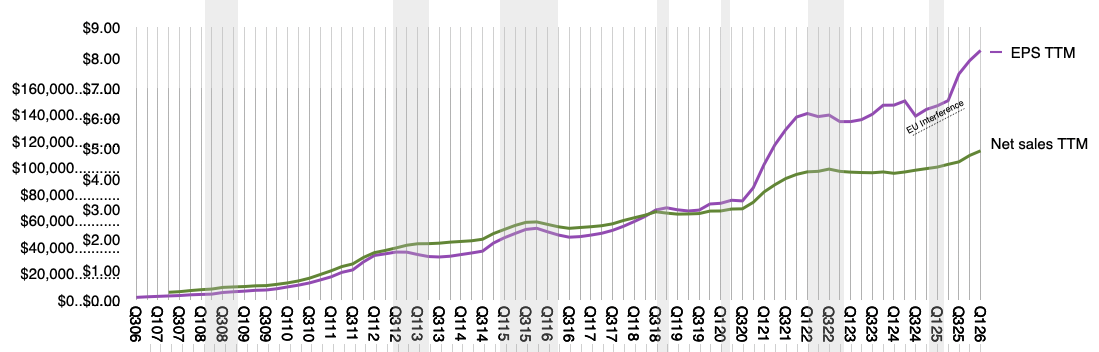
I would argue that the big change in perception hasn't been the surge in earnings during Covid (see graph below). The big change is the realization that Apple is no longer about to go out of business.
How could Apple not be going out of business?
Remember that a P/E ratio in the teens is a clear signal from the market that the company is a questionable "going concern". This is parlance indicating doubt that the company will continue in its present form..
What has changed since 2020 is that even though there were a multitude of crises—from war to pestilence—the eggs kept coming. Perhaps, perhaps, Apple was not doomed after all. In that time it managed to create 1 billion customers. Perhaps having 1 billion customers was a positive outcome. Perhaps counting iPhones during a single quarter was not the only way to value the company. Perhaps having 1 billion satisfied customers made it viable. Perhaps having 1 billion satisfied and loyal customers returning every year was interesting. Perhaps having 1 billion satisfied wealthy customers meant the end is not around the corner. Perhaps having 2 billion active devices in use was sustainable. Perhaps providing services to 1 billion customers using 2 billion devices delivered through 1 billion subscriptions made some sense. Perhaps having all this data in a linear graph made it predictable?
Perhaps. Though Apple provided updates on these figures regularly, the questions everyone asked were still on unit shipments (which Apple stopped providing.) While Services grew at double digits and 70% margins the questions from analysts on conference calls persist on the iPhone and currency or production "headwinds". Perceptions take time to change. They are still changing.
Maybe at this point it's time to agree that Apple's end will not come through being easily replaced by the competition (first Windows then Android, etc.) but by having access to its markets restricted. Being the only American company to have cracked the China puzzle, it's surely vulnerable there. And please don't mention India.
Apple is no longer doomed because it's too weak. It's doomed because it's too strong.
It seems that it's not too hard to believe the end is still near.