In the grand debate on the future of computing, we've been led to believe that there was a choice coming, a new interface to replace the touch UI interface that emerged in 2007.
One camp believed that the future was ambient or intent computing where conversations and minimal interactions would replace taps and swipes and staring at screens. Apps would disappear as well as almost all visual interfaces. Devices would be not much more than microphones and perhaps earbuds. The initial instance was Amazon Alexa but more recently the quixotic Humane and rumors of a OpenAI pendant or tchotchke that linked us to the great mind in the cloud without messy screens.
The other camp dove into virtual reality so that everything we see is generated by computing. The world itself would be re-painted by the machine and every photon hitting our retinas would be computed and every move we make, every breath we take would be tracked as forms of input.
These are opposite ends of a spectrum: from minimal or almost no interaction to full immersion at the exclusion of passivity. From seeing nothing to seeing everything and from barely hinting intent to monitoring every muscle moved.
The passive computing seemed to be winning. The VR or Visual Computing was not catching on. Device sales are not great and prices too high. Worst of all, devices are too onerous for mass consumption. In terms of wearables, eyes were losing while ears were winning.
However lost in the WWDC news tornado was the updates of VisionOS 27. The list of updates is long and quite esoteric but it's clear that there was a lot of work involved in expanding the power of Visual Computing especially in the creation of new apps and content. Also all AI advances are being applied to VisionOS and even adapted in clever ways: Siri AI can be activated by just looking at the glowing orb that embodies it in the spatial world.
Clearly Apple is not deprecating Spatial Computing. It's a remarkable creation and those of us who use it find it irresistible and irreplaceable.
What the update clarifies most of all is that there isn't an evolutionary branching in the future of computing. The touch UI did not immediately obviate the need for traditional personal computing interfaces. The smartphone brought computing to more people and more contexts but keyboard and pointer computing cannot be fully replaced by touch. We have a situation where there is co-existence between touch and non-touch computing. Indeed we also have sensor computing in the form of Apple Watch and AirPods. Perhaps there were will also be Apple spectacles to expand the compute real estate on the body.
Intent computing will probably reside primarily with our phones and wearables but Spatial Computing will strengthen their position alongside keyboard computing. Spatial was always a "high commitment" interface. To use it you strapped in, settled down and became acclimated. Then you became productive. A session was going to last at least 20 minutes, perhaps even a few hours.
Intent computing is a few seconds of use. Perhaps a few seconds strung out in multiple sessions but it was far more "glance" computing than "sit down" computing.
So why not have all forms of computing?
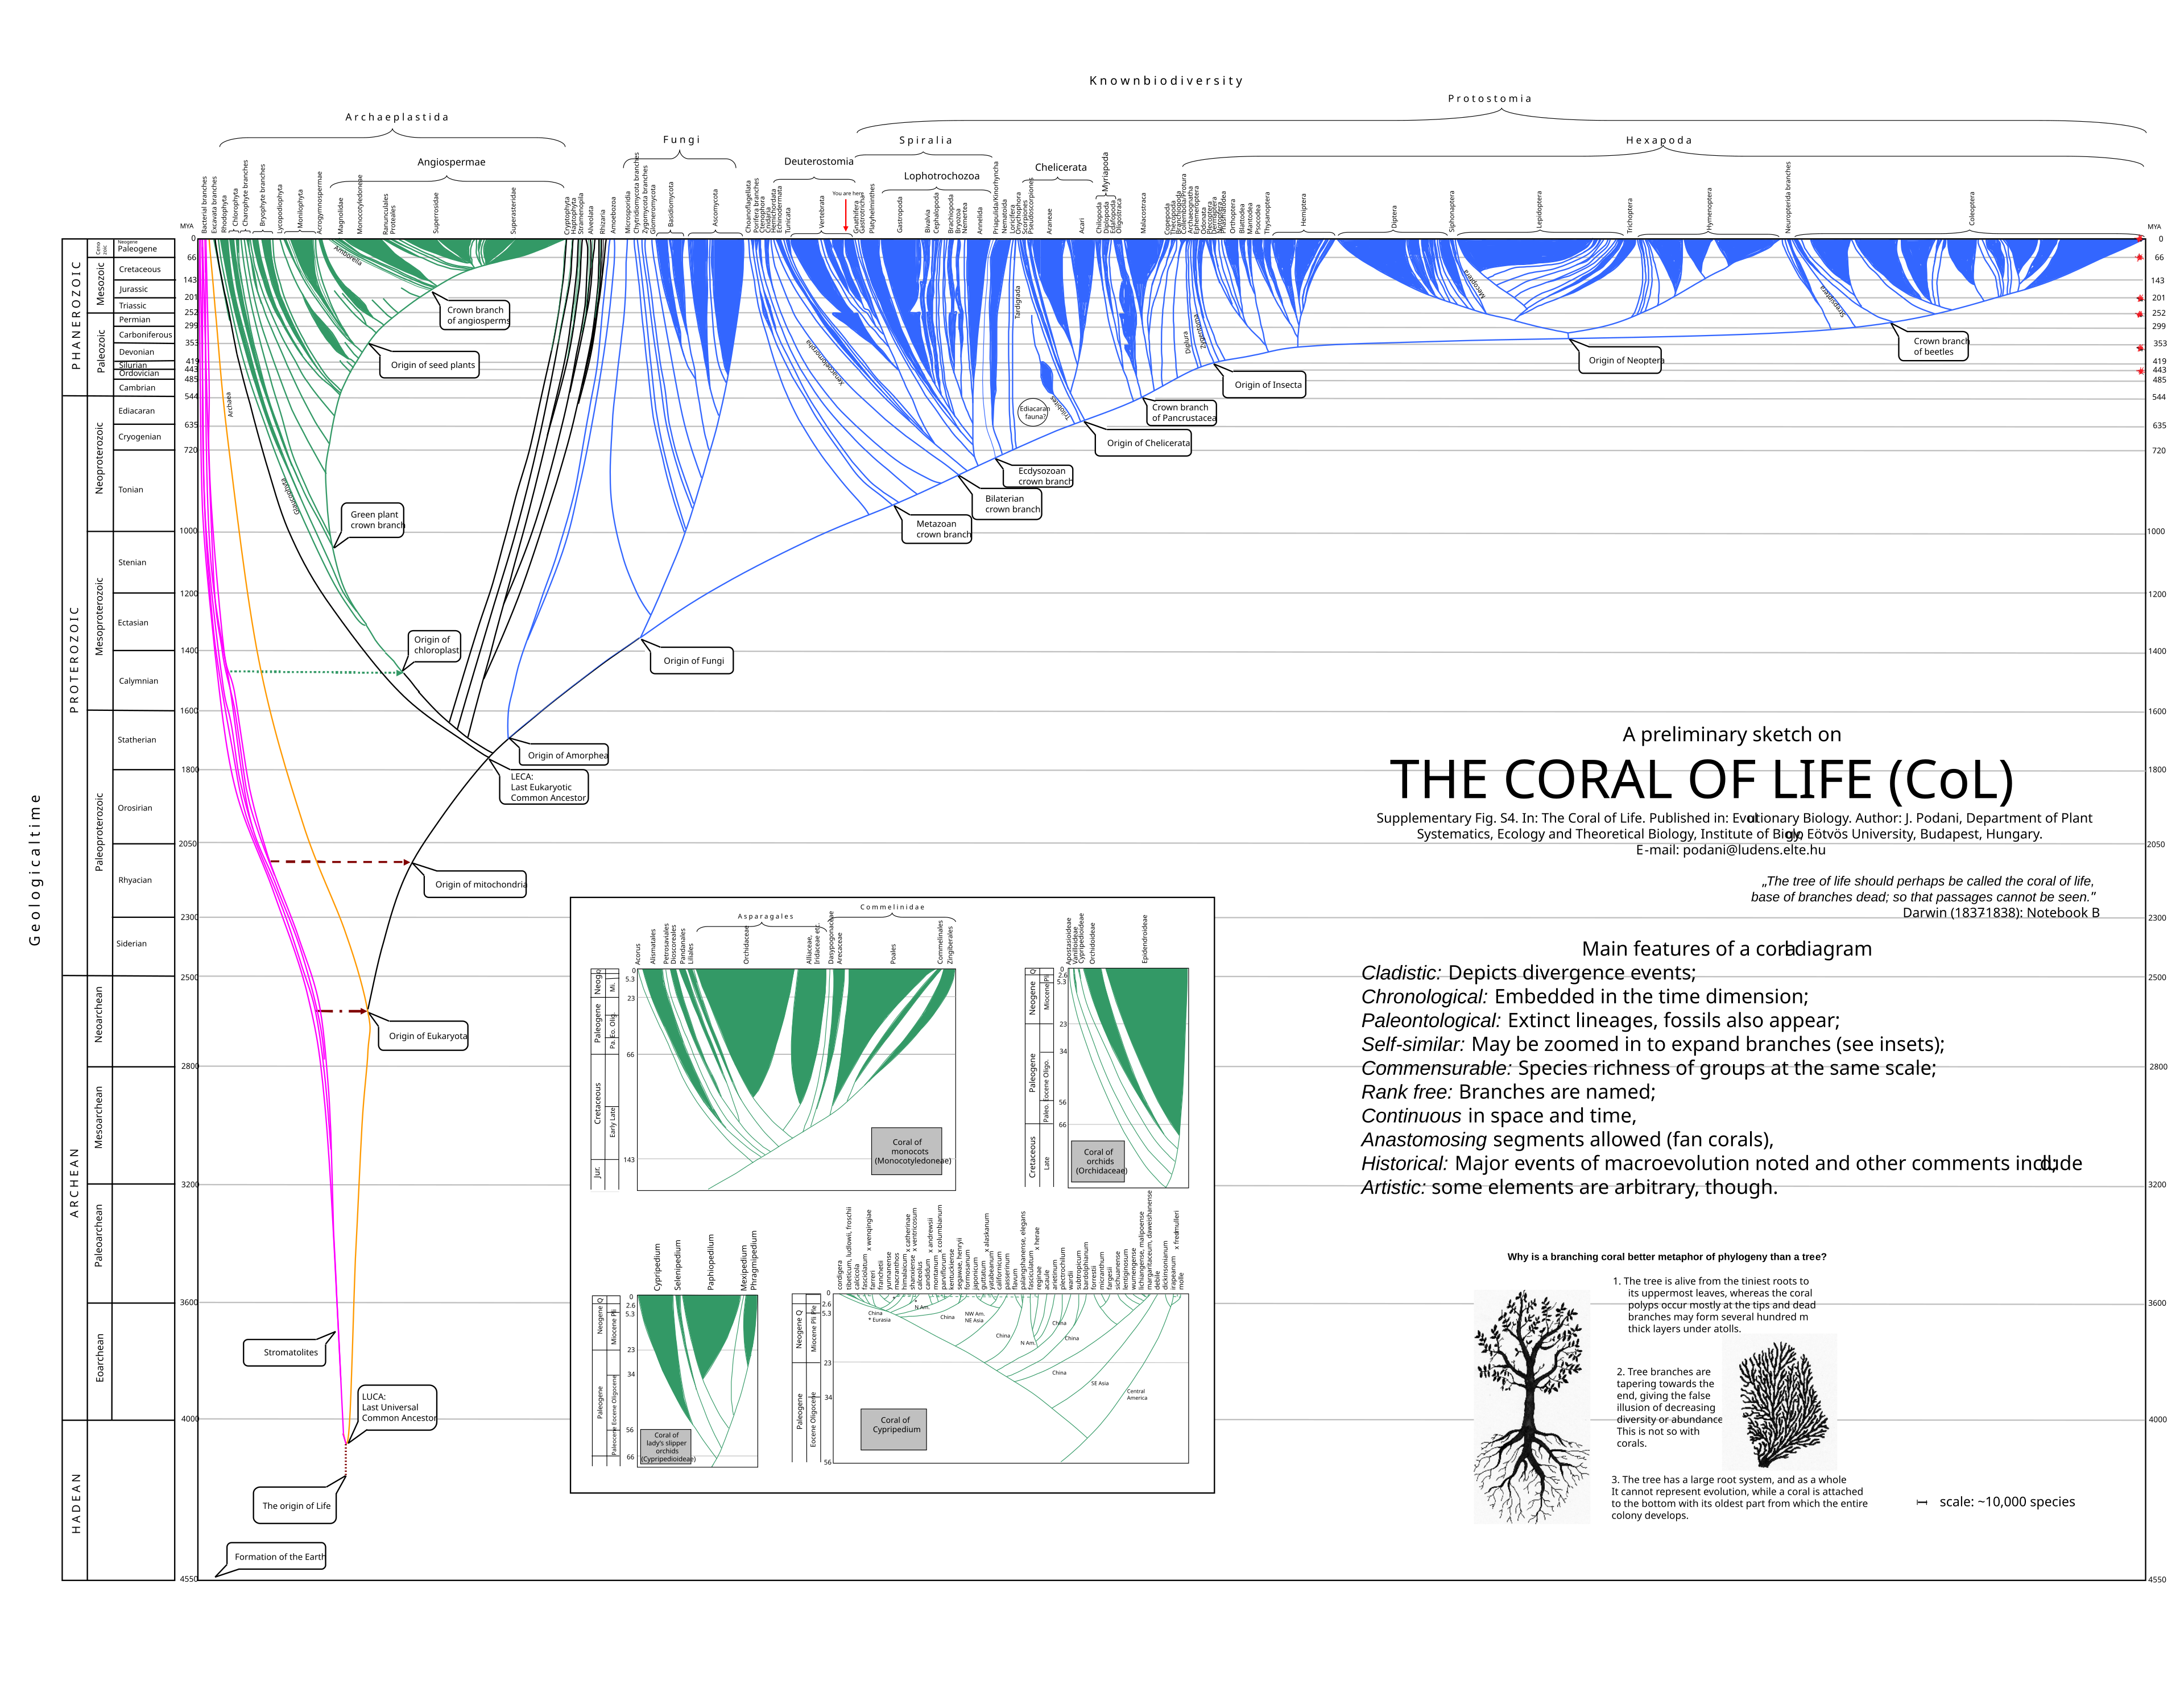
As the diagram on the coral of life shows, evolution results in a multitude of "form factors". Some do become extinct (see the scroll wheel iPod or the stylus PDA.) But most survive and coexist.
Spatial Computing is extraordinarily powerful. It will evolve and it will probably become the highest utility for those who create.
We expect our June quarter total company revenue to grow by 14%-17% year-over-year, which comprehends our best view of constrained supply. On iPad, keep in mind, we face a difficult compare driven by the launch of the A16-powered iPad in the prior year. We expect services revenue to grow at a year-over-year rate similar to what we reported in the March quarter after removing the favorable year-over-year impact from foreign exchange tailwinds. Keep in mind, during the March quarter, FX was a 2.5 percentage point tailwind to the total company growth rate, and for services, that impact was slightly more favorable.
We expect gross margin to be between 47.5% and 48.5%. We expect operating expenses to be between $18.8 billion and $19.1 billion. We expect OINE to be around $250 million, excluding any potential impact from the mark-to-market of minority investments, and our tax rate to be around 17%. With that, Tim and I will take questions.
- Kevan Parekh, CFO
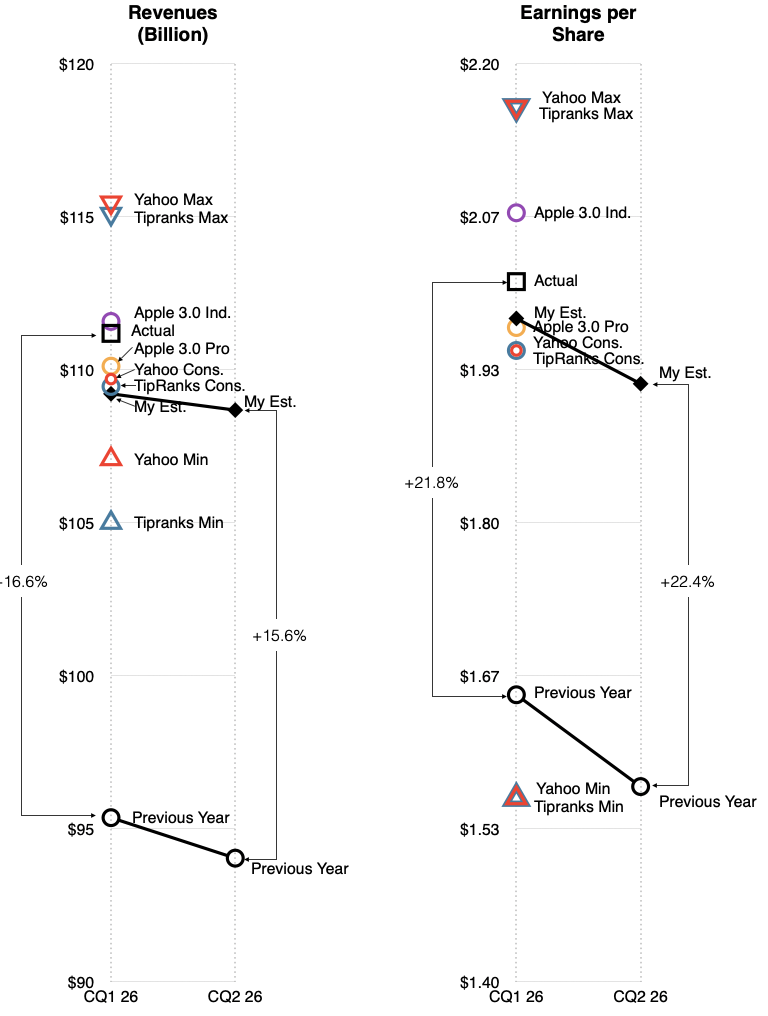
Based on the above, here are the estimates for Revenues and Earnings per Share
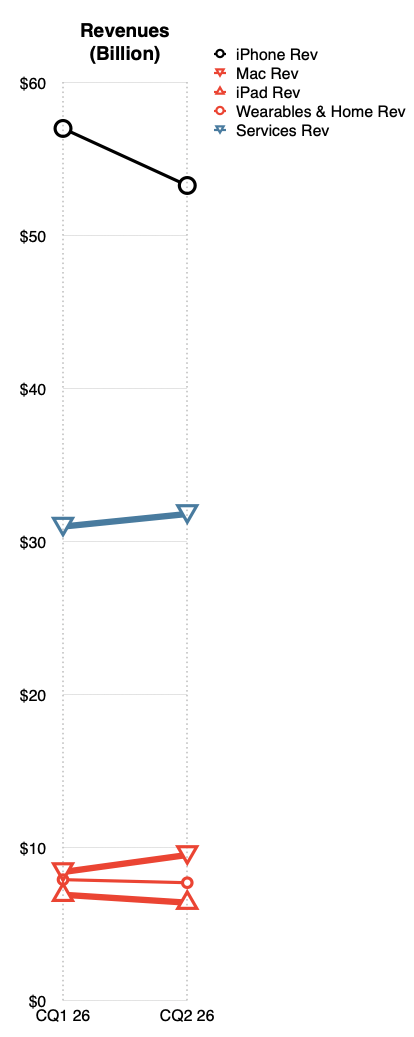
Sequential change in segment revenues:
My Revenues and EPS expectations in table form:
My segment revenues and growth expectations in table form:
Note that the revenue expectations are for 15.6% growth while guidance is at 14% to 17%. Chances are that they will hit the upper end of the range and I may revise these estimates to reflect that as we get more data.
A transcript of the May 1, 2026 Asymco One Office Hours, recorded one day after Apple's Fiscal Q2 2026 earnings call. Horace Dediu presents his analysis of the quarter and takes questions from Asymco One subscribers. Hosted by Horace Dediu and Farshad Nayeri.
Horace Dediu: So I'll do a short presentation, and then we're going to open it up for questions. We are speaking approximately one day after Fiscal Second Quarter 2026 earnings call. Let's dig into it and see if we can understand it even better.
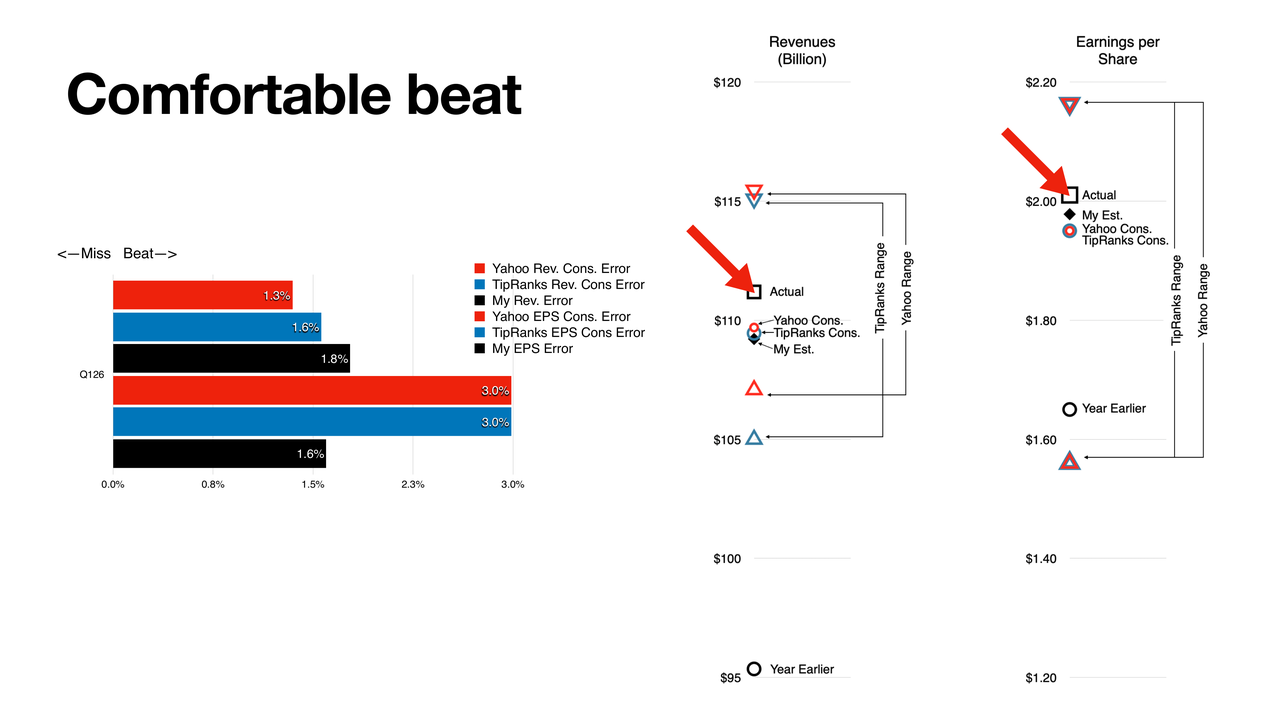
First, I think that there was a comfortable beat from already a highly elevated expectation.
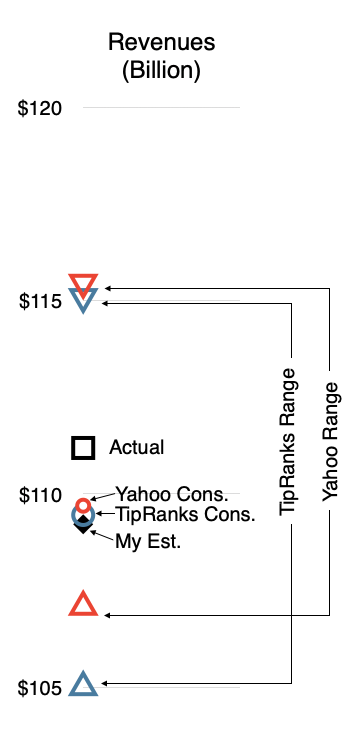
So we had a range of estimates— I collected those from Yahoo and TipRanks, each one had about 30 [analysts], probably a lot of overlap between them. So we had a range of about 105 to 115 in terms of revenues in billion, and then we had EPS in a range of about 1.6 to about 2.15.
And not only did it beat the consensus, but also you can see what happened a year earlier, which is the circle at the bottom of the graph. So the beat was from already a pretty high growth rate expected from the year before.
So we have a measure of how each of us, myself included, performed relative to the actual results.
I was about 1.8% under revenues delivered, and 1.6% on EPS. And then you can see red is Yahoo and blue is TipRanks.
So speaking for myself, I was perhaps a little bit too conservative on my revenues, and I was a little bit more accurate, relatively speaking, on EPS. Roughly speaking, again, I think these are not big errors, 1% to 2%. Worst case, 3% on the consensus basis.
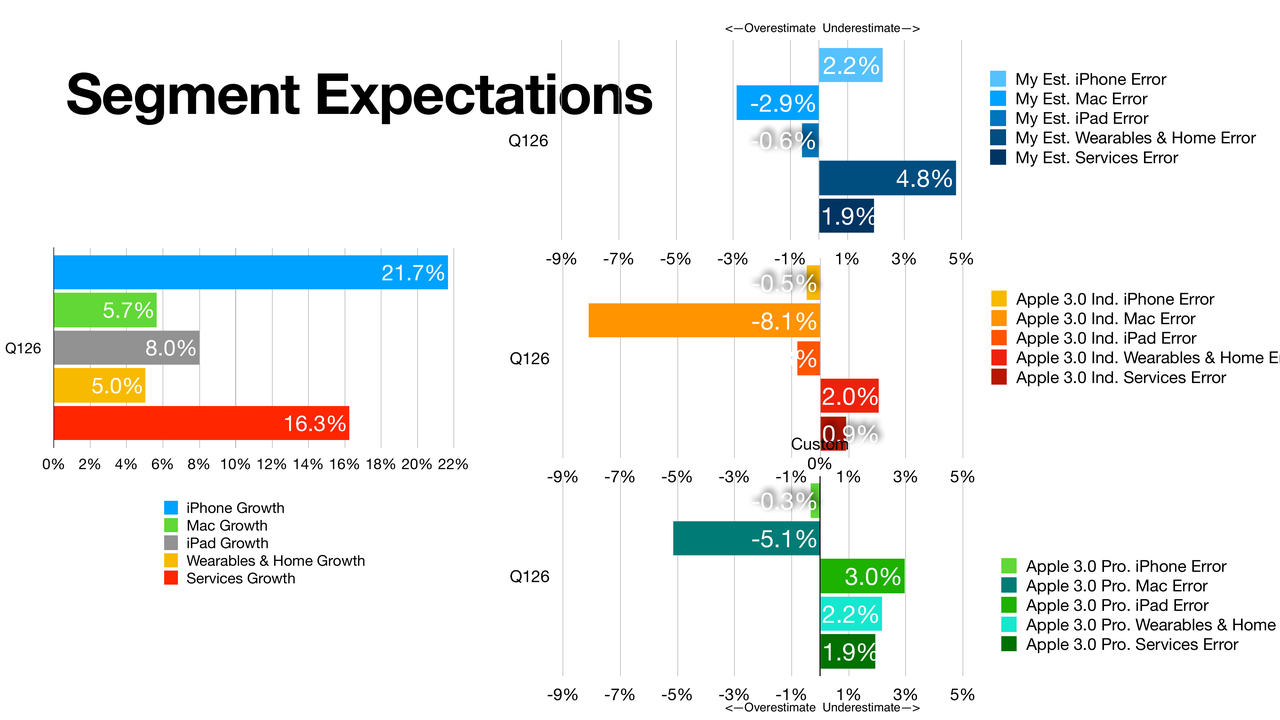
Now, on the segments, these are the actual growth that we ended up with, iPhone almost 22%, 16% on services, 8% on the iPad, which is impressive. 5.7 on the Mac, we'll talk about that a little bit, and 5% on wearables and growth.
Segment level, again, the worst case, you're looking at an 8% overestimation on the Mac. The Mac— I think a lot of people, once they saw the Neo come out, once they heard about the Mac mini stockouts, when they heard about the Claude bots, you know, everybody buying up all these Macs, there was an expectation of a big boom in the Mac, but those all happened fairly late in the quarter. My expectation was a little bit over, but not as much. I was off about 3% on that estimate. So although we saw 5.7% growth, some people expected double digits. Also, the pros had the same fault there.
Overall, though, I think these are pretty impressive. I didn't break out the geographic segments. China grew extremely well. Rest of the world, that grew very well. Management also pointed out that they're doing very well in developing markets. So overall, regionally, there were some extraordinary performances. But as we see here, just the iPhone was incredible, 22%. Very similar to performance in the previous holiday quarter, where, again, unprecedented growth, or at least in the near history of the product.
And we'll get into some reasoning why that is. People talk about super cycles, people talk about the assumption that we have these giant surges once in a while. Well, here's how to look at it.
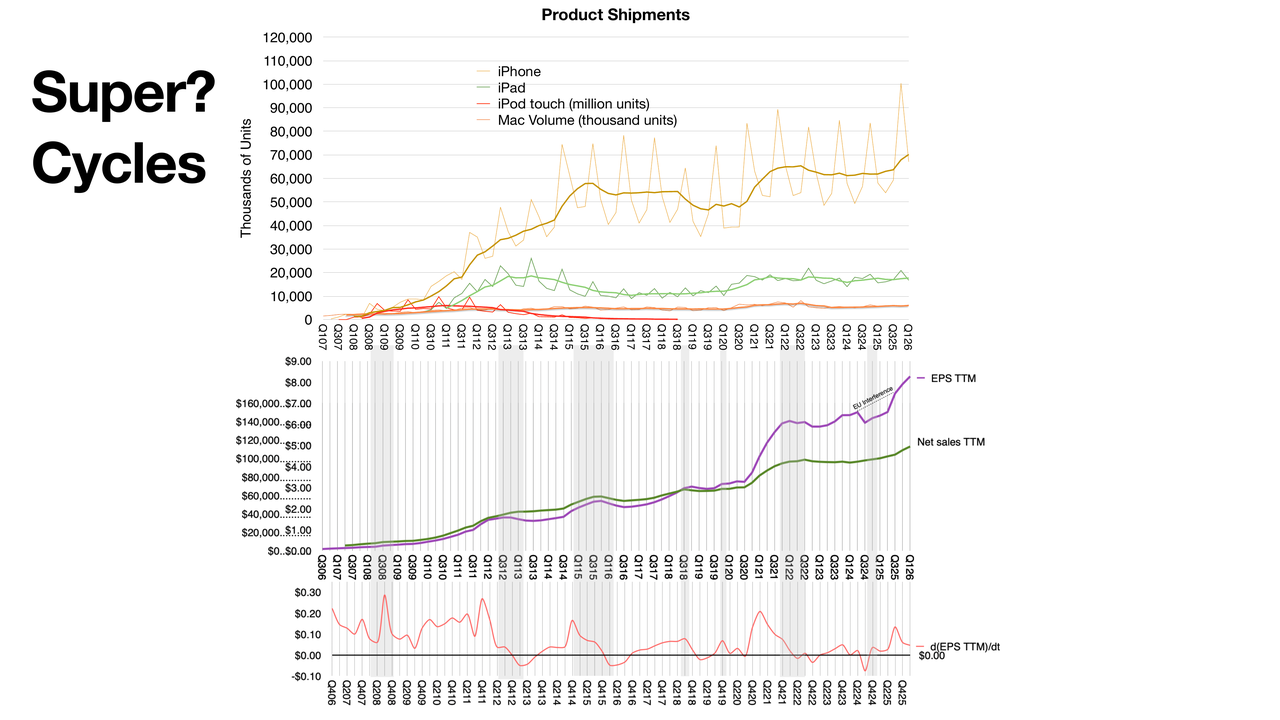
There are two graphs here. The bottom graph shows in green the net sales, but trailing 12 months, so it's smoothed out, so we don't see the spikes on the holidays. That's the green line. Above that, we have the EPS line. Now you'll see how they tracked very similarly for a while, and then they began to diverge. That occurred around COVID. It also occurred during the surge in services, especially subscriptions and services. But still, there's a similar pulse, if you will, a cyclicality to it.
I mean, part of that has to do with the introduction of a new form factor. This has been true all the way back since 2012. When a new iPhone comes, especially a new, distinctive-looking iPhone, people will go out, especially in China, buy it for showing off that they have the latest, which there's nothing wrong with that. But then the second year usually is not the same, the phone is not new, it's the same form factor. That has to do a lot with tooling. That's a long, old story, that the tooling is depreciated on a two-year schedule, so you're going to produce roughly the same look a couple of years in a row, and then by the next cycle, you'll see people upgrading or replacing their older phones. So you're going to have this— I guess what they used to call a super cycle.
And you see it also in the upper graph, where I try to separate out of sales just the phones. Now this is an estimate because we have no unit sales for the phones since 2018, so some of that is an estimate. But you'll see again, once you smooth out the cyclicality, you'll see these surges once in a while. Now, again, this is a valid observation, but I don't think it's the main driver. The oscillation isn't huge, it might be significant, but it's a blend of many things.
The bottom graph is particularly interesting. The gray areas are when the stock price fell. And the red line represents the derivative of EPS. And you'll see how, when that is about to dip, there's usually a stock price sale going on. I wouldn't say it's predictive, but it's an interesting pattern to go through.
So what's happening now? You'll see from the iPhone, there's a new surge happening. Now, when Tim has been asked this question, he says that, well, the iPhone 17's really nice, people really love it, and that's a good answer, but the fact is, it's a distinctive-looking product. Some say it's the orange color, but it's certainly attractive. So we're seeing this pattern, a nice surge.
We'll get into the guidance in a minute, and that actually demonstrates that we're in some kind of an acceleration. But here's the thing, underneath all that, services is just absolutely steady growth, compound growth, and as a result, it just lifts the whole story.
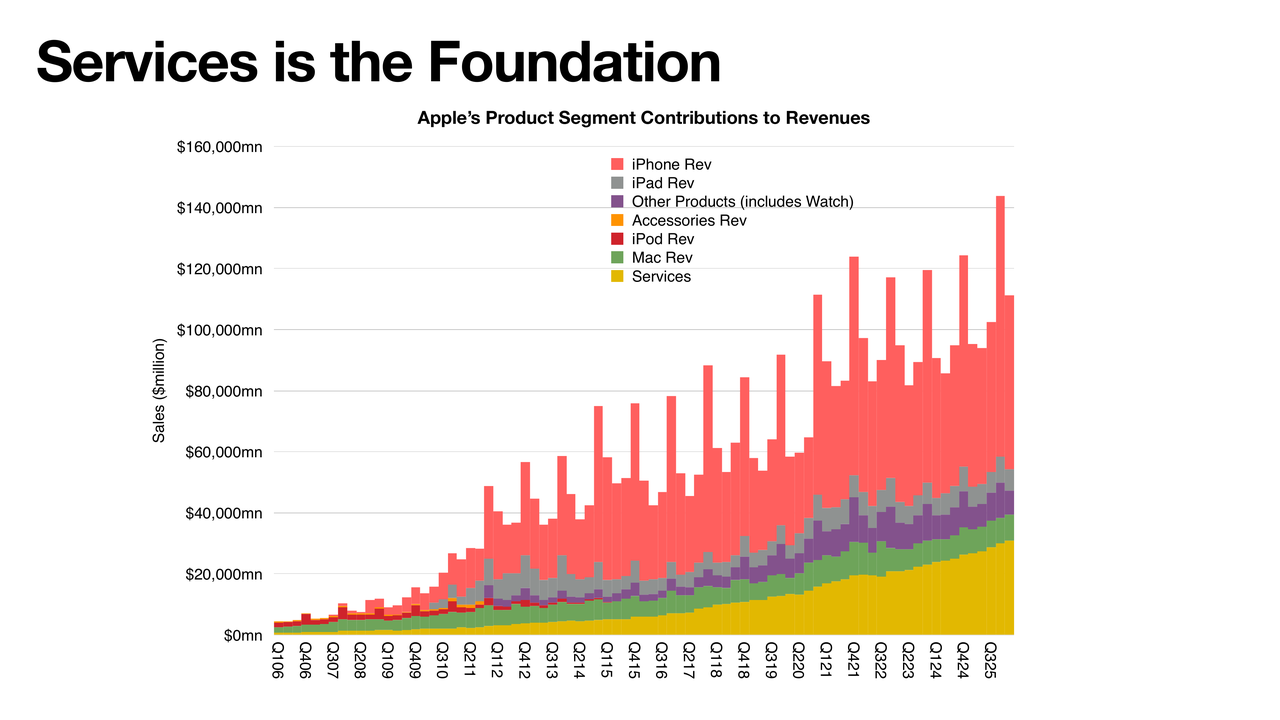
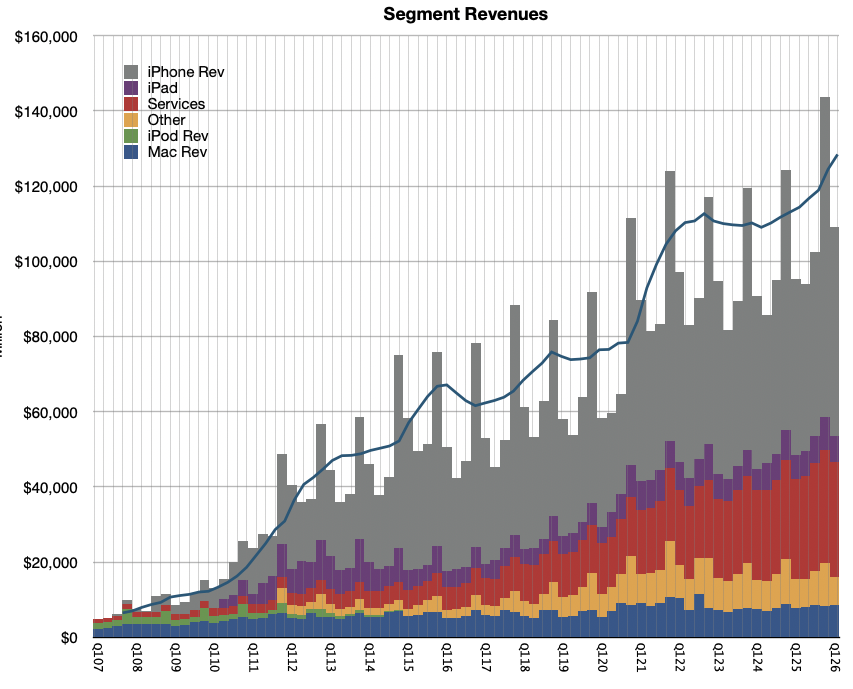
Here, services is at the bottom. Normally, in a graph like this, you want to put the oldest products at the bottom and the newer ones at the top, but I wanted to highlight the fact that services is foundational, in the sense of showing how it holds up everything else.
Most people put it the other way, they say the iPhone holds everything up, but services is looking more and more to be the thing that keeps people in the ecosystem. There's a lot of value there. There's a lot of things people depend on there, and I think it's one of the reasons people don't switch. So it's another one of these stories that people aren't appreciating enough. It's been years and years of pounding the table on services, but here you see it, just how important it is. It's the tide that lifts all the boats, and the boats being all the products.
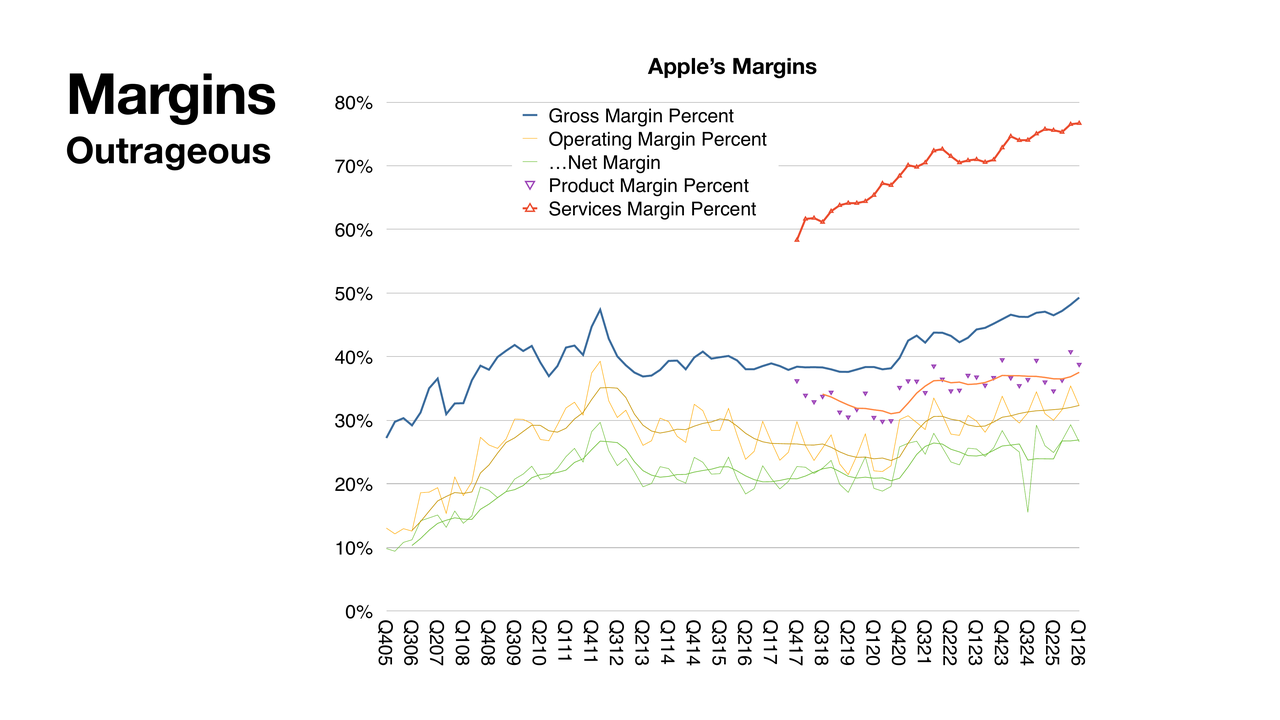
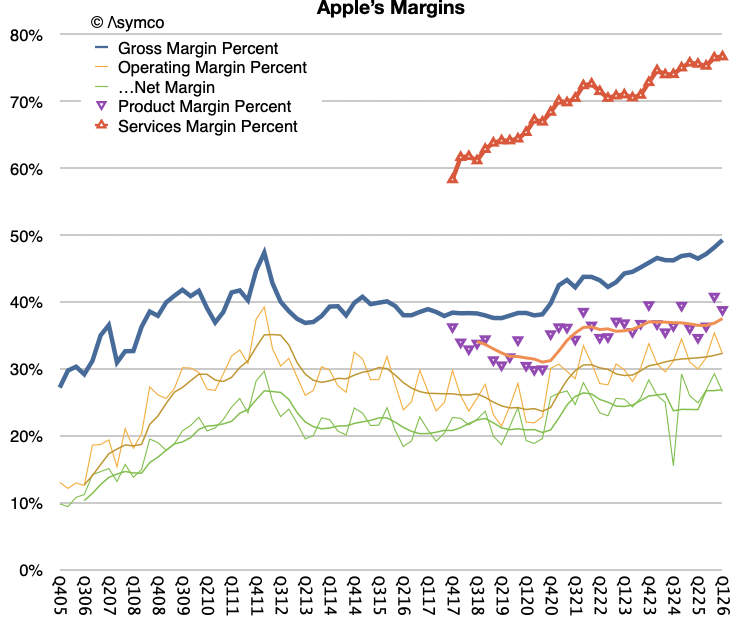
So let's now talk a little bit about margins. Unbelievable, unbelievable margins. We just hit almost 50% on gross margins. Gross margin here is the blue line. And that's composed of two subcategories. We have services in red at the top, and we have products with the purple triangles.
And although products margins are exceptional— they're right around 40%— those services, again, are pulling the whole average up, and you can see that bend in the curve in the blue line, where we were very steady around 40%, but as services took more and more; it just pulled the whole curve up.
And we also see here operating and net margins, which also are going up, naturally. There is a little bit more operating expense. We'll get into that, which maybe decreases the slope of the bottom line. But this gross margin is absolutely incredible. We just haven't seen anything like this since 2010-11. We saw that surge back then, and then it sort of leveled out, and everybody was happy with 40%, and now we're flirting with 50. I just cannot believe it.
Just one more thing. I remember being an analyst decades ago, when I was looking at different companies in hardware and software, in phones and computers and so on, and everybody was really impressed by Microsoft, because Microsoft, had an 80% gross margin, because there was very little cost of sales. That's exceptional. An 80% margin business is a money printing machine. And everybody was impressed and jealous of Microsoft that they could pull that off. Of course, Microsoft, a software company, is going to have extraordinary margins, right?
And so for a phonemaker like Nokia, there was something to be jealous of. And here we are with Apple services, a significant component on the business, approaching also almost 80% right now. And it's still rising. I just can't get over how impressive this is.
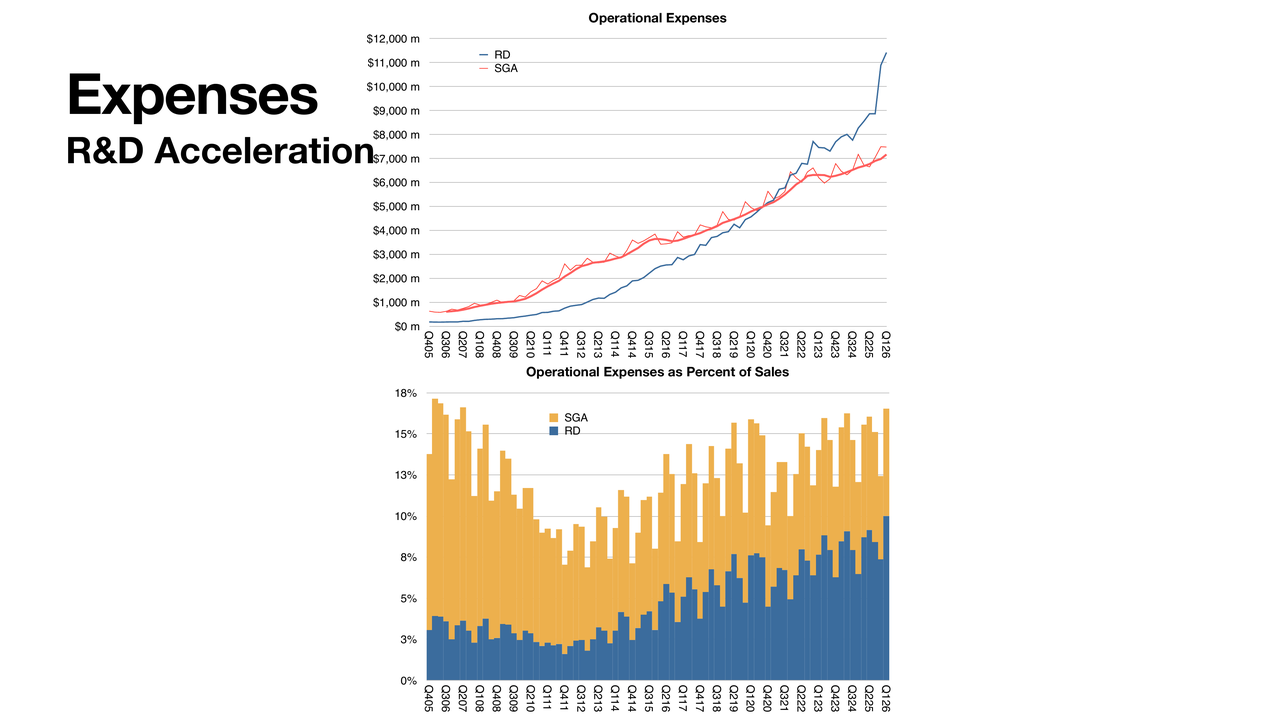
R&D Acceleration
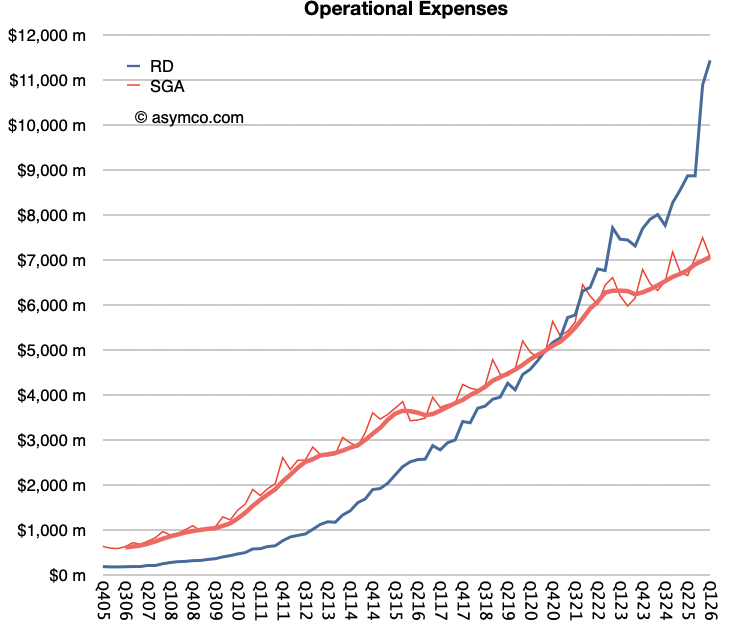
A little bit about the difference between gross and net— you have to take out the operational expenses, and this is what we have here. It's interesting what's happened. Obviously, you see R&D overtaking on the absolute basis. So R&D overtook SG&A already in 2021. And now it's just [going] almost vertical.
By reading a little bit the guidance, I think it's going to taper a bit into the next quarter. But what we see is a significant R&D increase, also as a percent of sales, which you're seeing below in the graph below, but in a stacked fashion. In that sense, the two of them together are now approaching— haven't yet reached— a percentage of sales that was in evidence around 2007 and 8, when the iPhone was just emerging. But you'll see back then, R&D was tiny, SG&A was huge as a percent of sales. So much so that R&D—this is during Steve Jobs era, R&D was like 2% of sales. And now it's approaching 8%, which is extraordinary. Because that's an engineering company that's doing breakthrough work.
And that's something that Apple's not recognized for doing. There's a negative side of spending a lot on R&D. The positive, though, is that Apple is doing a lot of fundamental research now. This isn't fixing products, this isn't updating OS. This is engineering that is really driving what might be considered breakthrough. And that's something— and I've said this to the media when interviewed about Ternus and the succession— I said, the new CEO will need to be— this is before he was announced— I said [the CEO] would need to be someone who is acceptable to engineering, because Apple is an engineering company today. Fundamentally, culturally, operationally, it's an engineering company, and it is being now led by an engineer.
Steve Jobs was not an engineer. And none of the other CEOs were engineers. Tim Cook was an operations manager. He was excellent in a fundamental part of the business. And that is acceptable to engineers, culturally speaking. But the thing is that John is an engineer's engineer. He understands the culture of engineering and will understand how to motivate and retain talent, as well as to allocate capital effectively, not wasting it on pipe dreams. Engineers have a tendency to try to chase dreams, by the way, so you got to be harsh sometimes to shut things down. So, keep an eye on the R&D— it's a great story.
However overdoing it can be a problem. There are downsides to an engineering-led company where, again, it turns into kind of an engineering welfare state. Engineers tend to get projects and do a lot of navel-gazing, which needs to be managed carefully.
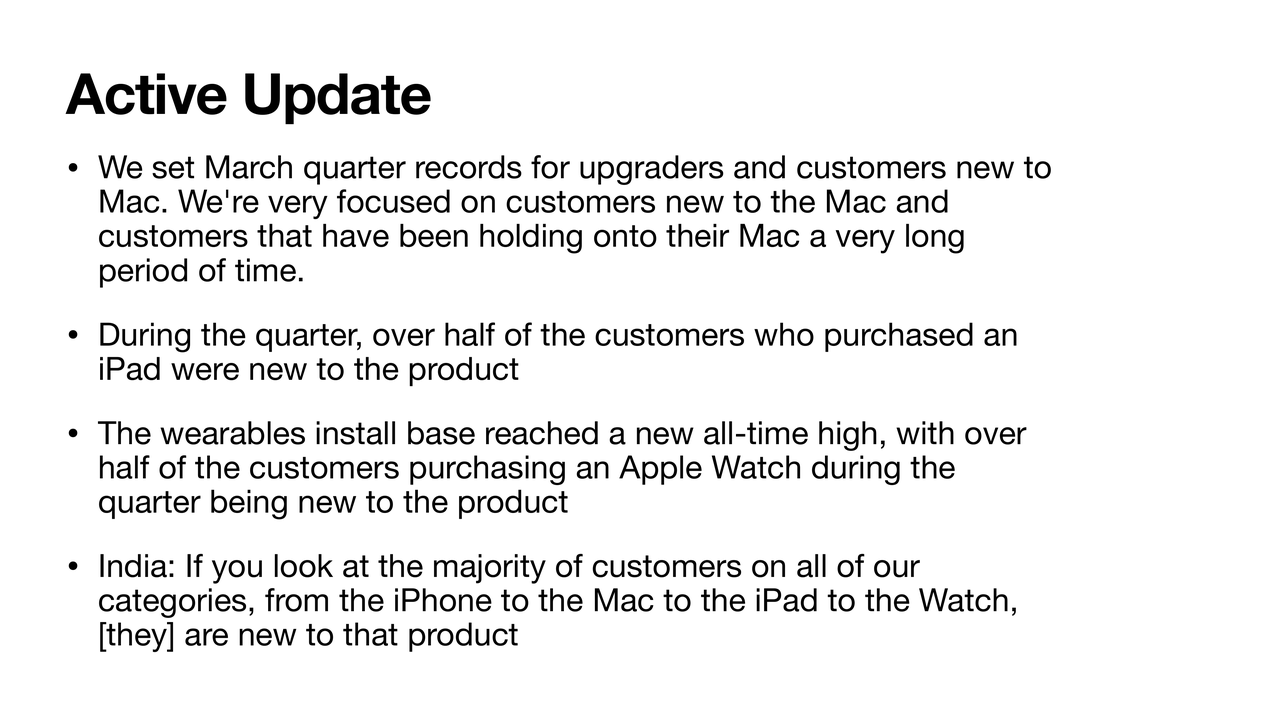
Now, let's just touch on ACTIVE. Active is the number of users, the fundamental measure of the value of the company. It's not counting iPhones. It's counting users, and these are the comments from management, just so we capture them. They come every quarter. Sometimes some products are mentioned, sometimes they're not.
So here's what we have exactly on the topic. Record upgraders and customers new to the Mac. They mentioned that Mac lifespans have been long, which is good and bad. They talk about the iPad, half the customers being— over half— new to the product. Same with the Apple Watch, this has been going on for a while.
So this is going to be important when we measure installed base, because if we see every quarter an estimate for the number of watches, or Macs, or iPads, you just take half of that and allocate it to the installed base, and the other half is growth of the installed base. So there's an interesting way to measure that, and I've been applying it. We're going to keep an eye on this.
And finally, there was a mention with respect to India during an answer to the question. The citation is that the iPhone, Mac, iPad, watch, all of these have a majority of customers that are new to the product in India. As you would expect, part of the developing market story. But this drum is still getting beaten. And that's a positive. Always want to look forward to that every quarter.
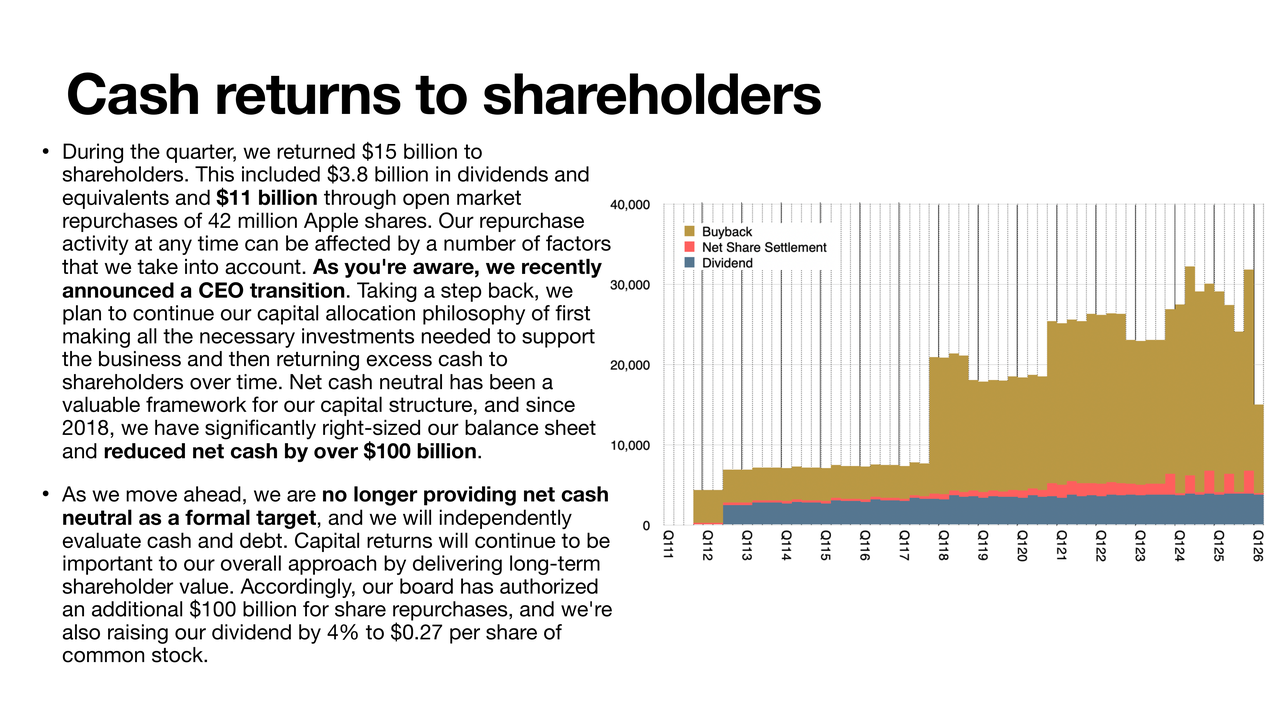
So let's jump in now to what I thought was the most unexpected comment during the call. I've pasted in here exact, verbatim the comments from the CFO. I need to point out a few things here, and I've highlighted these things in bold.
One is the dividend. The dividend number is 3.8. Last quarter was 3.9, so that's not a surprise. However, open market purchases were only $11 billion. Now, that is represented in the graph by the buyback, and that is this mustard color. And you'll notice it is extremely low. The previous quarter, we were over 25 on buyback, so we're less than half that. This is an anomaly. You'll see that it does not match the rest of the graph at all.
The blue area is dividends. The reddish area is net share repurchases, or settlements. And there's a pattern to both. Dividends has been growing in a predictable fashion, very steady. Buybacks have been somewhat steady, but up and down a little bit. During the last few periods, we've seen something unprecedented.
Now, you'll see that the 11 from last quarter was offset by a much higher number the previous quarter, but on balance, we're still down. And there's also these comments that say that they are abandoning the net cash neutral position. And I'm wondering if it's already started, because this $11 billion caught me by surprise.
I've highlighted that "our repurchase activity at any time can be affected by a number of factors that we take into account." So this was essentially explaining why sometimes there's a difference in the amount of purchases, right? And then in the middle of that commentary, he says, "as you're aware, we recently announced a CEO transition." Why does that comment fit in the middle of a paragraph, talking about the general theme?
I read this as it suggests that already the CEO choice is deciding how much to allocate to capital returns. And it appears— and again, I could be wrong— but it appears that John is probably against the idea of huge returns to shareholders in capital form. So keep an eye on this. This was, I found, very, very strange and out of character in a way. Very out of character of a Tim Cook presentation. I'm not judging it, I'm just pointing out that it isn't normal.
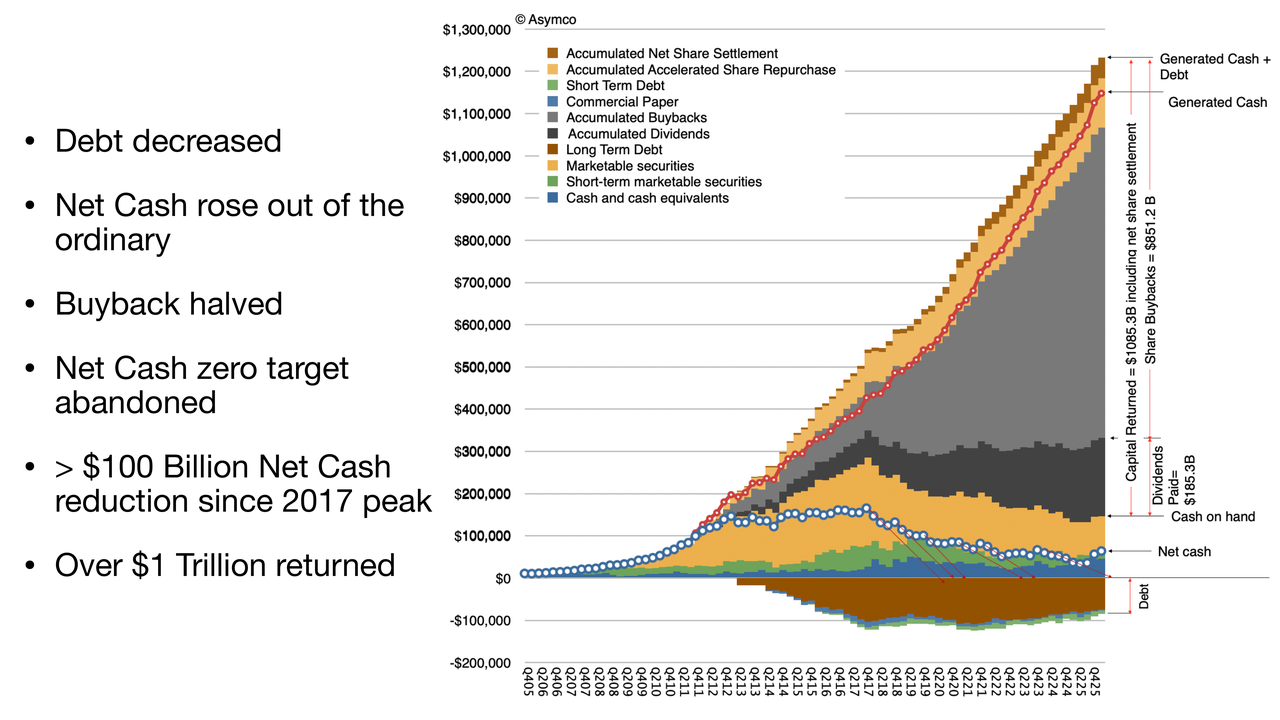
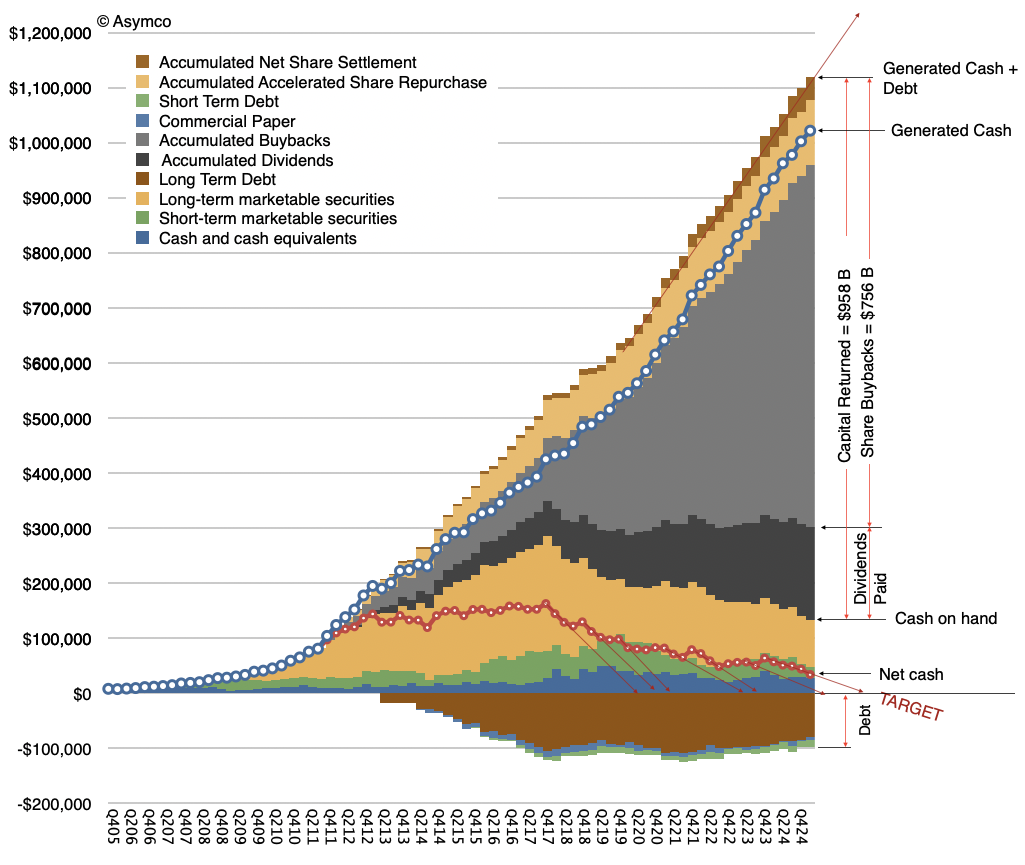
So here's the bottom line. This is the graph representing what's happening with the entire cash position and return of capital. The debt has decreased slightly, and it has been decreasing. And that's a good thing. As interest rates go up, you don't want to hold debt. A lot of that is fixed rate, but they're not taking on more. It seems like they're paying it down.
Net cash, which is the blue dotted line, has now been increasing two quarters in a row. Now, it's increased in the past, but never for long. It's had only one tick, during the holiday period. Here, where we're seeing two ticks— holiday and the quarter after.
Now, if you'll notice here, I'm going to try to zoom in. Those red lines represent what I would say were the trajectories to get to net cash zero. So that blue line, since they announced it, they kept missing the target. You would see that, another year goes by, and there's a notch up. Overall, the trend is down, but they haven't kept that path down all the way to zero. And that is now completely abandoned.
Again, we'll have to figure out why. The buyback, as I mentioned, halved— at least more than halved— to 11. Net cash zero abandoned, $100 billion net cash reduction. You'll see that this blue dot line has gone down by about half. It was down even further than that until it came back a bit. So that is going from about $160 billion net cash to the current $62 billion, which is why we get to 100 reduction. And $1 trillion overall return, which is, again, something they mentioned. In fact, they're at $1.085 trillion. And still $100 billion will be allocated further. Whether they actually spend it is another matter, but that's been approved.
So now— is this good news or bad news? I don't think it matters. I think at the end of the day, the value of the company doesn't change because of this. The value might be captured in the share price, or it might be captured as a percentage of the company that has been increasing.
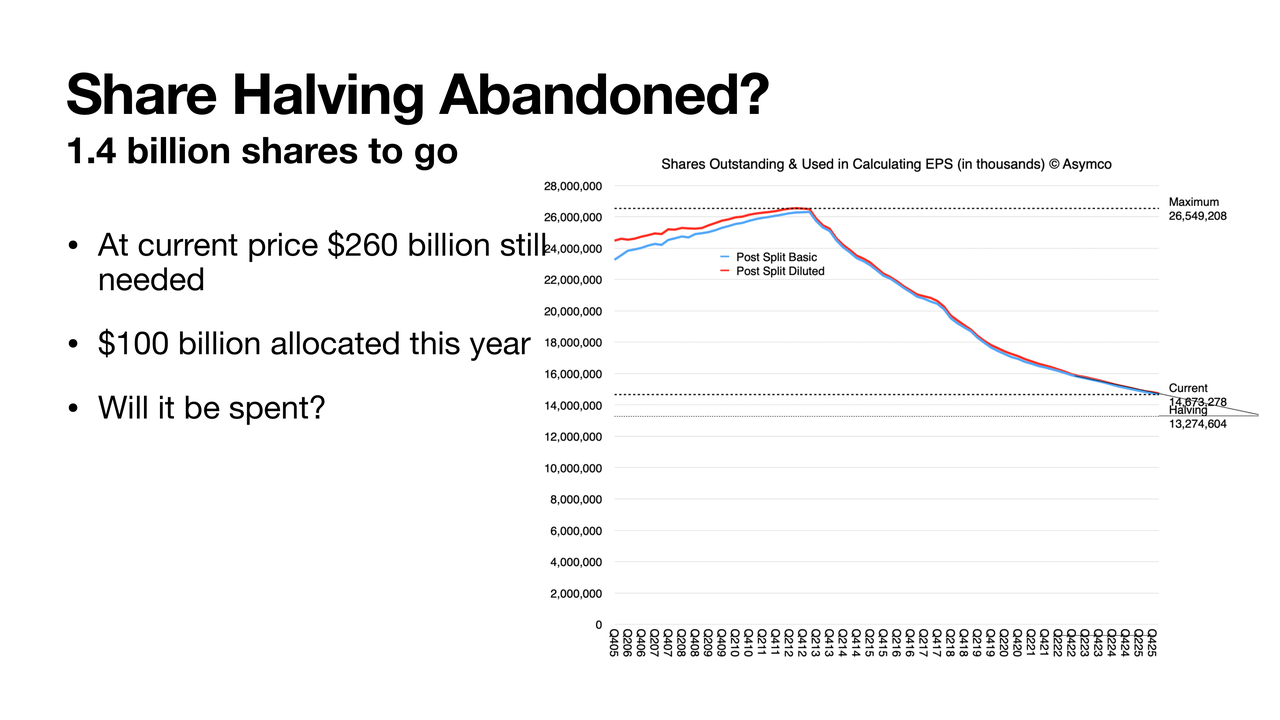
In fact, let me just pop into the next slide. What does this mean? Are we never going to reach what I call the halving? Well, we were at the maximum 26.5 billion shares. And now we've reduced that to about 14.6. Half would be 13.2. So we're still going down. But there's 1.4 billion shares to go before it's half of what the max was. Now, this is an arbitrary figure. I just thought it was an interesting target to have. And as you can see, it's getting asymptotic as the price goes up. It should be harder and harder to get there. But we have $100 billion allocated. $260 billion at the current share price would need to be spent to get to half. But probably we're not going to get there. I really don't— if I were a betting man, I would say we're probably going to see this taper.
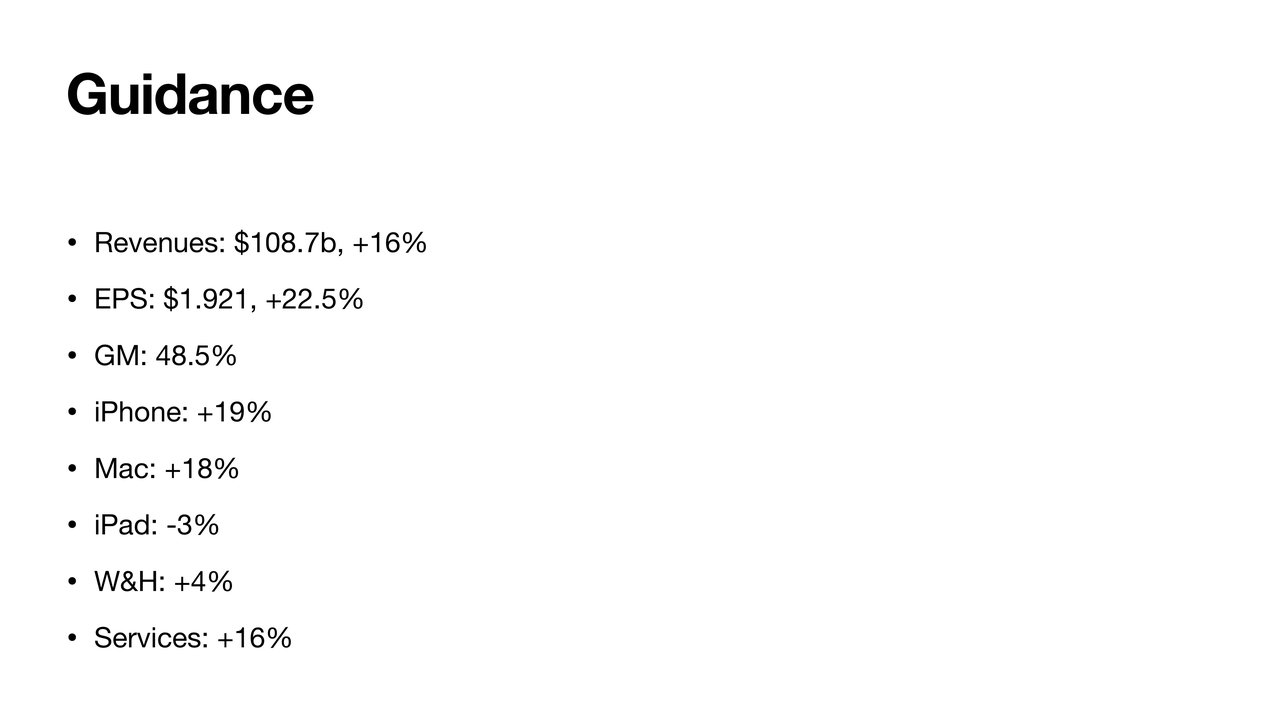
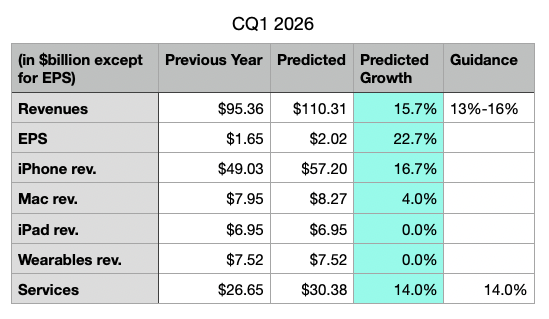
Let's look a little bit at guidance. This is based on what management already communicated. So if you put in the numbers they gave us, you will get revenue growth of 16%, coming at about— well, they guided 14 to 17, so I'm estimating 16 conservatively right now. That gets you to $108.7 billion. If you put in the other numbers— the margin, the OI&E and the tax— and do something about this share reduction. (We're still going to probably see a share reduction.) We're going to look at EPS 1.92. Which is another 22% growth. This is what we had last quarter as well.
I'm putting gross margin at the top of the guidance. [Last quarter] they went over. They guided high, and even so they went over, so I'm going to assume they're going to still hit towards the upper end of the range. I'm exactly at the upper end of that range.
If those things are true, the iPhone almost necessarily has to grow about 19%. Now, here, I'm dialing the Mac way up to 18% growth, because I do think they're going to get a lot more Mac Neos into customers' hands. Now, that's a lower price point, but it will drive sales. So yeah, I could be a little bit high on this. If I am, then iPhone needs to go a little bit higher because I still think they're going to get the revenue there.
They did warn that iPad is facing a tough comp, so I'm putting iPad down 3%. Wearables and home, 4%. It was 5% last time, so maybe consistency there. And Services, just the same as before, 16%, could come in a little bit less. But if it does, again, it's going to be put into something else like the iPhone.
So overall revenue growth, I think 16% is very much being telegraphed. And as I always say, they already have April on their books. They're communicating exactly at the end of April. They're not going to lie to us and withhold data from April. They know about a third [of the quarter] already, so that's why this guidance is so useful.
And, as you saw with my error analysis, nowadays, people's estimates are very close. There's a lot of consistency. We're not off more than a couple percentage from each other. That's just because they're so accurate on their guidance.
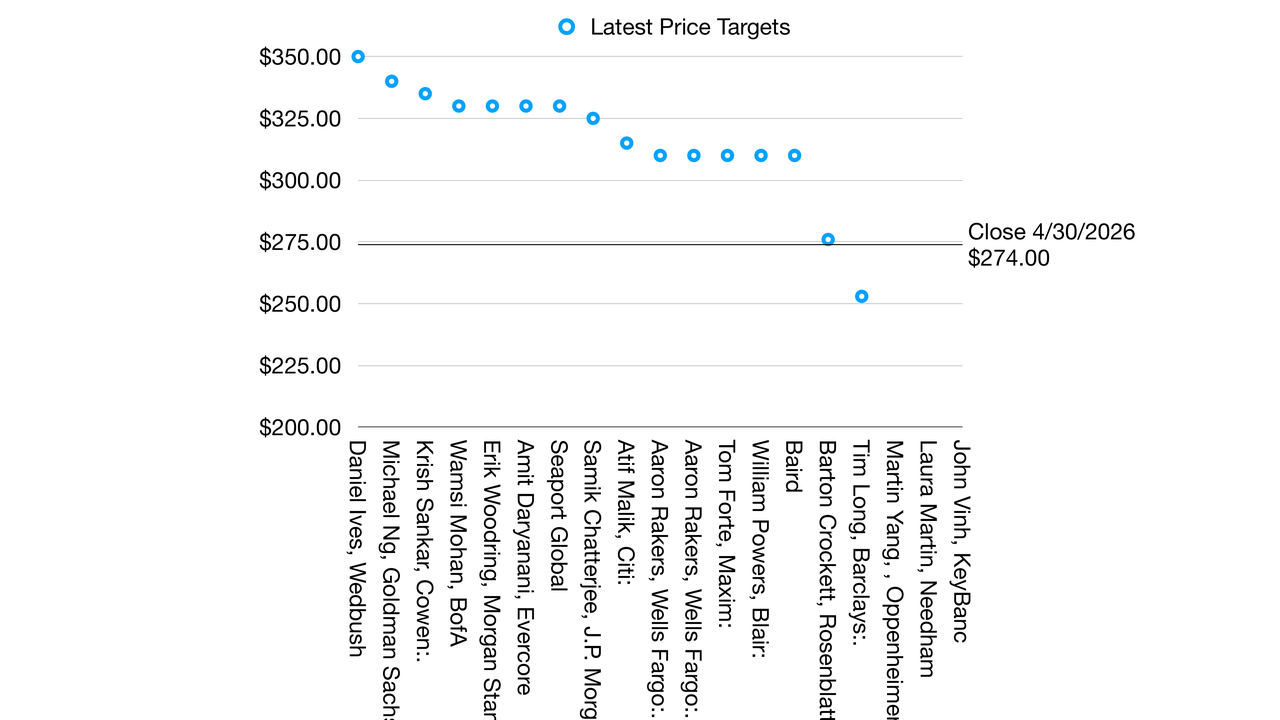
And speaking of analysts, one more graph. This is just some of the latest price targets. I'm just trying to bring everything together that came out today. This is all very brand new. A lot of targets moved up. Not that it's all that important, but people are getting more and more excited. Almost all the targets from anybody who has a positive— effectively a buy rating— is now above $310 as a target. There's two who are negative, that are at 270 and below. This is Barclays and Rosenblatt. And then there's a few which have no ratings. So they're typically neutral.
But overall, all these numbers are higher than they used to be. Now, again, I don't use that very much, but it's worth keeping an eye on things just to get a sense of how the sentiment is out there. And it looks like the stock is responding positively today. Not by much— 3% or so, last I checked. But that's the story today.
So given that, this is my first take on the quarter. Love to take questions.
-- End of Presentation --
Editor's Note: This presentation is made available to non-subscribers for a limited time. Subscribe to Asymco Oneforfull access to this and other content.
Below are Horace's live commentary during the release of Apple FQ2 2026 Earnings, lightly edited. For an in-depth look, and a discussion of what turned out to be a record-breaking quarter, join uss at Asymco Office Hours: Apple Live Q&A.
Transcript: Friday 30 April 2026, 4:30pm-6pm EST | asymco@mastodon
Apple will release earnings at 4:30PM ET and conference call begins half hour later and lasts for one hour. I will try to make some comments as I process the news. This might be the 75th Apple conference call I listen to.
My estimates: EPS $1.98 Rev. $109.2b iPhone Rev 55.716684 Mac Rev 8.640 iPad Rev 6.9552 Wearables & Home Rev 7.522 Services Rev 30.3753
iPhone revenue came in at $56.99 billion. My estimate was $55.71b.
Here is a graph of the expectations vs. actual Revenue results.
iPhone revenues grew 22%. Extraordinary. The growth barely slowed from 23% the previous quarter.
Mac revenue growth was 6%. Slightly less than I expected.
Revenues were up 17%, earnings per share were up 22%. Best March quarter ever.
The board of directors has declared a cash dividend of $0.27 per share of the, an increase of 4 percent. Repurchase program authorized for up to $100 billion for the next 12 months. No surprises here.
Greater China growth was 28%.
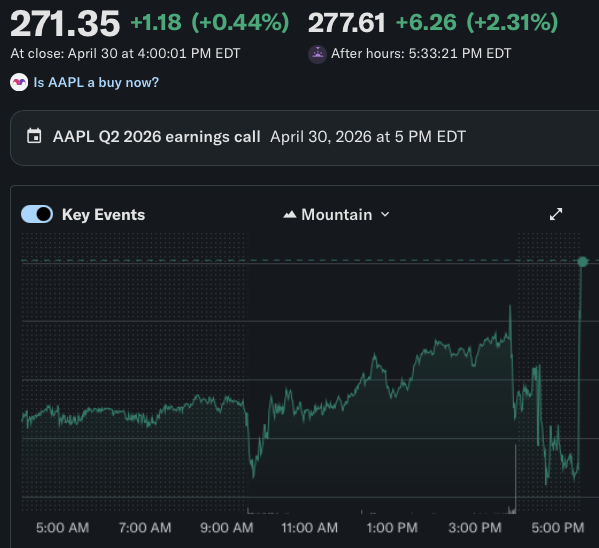
Apple shares are down 0.6% after-hours. Normal drop when company beats on the top and bottom. The big drop comes when the CFO talks guidance.
John Ternus will join the call for a few remarks.
Gross margin came in at a record high of 49.3%. This is three months after the great memory panic of 2026 was declared.
Shares fall 0.81% after John Ternus remarks.
Apple reports double digit growth in every emerging market.
Mention of Mac Neo leads to more drops in the share price as the pain of share growth sinks in. Now down 1% after hours.
iPhones went to the moon, stock not mooning.
“Our strong business performance during the March quarter generated over $28 billion in operating cash flow and drove new March quarter records for both operating cash flow and EPS,” The fact that Apple did not turn over this cash flow t...
5% in Wearables and Home. Modest growth is shameful growth. Compounding shompounding.
Apple has 6 stores in India. So much more to do there.
Supply constraints mean that the growth could have been higher —CFO.
Active iPhone install base grew to all-time high. (No surprise). Customer satisfaction was 99% for iPhone 17 in the US.
Customer satisfaction for Mac was 97%. Half of customers buying an iPad are new to the product. Most of these new customers are in emerging markets. Customer sat for iPad at 98%.
Tap to pay (Apple Pay) now in 50 markets.
Net cash was $62 billion. No longer placing net cash neutral as a target!!!! OMG OMG.
June Q guidance: 14% to 17% growth. Shares recovered to +1.35%.
Margin guidance: 47.5% to 48.5%. Despite the great memory panic of 2026 being in full effect.
Shocked, shocked, shocked that CFO remarks did not crash the stock.
Tim says they did see higher memory costs. For the June quarter they expect significant higher memory costs and more beyond that. Still, margins are brilliant.
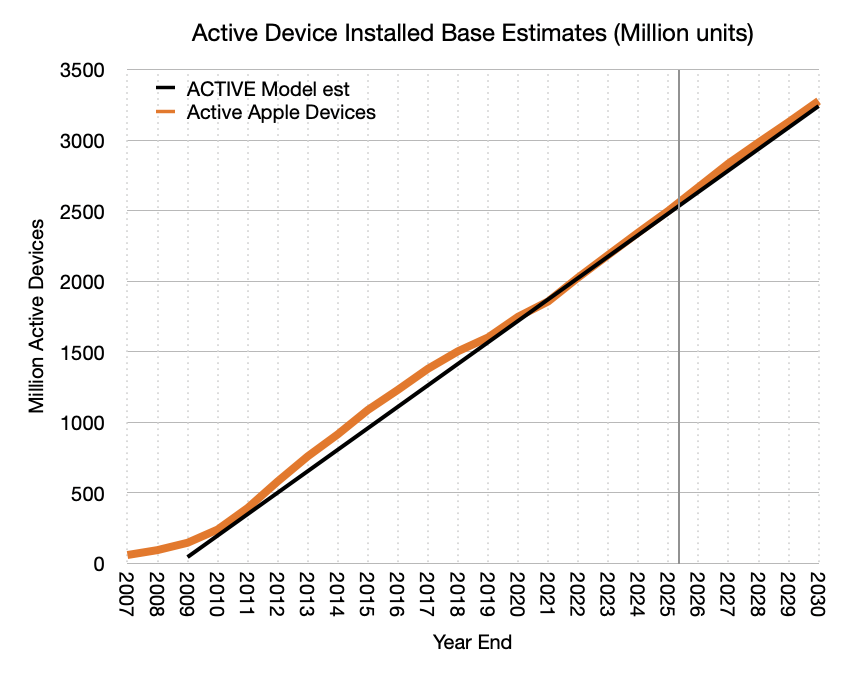
In January this year Apple reported that there were 2.5 billion active Apple devices in use. This figure has been getting updated for years and I've been reporting its trajectory and other measures that are correlated to it. For instance the number of Apple subscriptions, Apple Services revenues and other historical indicators such as iCloud accounts and Apple Music.
Simplifying, I published the "ACTIVE" model which makes some basic projections of this total device count and it's shown below"
One element of the analysis that has eluded me was the more precise composition of this total "devices". In other words, which devices and what is their mix. We have seen numbers for iPhones but not for other types of devices. I should note that this is not easily derived because we have neither the units sold (only revenues) and we don't know how long they stay in use. The measure of active population implies that the products are bought, used and eventually retired.
The only clue we have, beside quarterly revenues--and even there wearables and home are not separated by product--is that management occasionally mentions that "more than half" of buyers of a specific product are "new to the product". It's not much to go on.
But there are other data sets we can tap. StatCounter provides a share of platforms in use by aggregating browser identifying data for a moderately large set of web sites. That may help with share of base but not with how much the total base is. Various other analysts do try to summarize some of the installed base for particular dates.
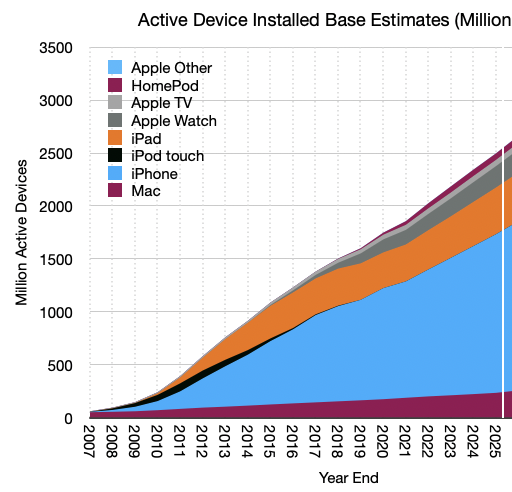
Combining all the available data and some interpolation, I set out to do is to provide a yearly count of the population of Apple devices for each year since 2007. Then to try to forecast this population to 2030. The result is shown below:
The following is a summary for the components for the end of 2025 in millions:
Year-end
Mac
iPhone
iPad
Watch
Apple TV
HomePod
Other
2025
233
1500
442
203
58.5
61.75
0.5
This history looks like this:
What about the future? Let's dig in.
This is a future five years away. Is this growth rate and consistency in mix a reasonable assumption?
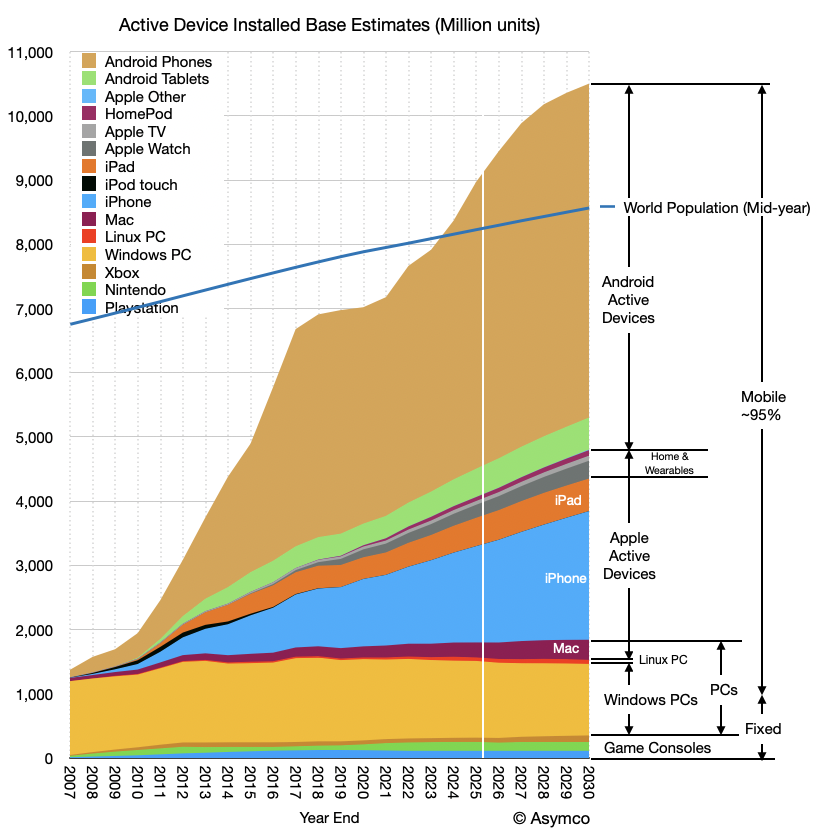
To answer, we should zoom out and look at not just Apple's device base. The following graph shows also Android phones and tablets, Windows, Linux (PC) and Game Consoles.[1] It contrasts mobile and "non-mobile" computing and shows the total global population (blue line).
I have several observations:
The total device population now exceeds the total human population. The total number of phone lines was already higher for some time[2] but what are shown here are "computers" insofar as they have CPUs and operating systems that can run third-party apps.
Given the device count exceeds human count, how much higher can this total go? The forecast shows a slowing of growth within the next five years but this is not a certainty. The attach rate of devices/person could well exceed 1.2 to 1.3 and go to levels seen in wealthy countries (above 2.) If that is the case then the device total may exceed 16 billion at saturation. This has implications for how far current strategies and business models can run.
The composition of device types is fairly constant and form factor substitution is rare. New categories beyond phones and current wearables are hard to anticipate but even if they emerge, the evidence suggests they are additive. Evidently the phone did not so much displace the PC but build on top of it. The potential for wearables and home devices to explode is there but it's hard to image these stealing "share of pocket" any more than phones stole "share of desk or share of backpack". If they do explode, they will add to the total via higher attach rates. 3x human population (24 billion) is possible with new wearables and home[3].
AI holds many promises but how AI is accessed is not necessarily requiring of or benefiting from new device types. The smartphone is still the best AI device imaginable[4]. Ambient or passive computing can be provided by existing wearables but, as the graph shows, these are augmentative to phones. If AI introduces a completely new form factor, the impact will take decades to diffuse. As the graph shows, the mobile era is now approaching 20 years with the next five years foreseeable with some confidence. The next 15 years will be discussed in a future post.
Android typically captures non-consumers who eventually churn into Apple devices. This means that as long as non-consumption exists, Android grows and as long as Android exists Apple grows. If and when Android growth stops then the dynamics will change and Apple might change strategy to accelerate churn.[5]
Google and Apple will be the primary distributors for all software and services into the foreseeable future. Try as they might, challengers face over 9 billion in installed base. Note well how entrenched Windows has been on the desktop even as (free) Linux and (better) macOS alternatives have harvested usage. This rigidity has held over the 1.5 billion addressable market for 30 years now. For additional evidence consider the dynamics, or lack thereof, of the game console business.
It excludes servers and early phone platforms such as Symbian, Blackberry and Linux phones.
According to ITU Facts and Figures 2024, there were 112 mobile-cellular subscriptions per 100 inhabitants globally in 2024
Households are 1/3 human population and vehicles are only about 1/7 so Home and Automotive don't move the needle much.
AI is, if anything, putting the "smart" back in "smartphone".
This might be what is happening with the Mac Neo, decades after the PC market saturated. Perhaps pieces have finally fallen into place but apart from Chromebooks, it's been very difficult to challenge the Windows PC head-on. (Though the iPad was possibly designed to displace some of the PC usage, it hit mainly with non-consuming very young or very old and PC use was unaffected.)
Revenues and growth rates for iPhone, Mac, iPad, Services, Wearables, plus Net Sales, Gross Margin, Operating Expense, Other Income and Expense, Tax Rate, Net Income, Share Count and EPS with a comparison to CFO guidance.
Kevan Parekh, Apple CFO: As we move ahead into March, I would like to review our outlook, […]. We expect our March total company revenue to grow by 13% to 16% year over year, which comprehends our best estimates of constrained iPhone supply during the quarter.
We expect services revenue to grow at a year-over-year rate similar to what we reported in December. We expect gross margin to be between 48-49%. We expect operating expenses to be between $18.4 billion and $18.7 billion, which is at a similar level to what we reported in December and driven by higher R&D on a year-over-year basis. We expect OI&E to be around $100 million, excluding any potential impact from the mark-to-market of minority investments, and our tax rate to be around 17.5%.
I've seen several market reports which estimate that iPhone shipments grew around 3% to 6% in the quarter. When I plug in, say, IDC's iPhones number into my model, and assume quite aggressive growth on the other categories (including Services) I get a y/y revenue growth of 11%. This is far below Kevan's January's guidance quoted above (13% to 16%).
Are IDC, Gartner, et. al. signaling a huge miss?
I need to point out that in the preceding December quarter the iPhone grew revenues at 23%! In order for Apple to hit its targets
I'd also point out that when Kevan Parekh made his forecast, in late January, a full month was already on the books for Apple. Visibility into the next month would have been relatively good as orders from the channel are partly foreseeable. For a change from implying nearly 20% growth in sales/14% in units one third of the way in, to IDC's 3% in units for the whole quarter would imply a collapse in demand into February and March. We're talking double digit decline in order volumes.
Moreover, IDC commentary on Apple is
Apple secured second place, driven by the strong performance of the iPhone 17 series, which saw significant growth in China of over 30%. This led to a 3.3% year-over-year increase in global sales for Q1. Although demand remains robust, supply disruptions and a reduction in channel support in some key markets have hindered growth..
30% growth in China! For this to be tied to 3.3% growth globally would imply significant declines elsewhere. I struggle to see how this adds up.
Here is my complete forecast for the quarter including growth rate for revenues for iPhone, Mac, iPad, Services, Wearables, Net Sales, Gross Margin, Operating Exp., OIE, Tax Rate, Net Income, Share Count and EPS with a comparison to CFO guidance.
Says Neal Stephenson who first coined the term “metaverse”
This revelation came soon after Meta canceled the Metaverse.
My thought was immediately, will Meta rename itself back to Facebook? We'll get to that soon, but first let's look into Neal Stephenson's mea culpa:
When I was working at Magic Leap, and people asked me why I thought that [Metaverse] was a good idea, I would ask the rhetorical question: “do you really think that twenty years from now everyone is still going to be going around all day staring at little rectangles in their hands?” At the time it seemed obvious to me that the answer was no.
Reader, I have changed my mind. Twenty years from now, everyone is still going to be staring at handheld rectangles. Or at least that is the case if the only alternative is wearing things on their faces. Maybe this should have been obvious to me given the amount of time, effort, and money people put into making their faces look as good as possible.
A possible workaround is to keep refining and miniaturizing the devices to the point where they just look like eyeglasses. This, however, turns out to have the unintended side effect of making these things seem sinister. It happened with Google Glass, which instantaneously spawned the term “glasshole,” and it has happened again with Meta’s product that looks like normal, albeit heavy-framed glasses.
When someone around you is staring at a rectangle in their hand, it might be incredibly annoying, but at least you can tell they’re doing it. When someone’s wearing a head-mounted display, on the other hand, you don’t know whether they are looking at you or not.
Likewise, when someone holds up their phone and aims it at you, it’s obvious that you are on camera. That’s not true in the case of glasses or goggles. So it’s creepy.
Timing is everything and 20 years is always kicked around as some "infinite time horizon". It's notoriously difficult to predict when a transition happens and too many times we give up because we were certain how long it would take. That's rather the story of my life.
To remedy this, first, I never thought Magic Leap was interesting. Nor did I bother even skimming stories about Google Glass. I went nowhere near anything made by Facebook/Meta. Did not even try to use any one product, did not read specs, reviews or any other commentary.
I knew the products would not be very good being not much more than demos or experiments. To understand the market, you first need to make a marketable product and these were not good enough.
The goodness here was defined in the absence of creepiness. I've always argued that wearables are easily categorized: just look for places on the body where jewelry is placed and you'll know where wearables will be worn.
Jewelry has been developer for thousands, perhaps hundreds of thousands of years and it is inextricably connected to our psyche. Glasses do pass for jewelry but only if they conform to high standards of style. Functional objects rarely are granted status as ornament. Finding that balance is the key. It happened with watches and maybe ladies' hats.
Stephenson is right in saying that face ornaments are difficult "given the amount of time, effort, and money people put into making their faces look as good as possible."
That does not disqualify face wearables entirely. It simply needs design thinking and that's what was always what I expected from Apple. The Apple Vision Pro was not meant to be used socially. It does not even work outdoors.
It's a productivity product and one aimed at professionals. Apple will release a face wearable only when it conforms to its principles of user-centric design.
That was not the case for Meta because it is not a company concerned with customer satisfaction. Its business model is to sell users to advertisers and was motivated to enter device development only so as to disintermediate the smartphone. Doing so would remove any impediments to harvesting users data. The priority of user affinity and affection was nice to have but it requires a maniacal attention to even have a chance of success at being loved.
Rebranding around a hypothesis like the metaverse was impulsive but Facebook was a dying brand anyway and having diversified well beyond it, deprecating it was no great loss. Slapping on the Meta moniker was a bark up the wrong tree but not much was lost. I doubt there will be another change unless Zuckerberg falls in love with another way to get rid of its distributors.
NB: Apple never chose to use Metaverse branding. What it developed was spatial computing. It approached the problem not as a content but as a platform and user interface. Will we move to spatial computing en masse to the detriment of "rectangles in our pockets". I don't think that the right question. In reflecting on the past of computing, a new platform did not just replace the previous but created new markets altogether.
Each new interface was an order of magnitude more popular than its predecessor. Keyboard, mouse, touch, each added a few zeroes to the number of users. We are now at nearly 1:1 machine to human. I don't think that this is the limit.
We are entering the n:1 machines to human and wearables are the only way we get there. And as I said, where there is jewelry there will be a machine. Spatial interfaces are more natural as far as our perceived reality is concerned. The rest is engineering.
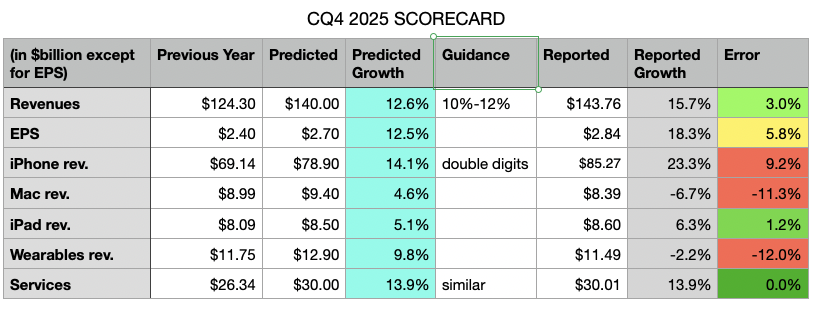
My predicted growth is in the light blue column, the reported growth is in the grey column and my errors are in the last column. Also included is the guidance from the previous quarter's conference call.
The table shows my errors were primarily in underestimating iPhone, while over-estimating Mac and Wearables. The errors mostly cancelled each other out on the top line (off by 3 percentage points) but, due to an underestimation of the gross margin led to a bottom line error of 5.8 percentage points.
The Mac overestimation was based on not paying enough attention to the comparable from the year earlier. I was warned: "On Mac, keep in mind, we expect to face a very difficult compare against the M4 MacBook Pro, Mac Mini and iMac launches in the year ago quarter". Wearables are similarly underperforming due to lack of new product launches.
But the iPhone underestimation is simply because the new products are a massive hit. Nobody predicted this level of performance. Indeed Apple was caught by surprise and has been unable to meet demand. They are still going to be below supply/demand balance going well into the first quarter of 2026.
Finally, an error on the margin came from Apple's continuing over-performance on supply chain management.
Apple is providing the following guidance [my emphasis]:
We expect our March total company revenue to grow by 13% to 16% year over year, which comprehends our best estimates of constrained iPhone supply during the quarter.
We expect services revenue to grow at a year-over-year rate similar to what we reported in December. We expect gross margin to be between 48-49%. We expect operating expenses to be between $18.4 billion and $18.7 billion, which is at a similar level to what we reported in December and driven by higher R&D on a year-over-year basis. We expect OI&E to be around $100 million, excluding any potential impact from the mark-to-market of minority investments, and our tax rate to be around 17.5%.
Based on provided guidance, I'm making the following predictions for the next quarter:
It's vey important to note that Apple is guiding gross margin to be between 48-49%, a record high and something that we will discuss in the next post. This results in a 22% to 23% EPS growth rate!
Note also that Apple guided revenue growth between 10% and 12% and delivered 12.6%. They guided grass margins between 47% and 48% and delivered 48.2%. It's highly probable that their top-of-the-range guidance will also be exceeded slightly and that my current estimates are therefore modest. [NB: the guidance is being put forward at the end of the first month of the quarter therefore the company already has booked one third of the quarter and has very clear visibility into the next third.]
As we approach the earnings release for the first fiscal/fourth calendar quarter for Apple, it's time to look back three months at what the company delivered and guided in the previous quarter.
The summary for results for fourth (fiscal) quarter of FY2025:
Revenue up 8% year-over-year, a new September quarter record.
EPS was up 13% year-over-year.
Product revenue was up 5% year-over-year driven by growth across iPhone and Mac.
iPhone revenue was up 6% year-over-year, and set a September quarter record despite supply constraints faced on several iPhone 16 and iPhone 17 models.
The iPhone active installed base grew to a new all-time high and had a quarterly record for upgraders. Also, Apple reached a new all-time high for installed base of active devices.
Mac revenue was up 13% year-over-year, driven by MacBook Air. Apple grew in every geographic segment, with strong double-digit growth in emerging markets. Mac installed base reached another all-time high, with nearly half of customers who purchased a Mac being new-to the product.
iPad was down 3% revenue and but over half of the customers who purchased iPad this quarter were new-to the product. iPad also had a September quarter record for upgraders.
Wearables, Home & Accessories Revenue for the category was flat y/y. Apple saw a September quarter record for upgraders to Apple Watch, and over half of Apple Watch buyers were new-to the product.Both the Apple Watch and AirPods installed bases reached new all-time highs.
Services again set a new all-time revenue record up 15% year-over-year. Apple saw double-digit growth in both developed and emerging markets. Apple saw a sequential acceleration across the majority of the categories and set new all-time records across Advertising, App Store, Cloud Services, Music, Payment Services, and Video. Apple saw a double digit growth in Apple Pay.
Guidance was provided as follows:
We expect iPhone revenue to grow double digits year-over-year, which would be our best iPhone quarter ever. On Mac, keep in mind, we expect to face a very difficult compare against the M4 MacBook Pro, Mac Mini and iMac launches in the year ago quarter. We expect Services revenue to grow at a year-over-year rate similar to what we reported in the fiscal year 2025.
We expect gross margin to be between 47% and 48%, which includes an estimated impact of $1.4 billion of tariff-related costs. And so for the December quarter, we expect operating expenses to be between $18.1 billion and $18.5 billion. We expect OI&E to be around $150 million, excluding any potential impact from the mark to market of minority investments and our tax rate to be around 17%.
Based on these forecasts my estimates for the top, bottom and middle lines are as follows:
Revenues: $140 Billion (+12%)
EPS: $2.70 (+12.5%)
iPhone: $78.9 Billion (+12%)
Mac: $9.4 Billion (+4%)
iPad: $8.5 Billion (+5%)
Wearables: $12.9 Billion (+10%)
Services: $30 Billion (+14%)
If there is an error in the above I would guess it's in iPhone being too low and the iPad/Mac and Wearables being too high. Nevertheless, I think this will be Apple's biggest quarter ever with significant growth acceleration on the top and bottom lines. [Notable will also be a rapid acceleration in R&D spending (+25%) as suggested by guidance.]
As we head into this blockbuster quarter, Apple shares are trading at a P/E ratio of 32 to 33, a significant drop from above 35 during previous few quarters. During the last three months, the share price has declined about 15% as Mr. Market looked at the money mountain above and decided he wanted none of it.
In the latest, (Fiscal Q3, Calendar Q2 2025) conference call, Tim Cook made a welcome announcement: "We also recently marked a significant milestone. We shipped the 3 billionth iPhone since its launch in 2007."
This was welcome because the company has not been providing iPhone unit shipment numbers since Q4 2018. What it has meant is that the number of iPhones sold and their average selling price had to be estimated. Active iPhones were occasionally provided but quite rarely.
With this update, the veil has been party lifted. I, as well as you I'm sure, rushed to assess how well we have been estimating the iPhone economy over the last seven years. Prior to Tim's data dump, my own estimate for total iPhone shipments was 3.104 billion, including the last quarter. [Keep in mind that the 3 billionth iPhone may have shipped in the beginning of the quarter which amounts to more than 50 million units prior to announcement so my error of 104 million is minus perhaps 50 million.]
In the worst case, my error amounts to about 3.4% over the entire lifespan and perhaps 5% over the estimate period. That is perhaps not criminal since, after all, what's 100 million iPhones between friends?
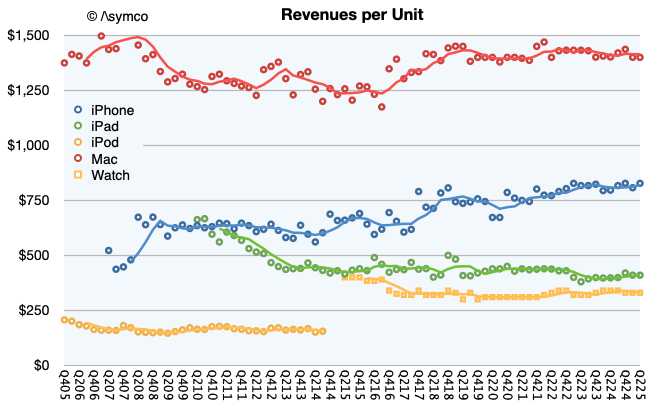
I adjusted the estimated average selling price to reflect this error and shaved essentially one quarter's worth of shipments from the data set. In other words, my estimate would have been that 3 billion was reached in March rather than June. Mea culpa.
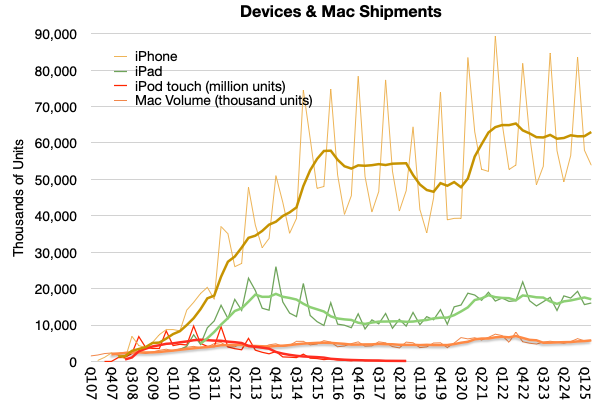
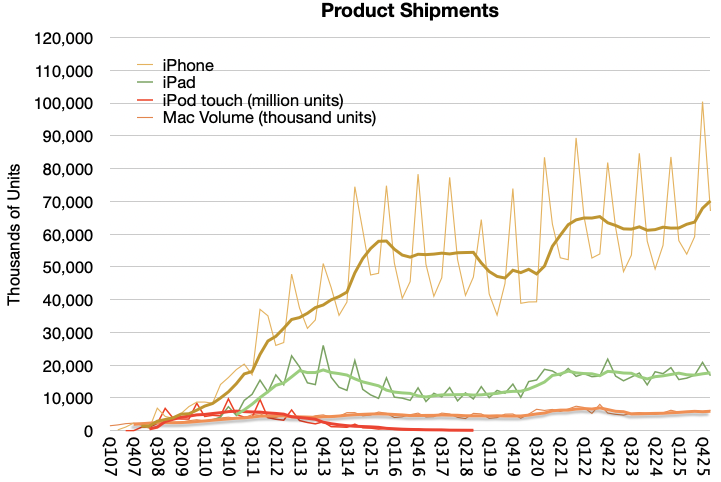
The new view into the entire iPhone shipment history is shown below. Also below is the impact of adjustment in the revenue per unit (i.e. average selling price.)
Note that I used trend lines to show the four-period (12 months) running average to remove the seasonality. Perhaps there is something to be read in the pattern. I would say that there are some notable surges as during the initial uptake, during the first "supercycle" in 2014, the surge during Covid and perhaps the "China recession" of 2018.
Clearly we are not at the highest sales levels today, as the Covid surge will take some time to grow into but at the same time the volumes are not decreasing. You can see the contrast to the iPod touch when an alternative was available, namely the iPad. The demise of the iPhone has been greatly exaggerated.
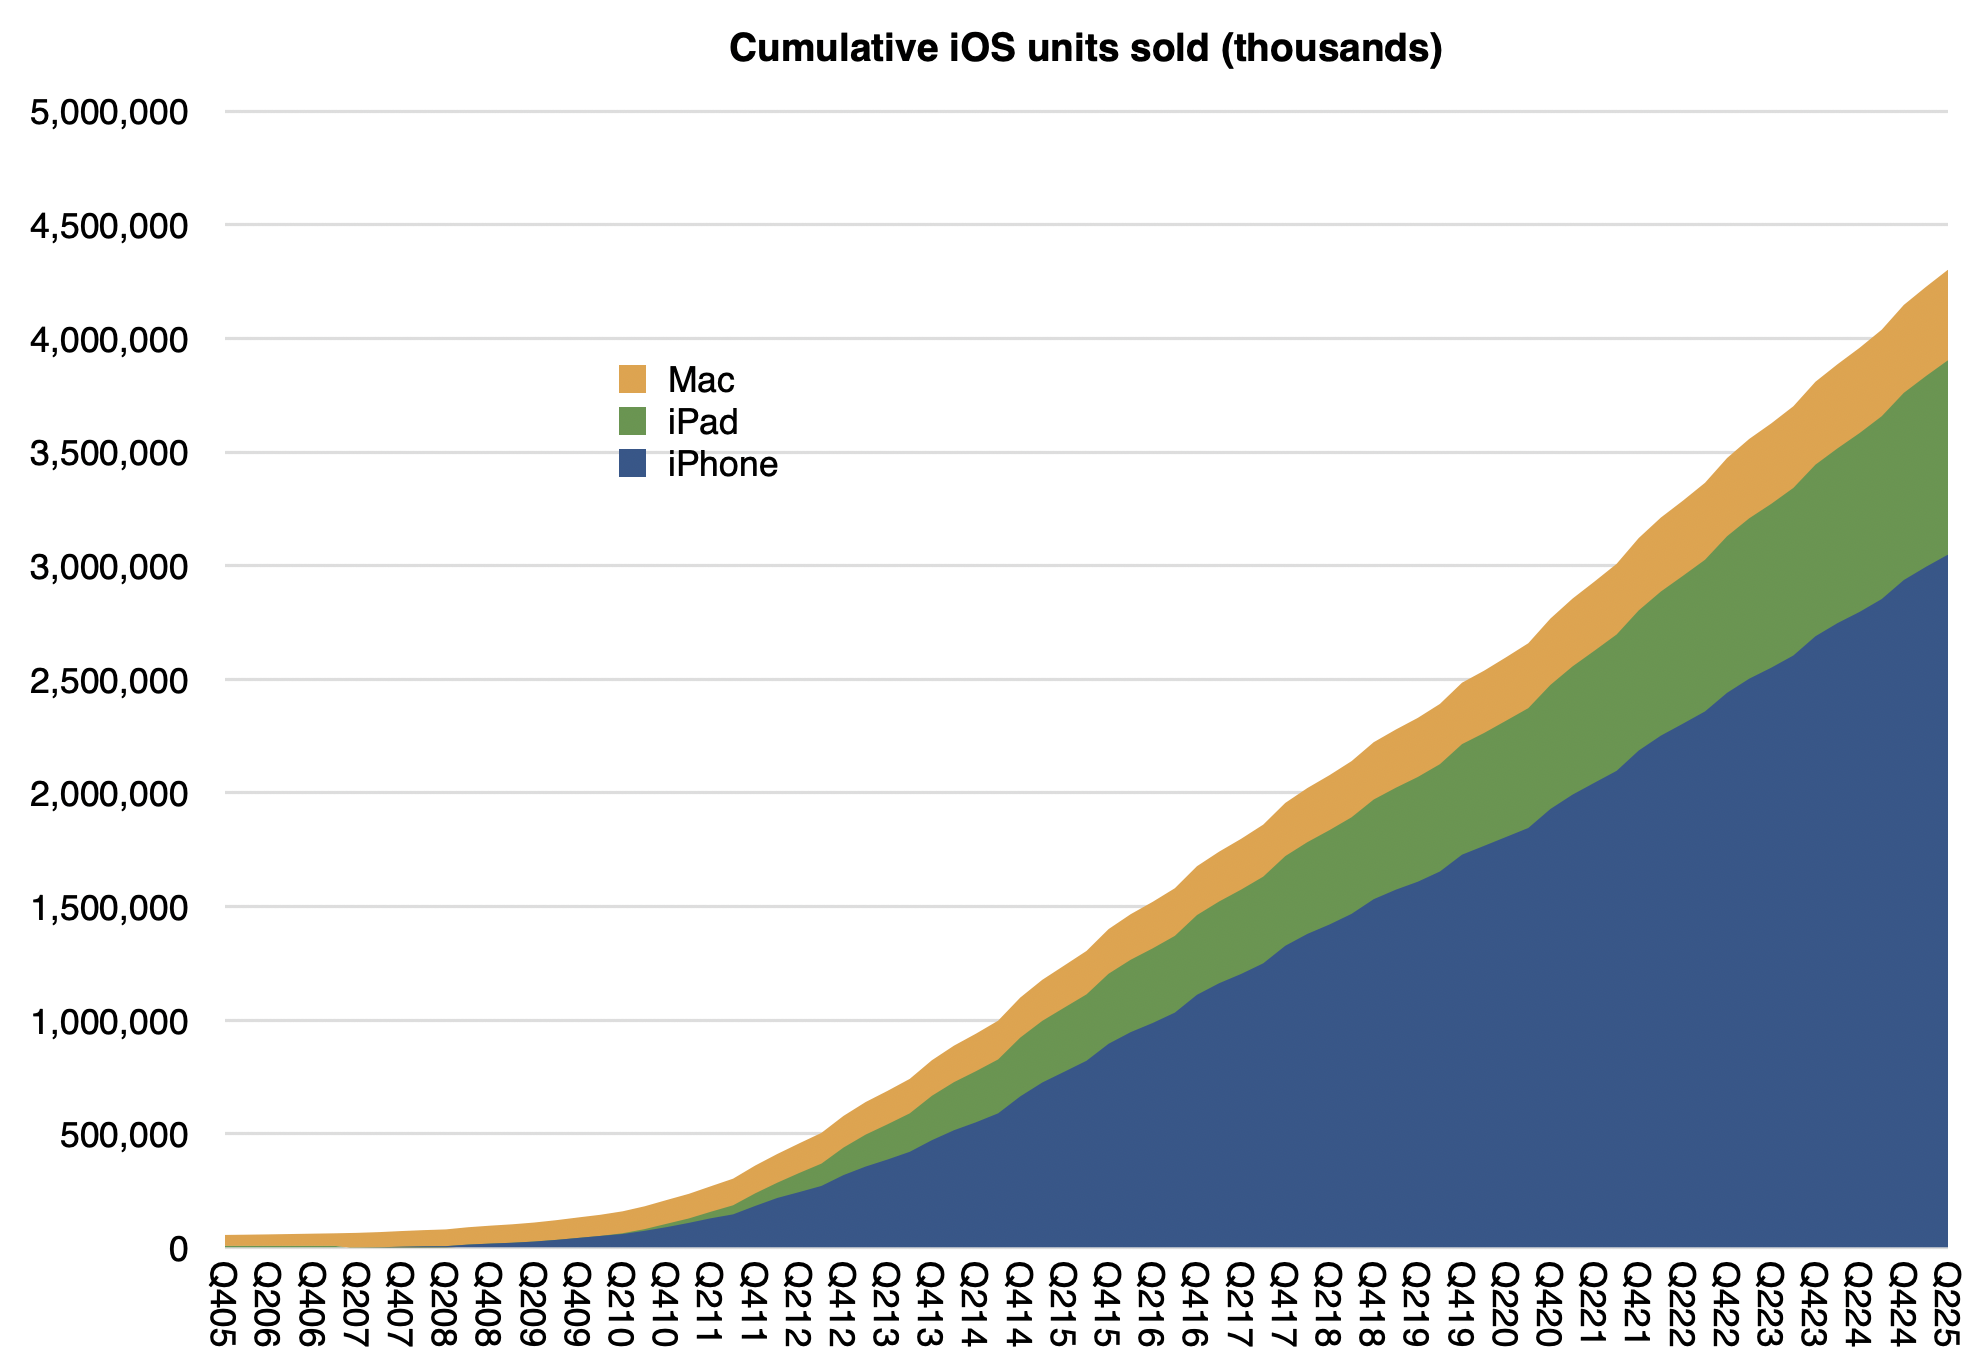
Note also that I also included the iPad, Mac and the iPod touch for comparison. You can try your hand at reading the patterns there. For the record, my cumulative Mac estimate (since Q4 2005) is 398 million[1] and the cumulative iPad is 855 million. Here are the iPhone, iPad and Mac cumulatively with a current total of about 4.3 billion:
Not shown are iPods (touch alone is about 114 million), Watches (probably at least 250 million) and Vision Pro (single digit millions) or wearables and home. If we did include those, it's a safe bet that Apple has shipped over 5 billion devices.
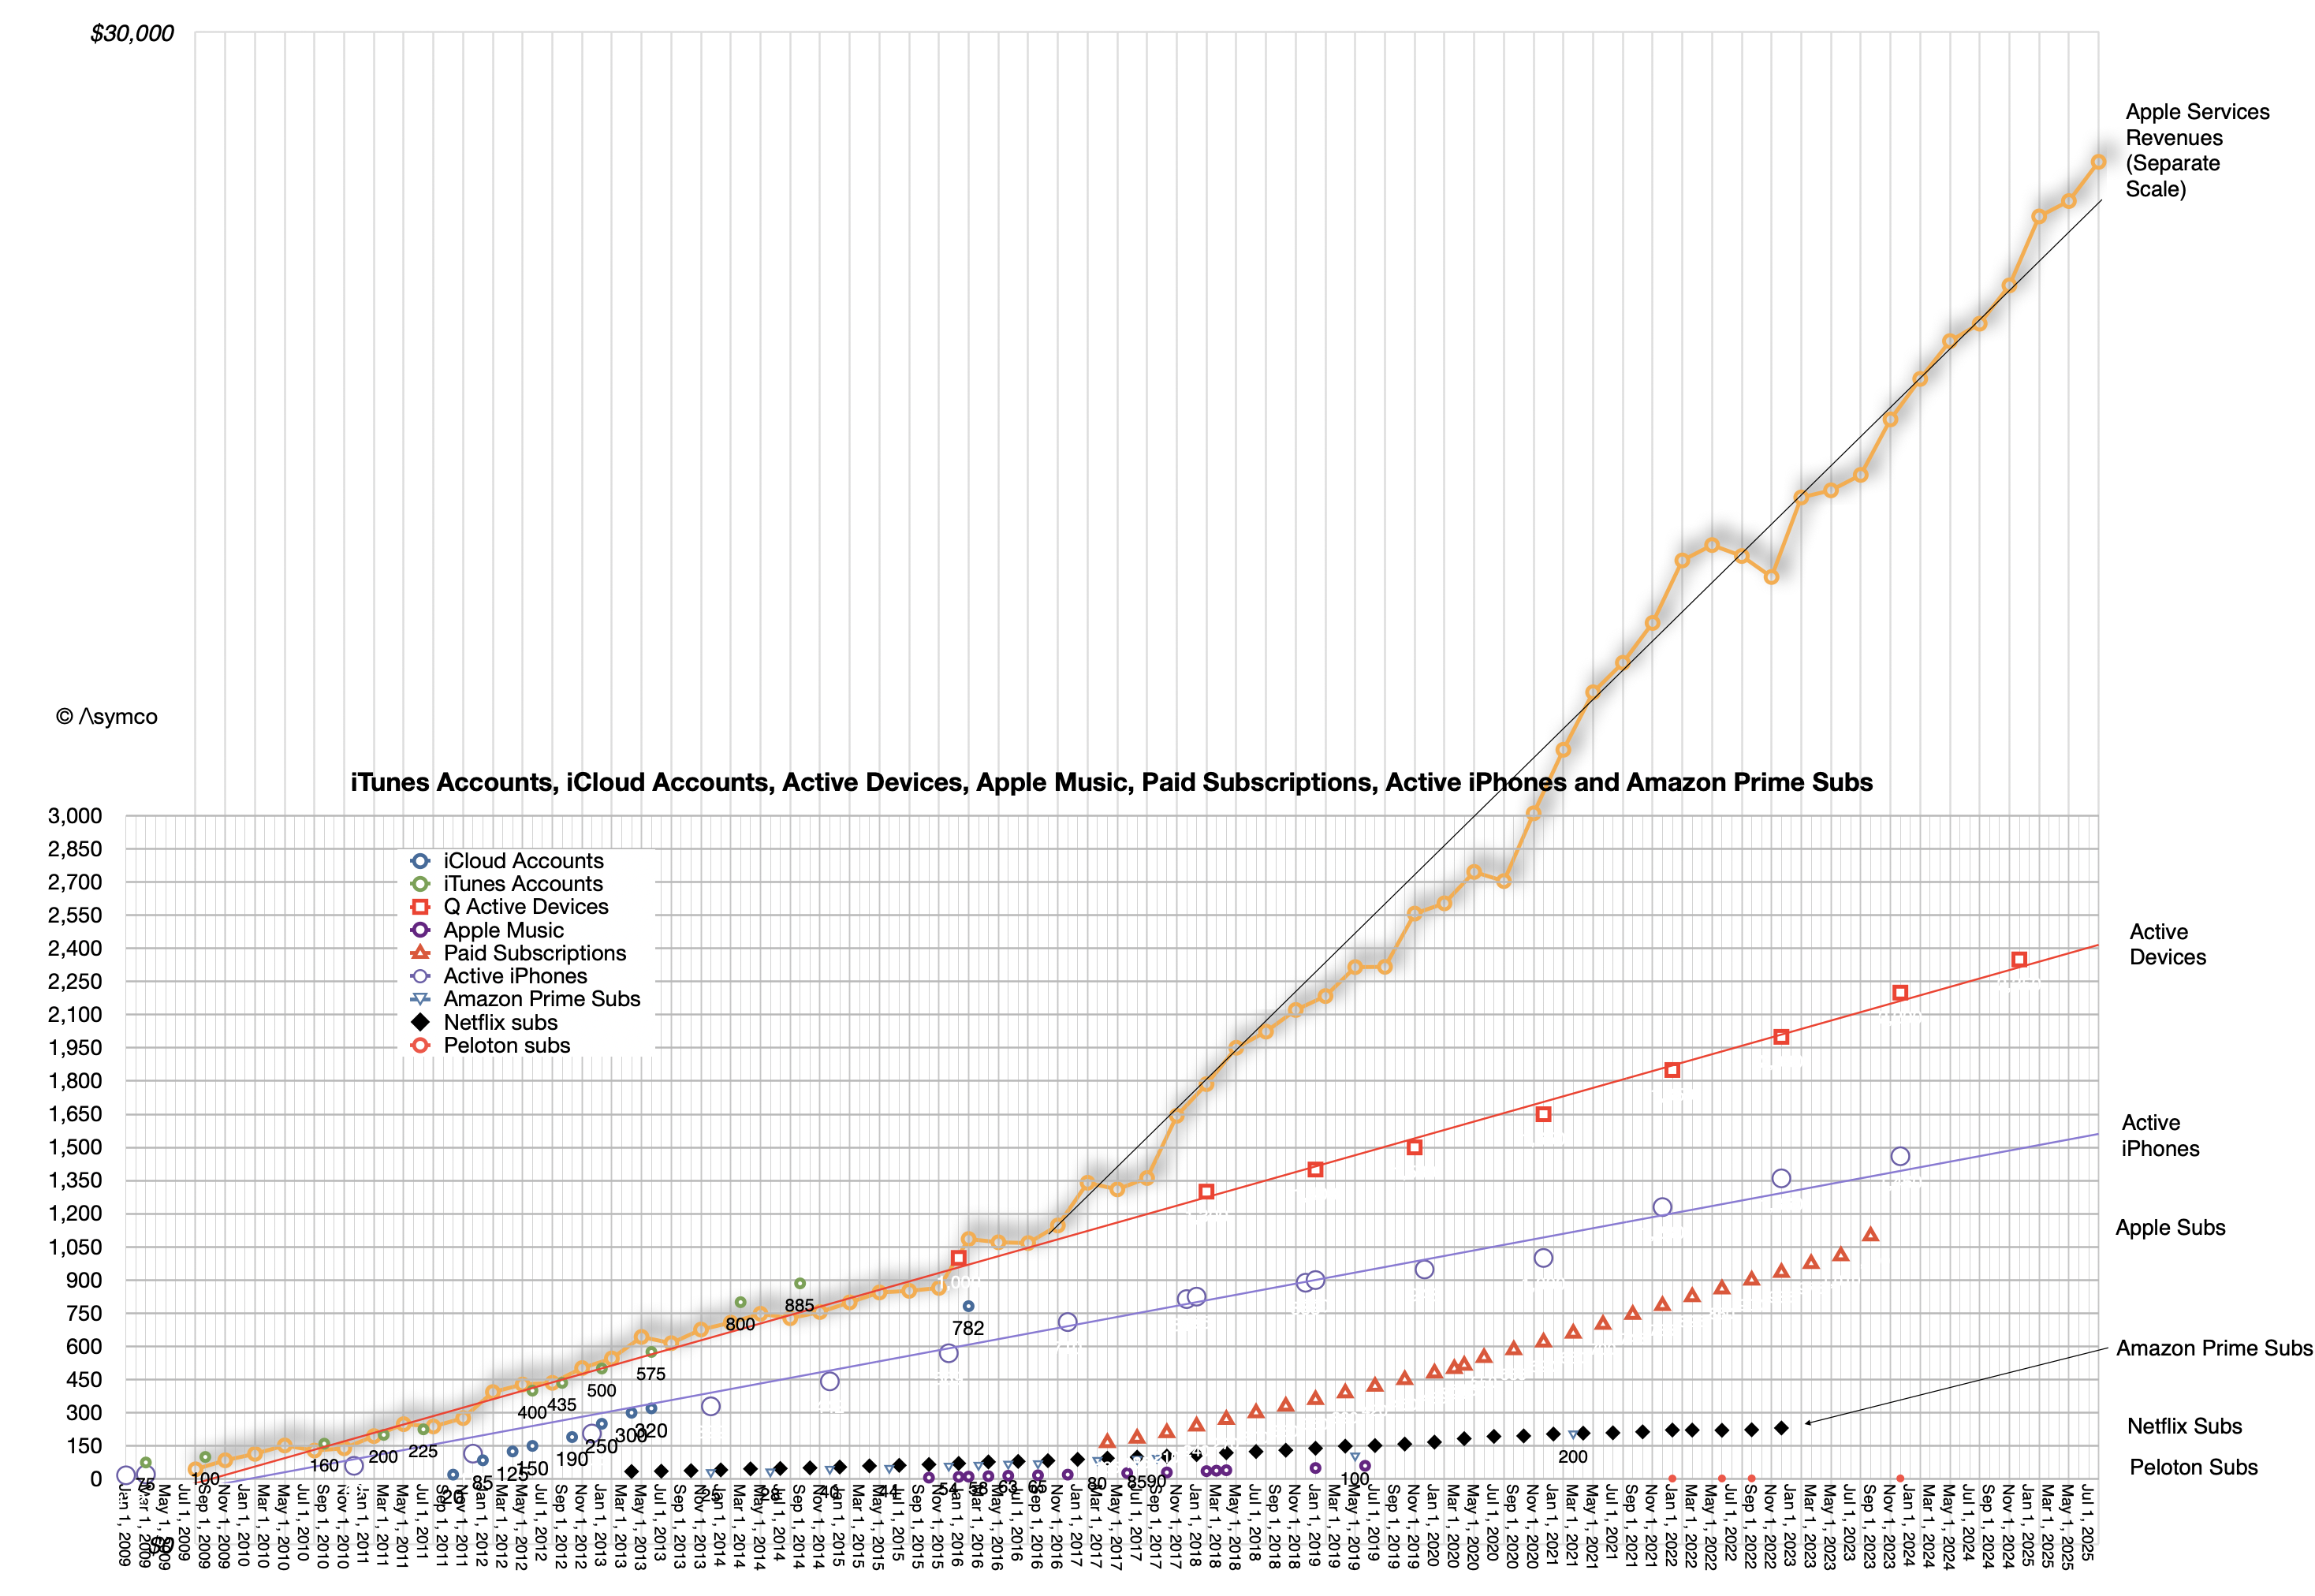
Interesting, but not as interesting as how many are active (in use at least once a month.) For that estimate we have another set of data:
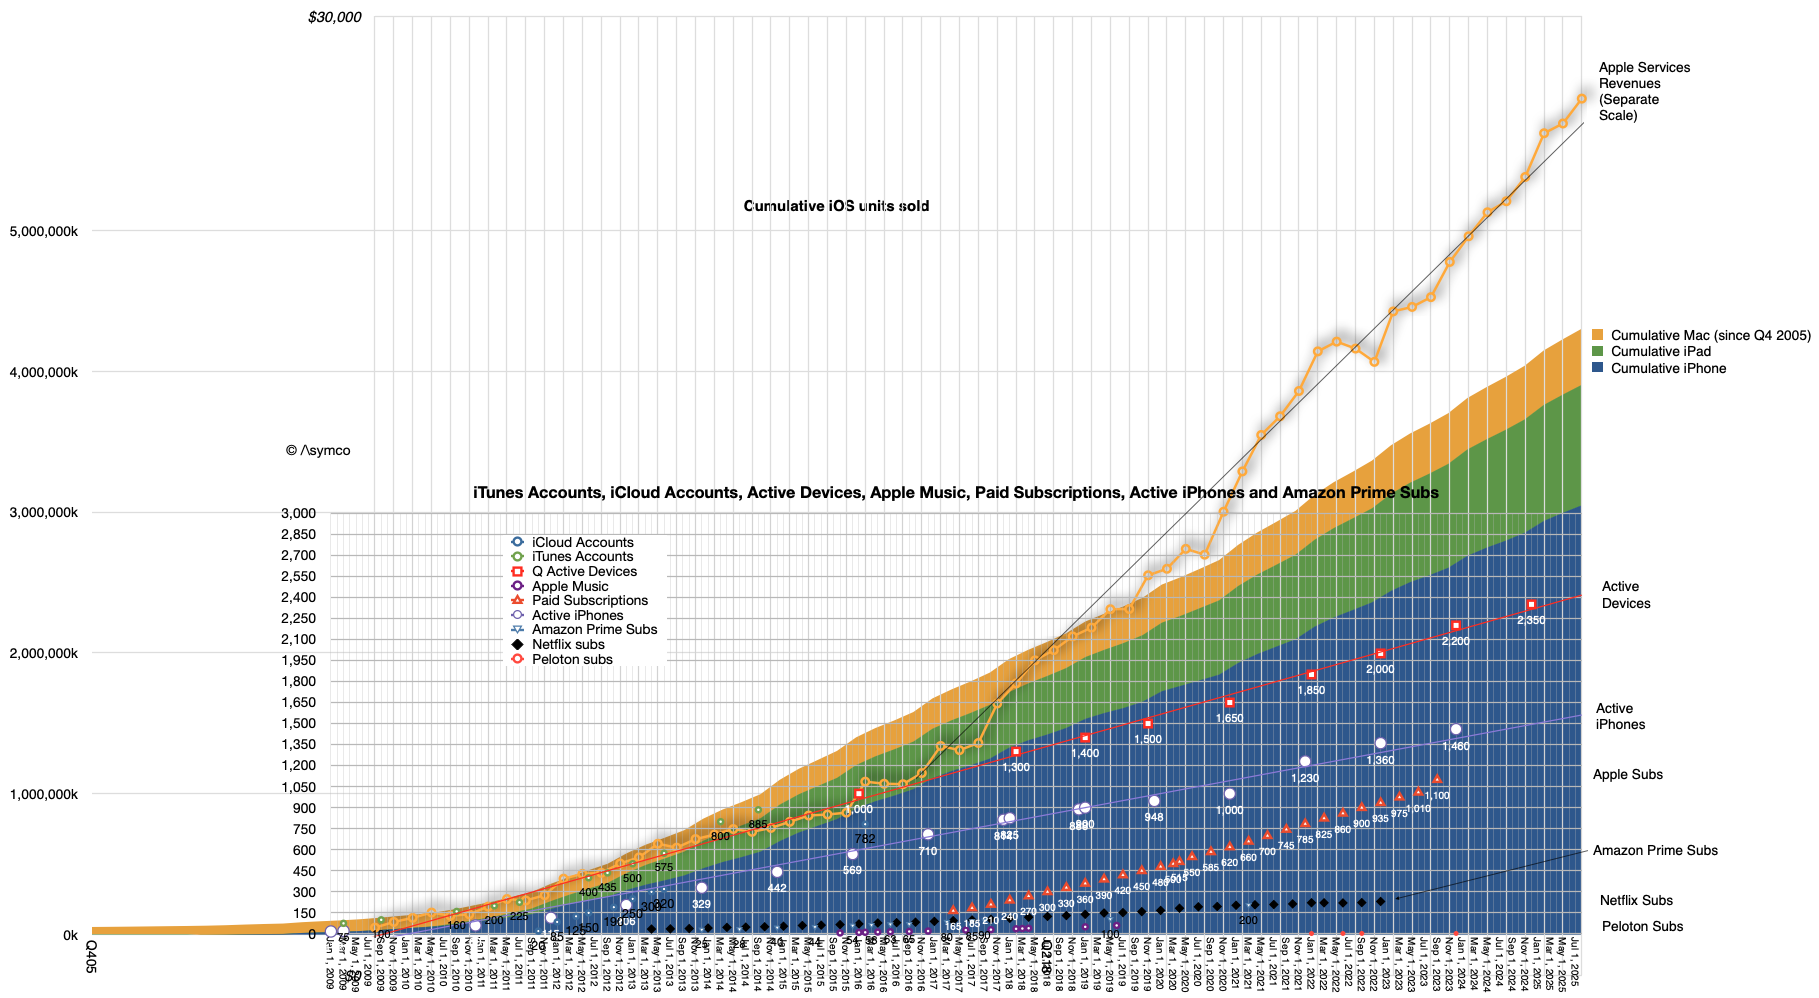
The linear extrapolations for active devices, active iPhone and, on a separate scale, actual Apple Services revenues can be seen. Also subscriptions, as long as they were available, plus other data sets for comparison such as Amazon Prime subscriptions, Netfilx and old Apple Music and iCloud account data.
At the risk of overloading an already busy graph, it might be interesting to show cumulative devices vs. active devices:
The top of the area graph seems to be not too different than the top of the red dotted device line. What might be instructive is to calculate the ratio between these two: the active devices and the cumulative devices during the period from 2016 (when 1 billion active were reported) and the beginning of this year when the last figure was reported (2.35 billion active devices on Jan. 30 2025).
Again, excluding wearables, iPod touch, Apple TV and Apple Vision Pro we have these ratios:
Date
Ratio of Active devices to Cumulative iPhone, iPad and Mac sold
Q417
0.66
Q418
0.63
Q419
0.60
Q420
0.60
Q421
0.59
Q422
0.58
Q423
0.58
Q424
0.57
What this suggests therefore is yet another way to forecast the value of Apple as an enterprise. We already know that the prediction of active devices, revenue per device and margin is sufficient to forecast the company's earnings. These all seem to be quite linear and thus predictable. Now we can add the relationship to devices sold as yet another way to calibrate or test assumptions.
After diligently doing so, simply multiplying the results by a random number called the P/E ratio (aka "sentiment") allows you to predict the share price at any point in the future.
Have fun.
It would be interesting to consider that if, as it's been often claimed by Apple, half of Mac users and half of iPad users are new to the products, then there would be 200 million new Mac users and perhaps 400 million iPad users.