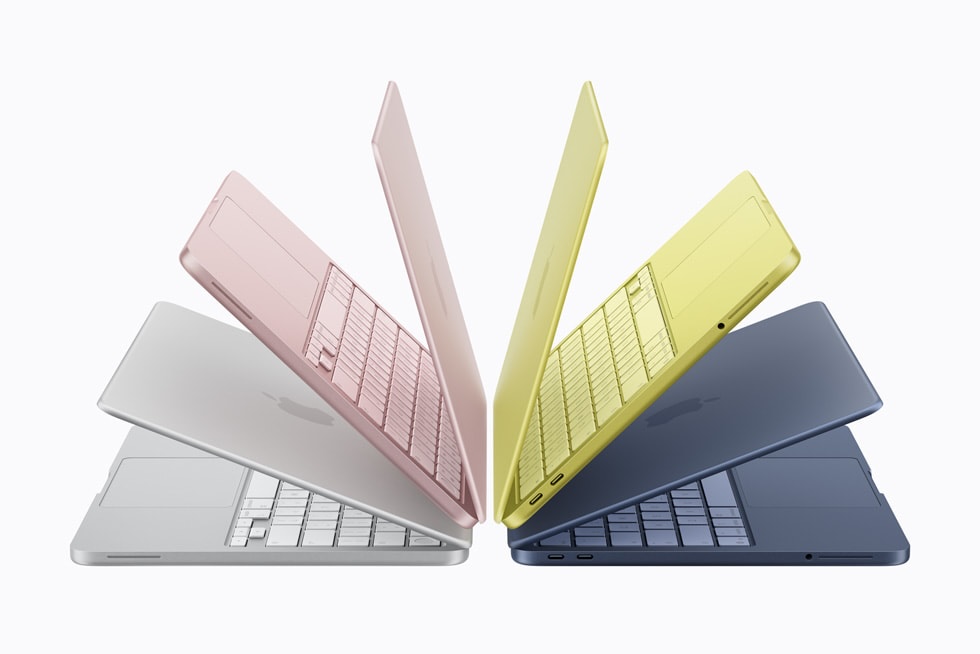
If it wasn't for the MacBook Neo the fall would have been much worse.
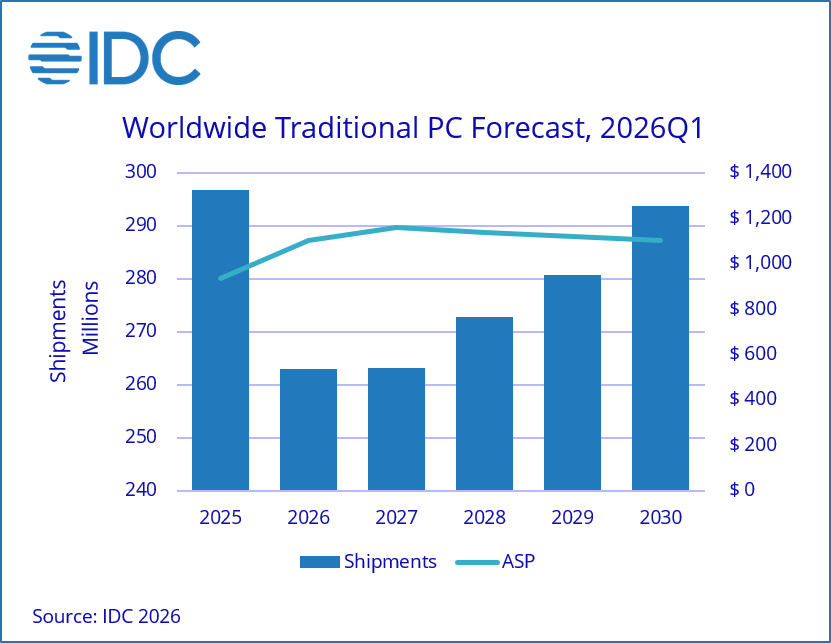
IDC now forecasts global PC shipments will decline 11.3% for the full year, with conditions worsening progressively through Q4, when shipments are expected to fall 20% year-over-year.
Pull-forward demand masked the problem, temporarily
The first quarter of 2026 offered a deceptively encouraging signal, with shipments growing 3% versus the same period last year. But that strength was largely borrowed from the future. Buyers, both consumer and commercial, accelerated purchases ahead of anticipated price hikes and product availability constraints.
Pull-forward demand masked the problem, temporarily
“The anticipation of rising prices and of limited availability of some system configurations due to memory and other component shortages has led some end-users to make purchases earlier than anticipated,” said Jean Philippe Bouchard, Vice President of Devices and Consumers at IDC. “We’re not seeing any relief to the memory shortage situation before the end of 2027, which means prices will continue to rise and PC manufacturers will struggle to maintain full product portfolios for the foreseeable future.”
One notable wildcard is Apple’s MacBook Neo, which has driven stronger-than-expected notebook demand and prompted IDC to revise its notebook forecast upward.
NB: The problem is a memory shortage: PC manufacturers are struggling to maintain product portfolios.
“The introduction of the MacBook Neo is putting real pressure on the entire PC ecosystem,” said Jitesh Ubrani, research manager for IDC’s Consumer Devices Trackers. “We expect vendors to respond with a combination of new silicon, a more efficient OS from Microsoft, and aggressive promotional pricing.”
“The competitive pressure from the Neo is providing a partial offset to broader price increases, keeping some low-cost notebook options alive. But the overall trajectory for average selling prices (ASPs) is firmly upward. IDC forecasts ASP growth of 17% in 2026, and even as memory capacity expands over the next two years, pricing is unlikely to return to 2025 levels,” Ubrani added.
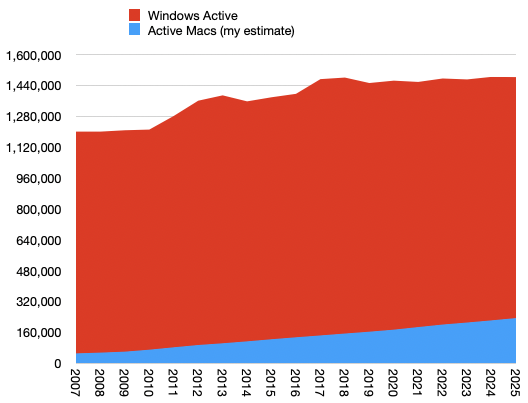
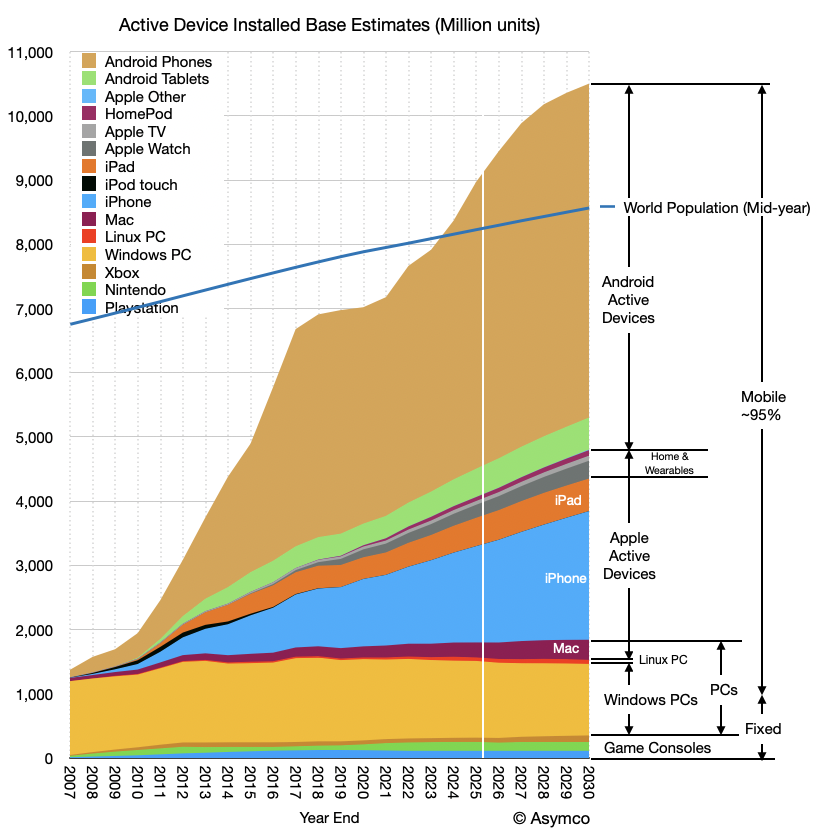
As the graph shows, IDC forecasts no recovery in volumes until after 2030. This is a multi-year opportunity for Apple and may reset market share dynamics permanently.
AI-driven memory shortage continues to hammer sales; Android sales to drop 20%
According to analysis firm IDC, smartphone shipments are headed for a 13.9% decline in 2026, a downward revision from the 12.9% decline IDC had anticipated for the year in February. It would also mark the steepest drop in smartphone history, the company said.
“these pressures are compelling vendors to reduce shipments, raise prices and concentrate on higher price tiers — elevating smartphone [average selling price] to a record $550, up $100 from last year,” IDC senior research director Nabila Popal said in a statement.
“2026 will be a defining year for the industry as [a] new reality of structurally higher costs take hold,” she added. “For consumers, it means the era of ultra-cheap smartphones is over. For vendors, it means only those that can adapt their strategies to this new cost environment and sustain demand at elevated price points will survive.
The broader Android smartphone market is set to take the biggest hit, with IDC projecting a 20% year-over-year drop in shipments. Despite that, Samsung is expected to increase its market share in the space at the expense of smaller smartphone companies thanks to its midrange and premium device lineups.
Apple, the research firm said, is also expected to perform relatively well, with shipments forecast to fall 5.2% on the year, an improvement from a previously anticipated decline of 8.1%.
In its most recent earnings report, Apple announced iPhone revenue growth of 20% for the second consecutive quarter, thanks to its strong iPhone 17 lineup and improved sales out of China.
But CEO Tim Cook also warned of supply constraints due to both the memory shortage and the dearth of iPhone processors.
NB: I would add that Apple also announced that revenues for June quarter would increase at the same rate as they did for March quarter, thus for at least half the year the company will achieve 20% growth in iPhone sales. This is in sharp contrast to both what IDC and Omdia have been reporting.
Market contraction expected for second half of year.
Omdia reports that Europe (ex. Russia) smartphone market grew 2% to 33 million units in 1Q26.
Key vendor highlights from 1Q26 include
Samsung was Europe’s largest vendor as it grew 3% to 12.6 million units. Effective discounting of the Galaxy A16 4G helped Samsung boost volume, offsetting declines related to the delayed launch of the Galaxy S26, A57 and A37.
Apple grew 9% to 8.8 million iPhones, driven by robust iPhone 17 series demand in addition to benefiting from a wider mid-range coverage from the iPhone 15 and iPhone 16e. Noticeably, Apple’s strong results came despite lower and fewer discounts than in previous years.
Xiaomi retained third place despite declining 15% to 4.5 million units, as it was more immediately impacted by supply-side difficulties. However, Xiaomi’s ASP grew 21% compared with 1Q25, boosted by a record-strong Xiaomi 17 and 15T series performance, which drove year-on-year value growth despite the shipment decline. Premium sales were particularly strong in France, Germany, and Spain.
Motorola grew 17% to 1.9 million units, driven by rapid expansion in Spain and Portugal, alongside continued progress in France and Italy.
OPPO grew 9% to 1.3 million units, largely driven by its comeback in France alongside growth in Romania and Poland. With both realme and OnePlus now under its umbrella, OPPO is restructuring to optimize its portfolio and strategy with ambitions to strengthen its European position.
HONOR, ranking sixth, was the fastest-growing vendor among the largest players, with shipments increasing more than 60% compared to 1Q25. HONOR’s growth is underpinned by its portfolio being expanded further down the price-tiers.
"The average-selling-price (ASP) of smartphones in Europe surged to a record-high level of €580 in 1Q26," added Bjorhovde. "This was largely caused by lower availability of devices costing less than €200, which made up an all-time low of just 25% of shipments. Additionally, the high-end remained resilient thanks to Apple’s growth. The focus from both vendors and channel partners has shifted from volume to value to deliver results and operational sustainability. Many vendors who normally focus on the mass market segments are increasingly concentrating on the mid-to-high-end, hoping to benefit from less price-sensitive and upgrade-willing buyers."
[My emphasis]
"The first quarter of 2026 delivered beyond expectations, but the outlook remains bearish as the rapidly escalating memory bottleneck worsens," commented Bjorhovde. "Omdia forecasts shipments into Europe to decline 12% in 2026, but the majority of this will come in the second half of the year.
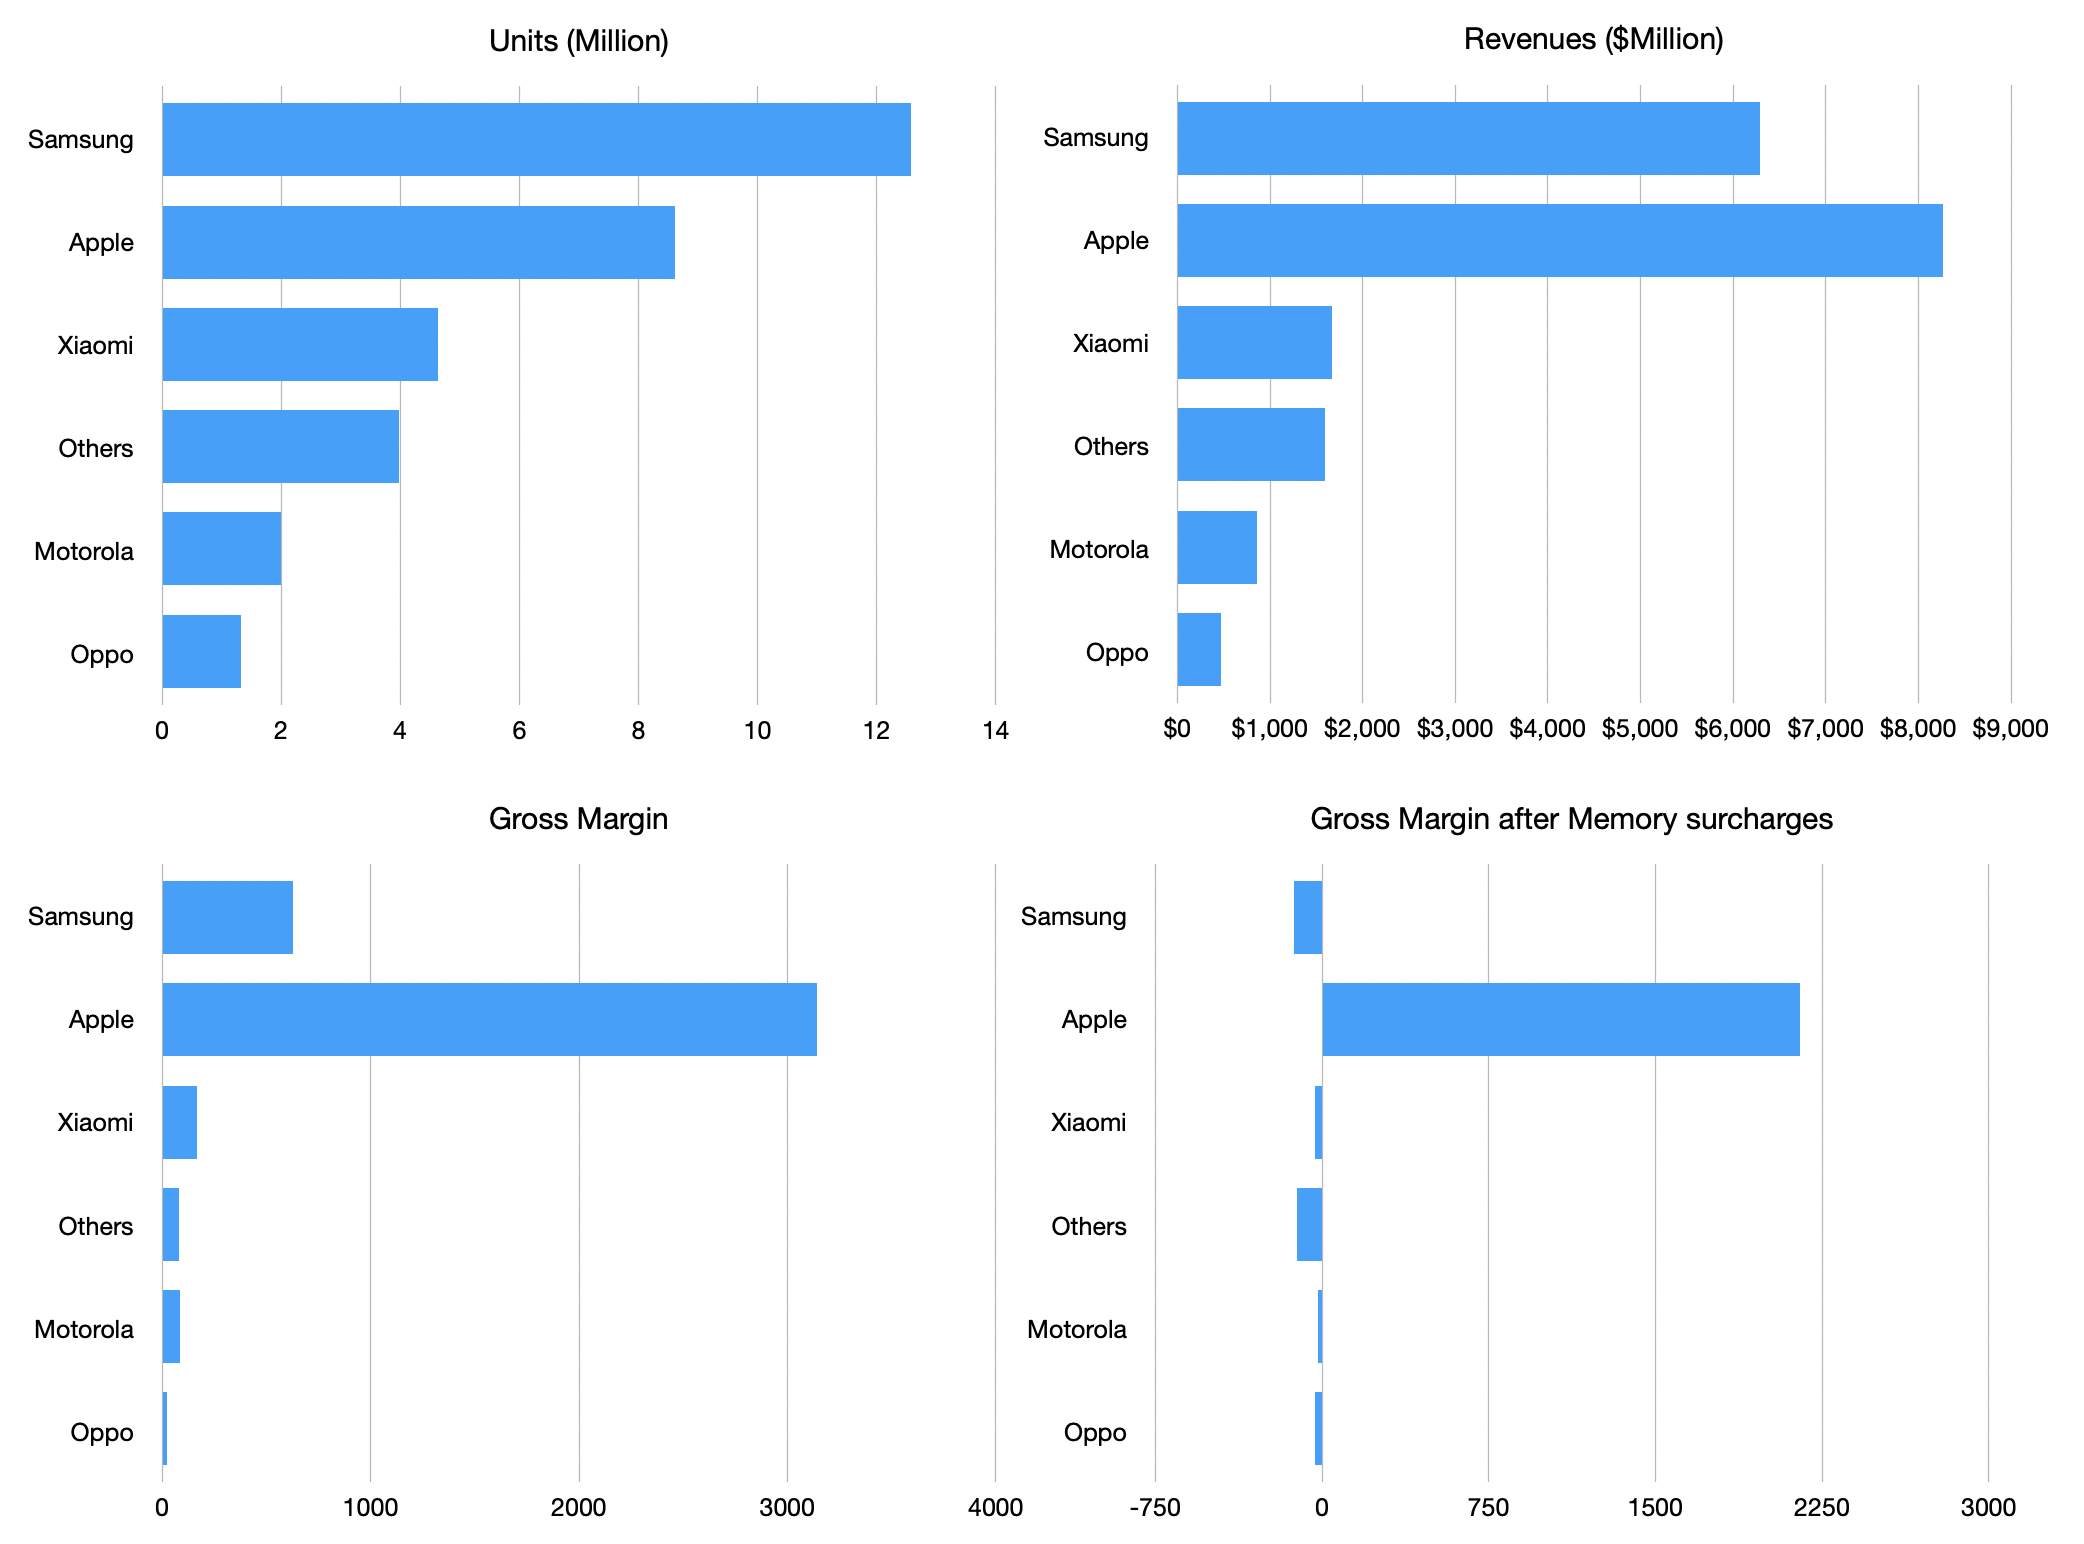
Applying average pricing per vendor and average gross margins gives the following picture of the market:
Apple currently captures 26% of unit volume, 43% of ...
Asymco Bulletin is a digest of all the work we have published for the week ending May 3, 2026.
Editor's Note: Starting next week, we will be sending Asymco Bulletin to Asymco One subscribers only. You will still receive Updates when new posts are published per your notification settings.
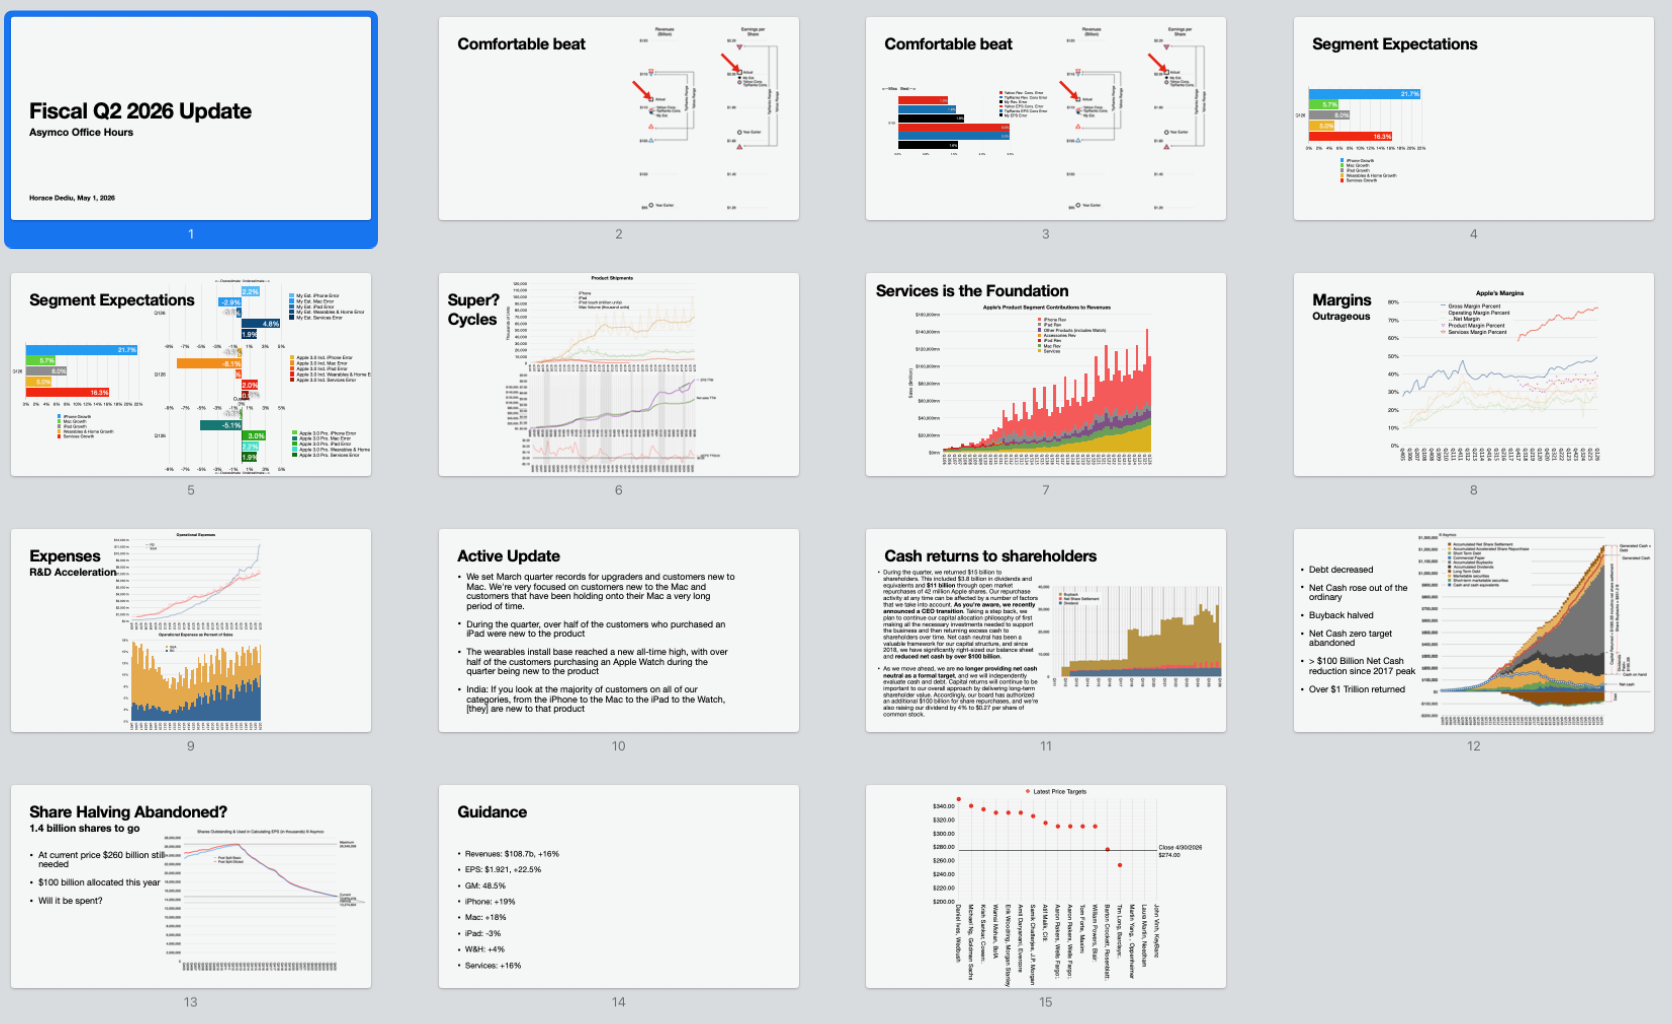
In Asymco One's May 1, 2026 Office Hours session, review of Apple's Q2 2026 earnings, segment growth: iPhone at 22%, Services at 16%, iPad at 8%, Mac at 5.7%, and wearables at 5%. Steady, foundational growth of Services, Gross margins reached nearly 50%, R&D spending surged, a shift in Apple's capital return strategy showing perhaps the hand of John Ternus. Guidance suggests 16% revenue growth, 22% EPS growth. Analyst sentiment turned positive post-earnings, with most price targets rising above $310. Apple's evolving identity as an engineering-centric company was the focus of many questions. →
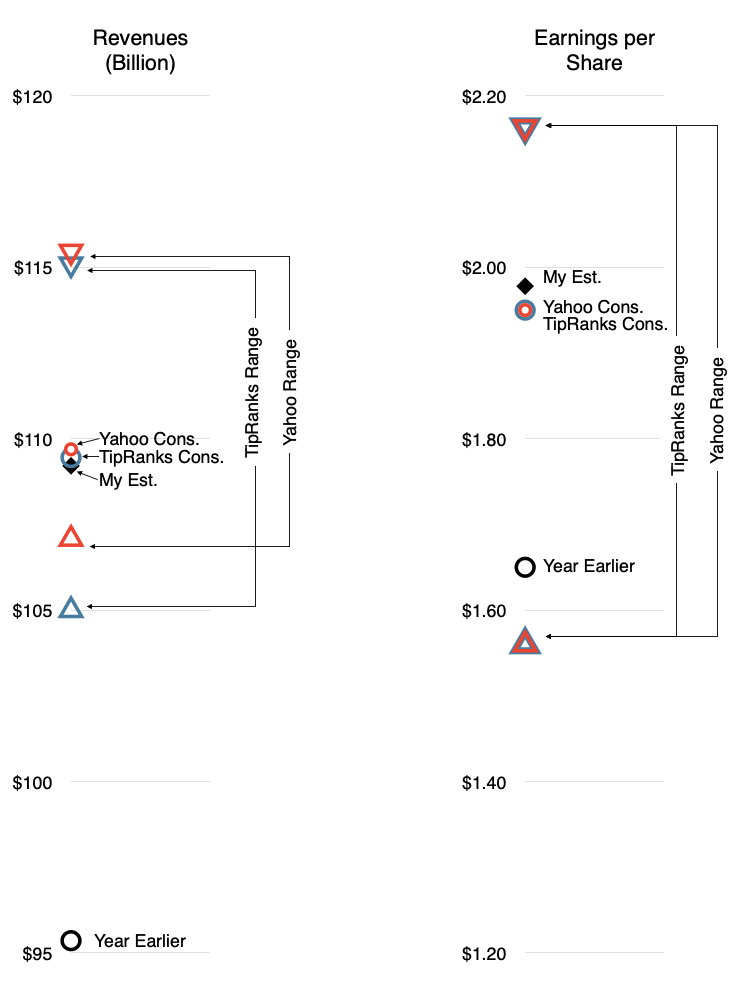
Revenue and EPS consensus, year-ago results and my expectations Yahoo Finance Yahoo Finance’s revenue estimate for Apple in Q2 stems from 31 analysts. As of April 25, the average estimate is $109.69 billion, with a low of $107.08 billion and a high of $115.37 billion. For the earnings per share estimate, 32 analysts put it at an average of $1.95. The low is $1.56 and the high is $2.16. TipRanks TipRanks also does its own analyst polling on Apple’s quarter. In its forecast as of April 19, its consensus is for a revenue of $109.45 billion, with a high of →
TD Cowen: 15% revenue growth, 10% growth guidance → Apple is projected to gain market share in both smartphones and PCs, driven by strong iPhone 17 demand and the new MacBook Neo, with anticipated revenue growth of over 15% in Q3 and positive sentiment ahead of earnings.
Morgan Stanley forecasts fiscal second-quarter EPS of $1.74→ Despite memory pricing pressures, Apple's strong iPhone sales, potential AI and foldable iPhone announcements, solid free cash flow, and favorable market conditions position it for better-than-expected earnings and a possible stock rise to $300 by September.
Is Apple borrowing Samsung’s Market Expansion Strategy?→ Bernstein SocGen maintains optimism on Apple's strategic pricing and ecosystem strength, forecasting EPS growth and potential market share gains, while Samsung faces smartphone profit challenges but thrives in memory.
Separately, it’s been reported that Samsung might see its first operation loss from its phone division, resulting in Apple capturing 100% (or more) of global smartphone profits. Simultaneously, Samsung is seeing huge profit gains from memory, even overtaking Nvidia’s profitability. This is remarkable…
Apple share of the smartphone SoC market grew from 15% to 19% in Q1 → In Q1 2026, global smartphone SoC shipments fell 8%, but Apple thrived in the premium market by leveraging its efficient supply chain and passing costs to consumers, boosting its market share from 15% to 19%.
Google to sell TPU chips as Gemini shows returns → Why pour cash into Nvidia when you can craft your own cutting-edge chips like Google, and then turn that innovation into a lucrative side hustle by selling them to tech giants like Meta and Anthropic?
The Vision Products Group Expanding → Gurman's 2025 dissolution claim clashes with 2026's active Vision Products Group hiring spree. The Vision Products Group posted 14 new senior roles last week.
A part of Horace's interview with Asahi Shimbun on the 50th Anniversary of Apple's founding. The portion here discusses management succession and occurred on April 1. Apple announced the succession of Tim Cook as CEO to John Ternus last week. This analysis of Apple leadership decisions focuses on culture and attributes of the firm rather than attributes of the persons leading it. It may prove a more reliable predictor in future leadership changes.
…, the speculation is John Ternus is the next in line. I think that's a very plausible hypothesis. And one reason, by the way, is I always maintain if you study the company from a cultural point of view, you'll realize that there are people who cannot be CEO. You may not know who it's going to be, but I can tell you who won't be. Many people over the years suggested candidates, and I would say no, never. And here are examples. Johnny Ive would never be CEO. An external hire would never be CEO. Even a head of marketing would never be CEO. Many people think that Apple is a brilliant marketing company. No, it's an engineering company. It's a huge secret out there. →
Writing the story of John Ternus' tenure as Apple CEO from April 21, 2040. What changed and what didn't.
It’s been 15 years but John Ternus has finally stepped down as Apple CEO. Analysts described the transition as expected rather than disruptive, noting that investors had long anticipated Ternus’ eventual departure. Nevertheless, he leaves with many questions still unanswered about Apple’s long term strategy. Apple incoming CEO faces a defining challenge: Fixing the company’s Services dependence. It’s been a tumultuous tenure for Ternus but he is leaving with significant accomplishments: John grew Apple devices to 4.5 billion from 2.5 billion when he took over in 2026. Many have pointed out that he has been building on… →
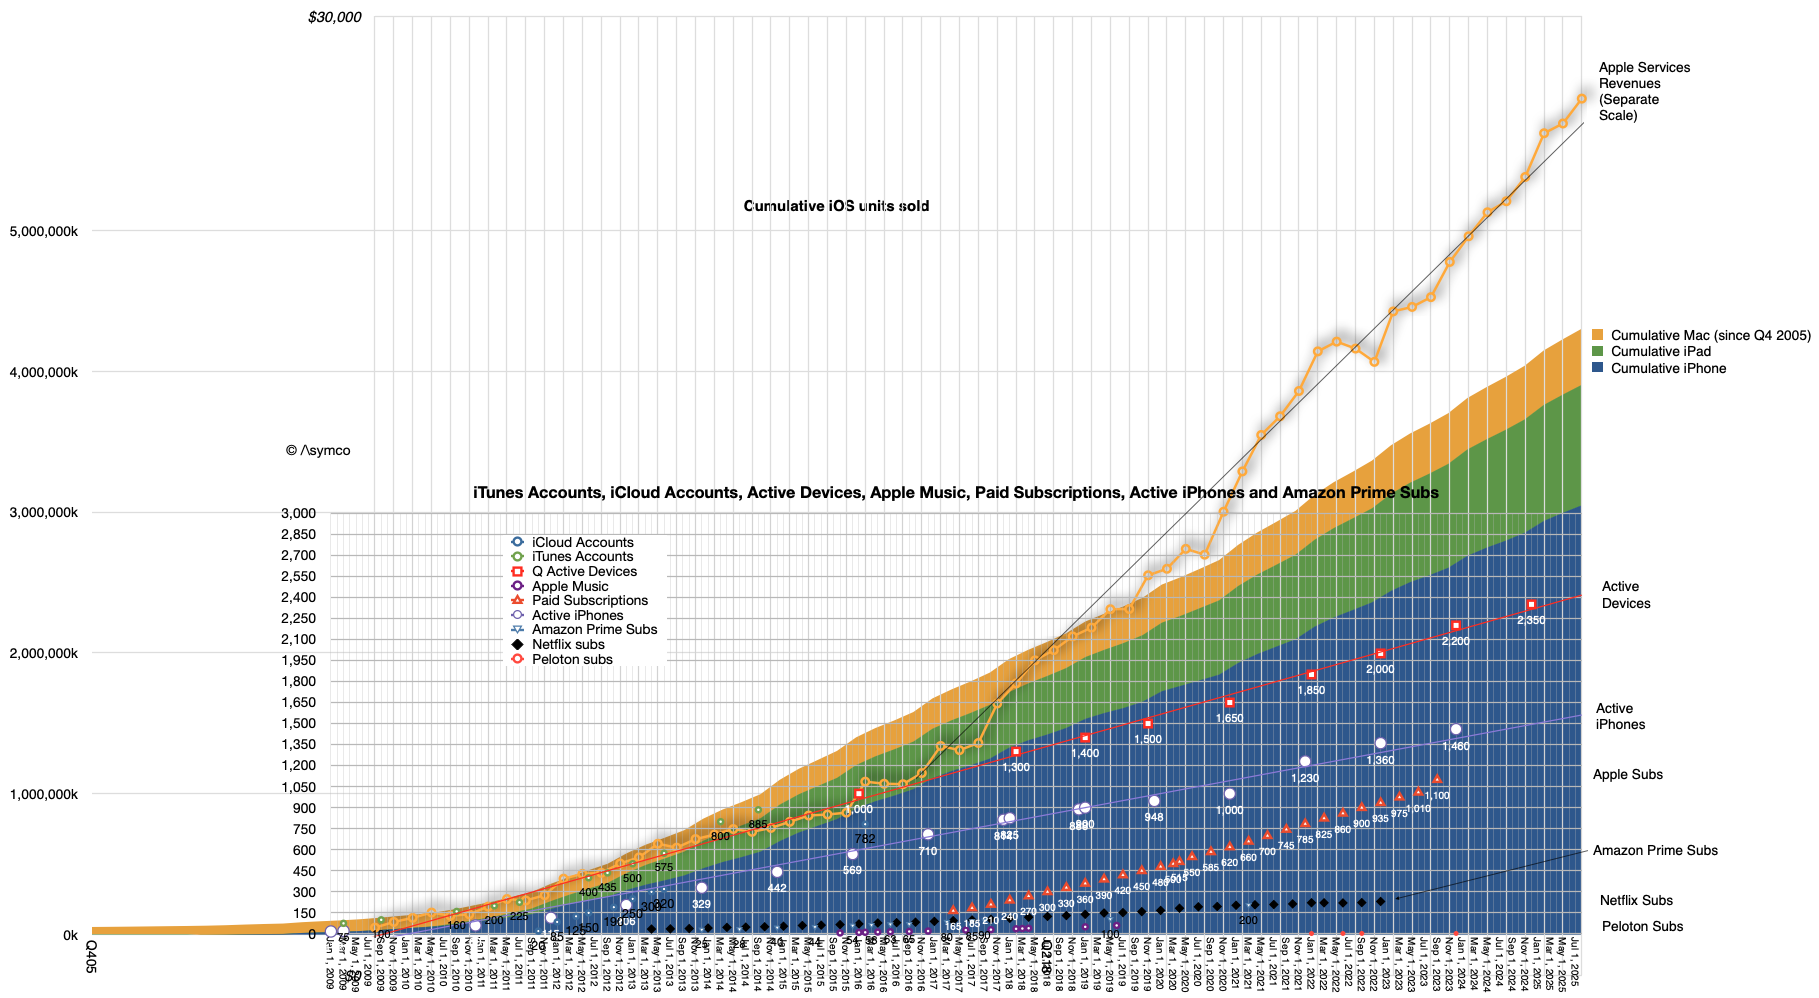
In January this year Apple reported that there were 2.5 billion active Apple devices in use. This figure has been getting updated for years and I’ve been reporting its trajectory and other measures that are correlated to it. For instance the number of Apple subscriptions, Apple Services revenues and other historical indicators such as iCloud accounts and Apple Music.
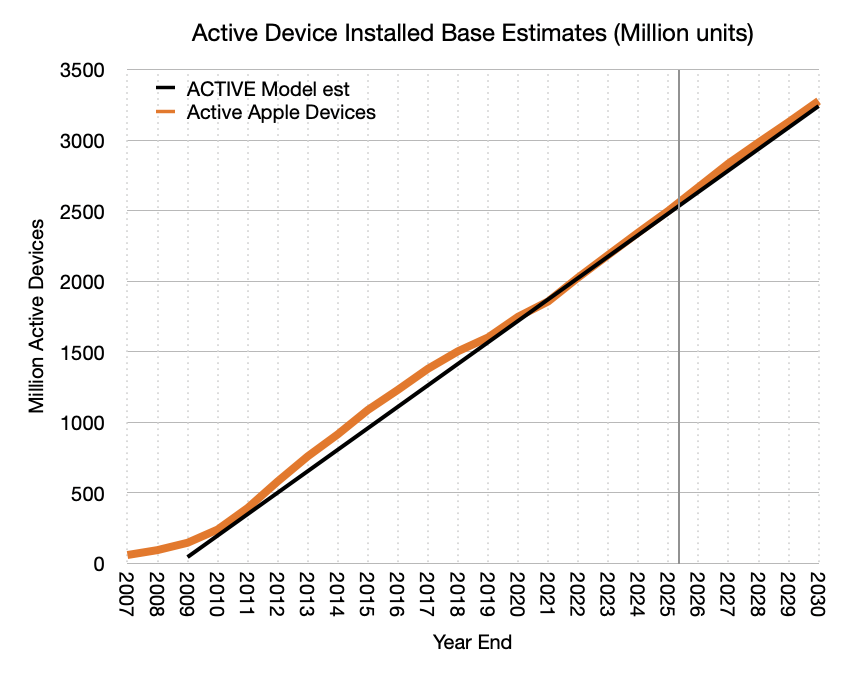
Simplifying, I published the “ACTIVE” model which makes some basic projections of this total device count and it’s shown below” One element of the analysis that has eluded me was the more precise composition of this total “devices”. →
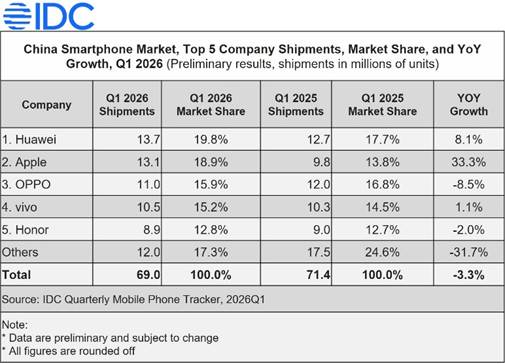
Both researchers say Apple share in China is about 19%, nearly tied with Huawei at 20%…
Some analysts are increasing their targets finally realizing that the memory supply crisis might be beneficial to Apple. This should have been noted already three months ago when Apple provided extraordinary guidance for the March quarter. →
MacBook Neo Sold Out Through April → Despite high demand and stockouts, Apple's strong brand and competitive pricing could turn challenges into opportunities for market expansion.
Microsoft’s cheapest laptop is three times more ex…
As I will argue in a further post perhaps this is one of those pivotal moments. →
Goldman forecasts fiscal second-quarter EPS of $2.00 → Goldman Sachs remains bullish on Apple, forecasting $2.00 EPS driven by strong iPhone and Services growth, dismissing overly pessimistic sentiment as the company consistently gains 100 million new customers annually.
My target of $1.98 seems amiss.…
What is always happening, the reaction that is always ongoing, is the creation of 100 million new customers every year. Accelerating this process is not a matter of just new products or change in sentiment with AI. Much of this rate is due to overall global economic and demographic change. →
What’s the consensus on $AAPL? → Apple's strong analyst backing with a 15:1 Buy:Sell ratio and $315 target contrasts its 39% year-to-date rise, overlooking potential future growth.
The consensus is positive though share price target does not consider significant share gains and service growth acceleration into 2027.
NB: The consensus is positive though share price target does not consider significant share gains and service growth acceleration into 2027. →
Apple 3.0: JP Morgan expects that Apple will beat its own guidance next week → Analyst Samik Chatterjee projects Apple's EPS to rise to $2.05 from $1.96, driven by strong iPhone and Mac demand, with a revenue boost to $112.7 billion, while I estimate a slightly lower 20.2% EPS growth, anticipating guidance will be met.
Read the original for a more detailed commentary from Chatterjee. He implies Apple will grow EPS 24%…
…My own estimate is about 20.2%. I look forward to a lively quarterly update. The primary source of growth must be the iPhone and I have that growing at 19% revenue growth. Last quarter the growth was 23%. Perhaps Chatterjee is assuming a similar growth rate into March quarter. That is not impossible but I am assuming guidance will be met rather than exceeded. →
In January this year Apple reported that there were 2.5 billion active Apple devices in use. This figure has been getting updated for years and I've been reporting its trajectory and other measures that are correlated to it. For instance the number of Apple subscriptions, Apple Services revenues and other historical indicators such as iCloud accounts and Apple Music.
Simplifying, I published the "ACTIVE" model which makes some basic projections of this total device count and it's shown below"
One element of the analysis that has eluded me was the more precise composition of this total "devices". In other words, which devices and what is their mix. We have seen numbers for iPhones but not for other types of devices. I should note that this is not easily derived because we have neither the units sold (only revenues) and we don't know how long they stay in use. The measure of active population implies that the products are bought, used and eventually retired.
The only clue we have, beside quarterly revenues--and even there wearables and home are not separated by product--is that management occasionally mentions that "more than half" of buyers of a specific product are "new to the product". It's not much to go on.
But there are other data sets we can tap. StatCounter provides a share of platforms in use by aggregating browser identifying data for a moderately large set of web sites. That may help with share of base but not with how much the total base is. Various other analysts do try to summarize some of the installed base for particular dates.
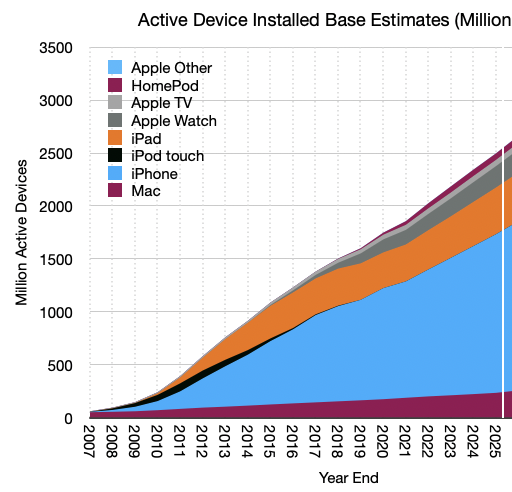
Combining all the available data and some interpolation, I set out to do is to provide a yearly count of the population of Apple devices for each year since 2007. Then to try to forecast this population to 2030. The result is shown below:
The following is a summary for the components for the end of 2025 in millions:
Year-end
Mac
iPhone
iPad
Watch
Apple TV
HomePod
Other
2025
233
1500
442
203
58.5
61.75
0.5
This history looks like this:
What about the future? Let's dig in.
This is a future five years away. Is this growth rate and consistency in mix a reasonable assumption?
To answer, we should zoom out and look at not just Apple's device base. The following graph shows also Android phones and tablets, Windows, Linux (PC) and Game Consoles.[1] It contrasts mobile and "non-mobile" computing and shows the total global population (blue line).
I have several observations:
The total device population now exceeds the total human population. The total number of phone lines was already higher for some time[2] but what are shown here are "computers" insofar as they have CPUs and operating systems that can run third-party apps.
Given the device count exceeds human count, how much higher can this total go? The forecast shows a slowing of growth within the next five years but this is not a certainty. The attach rate of devices/person could well exceed 1.2 to 1.3 and go to levels seen in wealthy countries (above 2.) If that is the case then the device total may exceed 16 billion at saturation. This has implications for how far current strategies and business models can run.
The composition of device types is fairly constant and form factor substitution is rare. New categories beyond phones and current wearables are hard to anticipate but even if they emerge, the evidence suggests they are additive. Evidently the phone did not so much displace the PC but build on top of it. The potential for wearables and home devices to explode is there but it's hard to image these stealing "share of pocket" any more than phones stole "share of desk or share of backpack". If they do explode, they will add to the total via higher attach rates. 3x human population (24 billion) is possible with new wearables and home[3].
AI holds many promises but how AI is accessed is not necessarily requiring of or benefiting from new device types. The smartphone is still the best AI device imaginable[4]. Ambient or passive computing can be provided by existing wearables but, as the graph shows, these are augmentative to phones. If AI introduces a completely new form factor, the impact will take decades to diffuse. As the graph shows, the mobile era is now approaching 20 years with the next five years foreseeable with some confidence. The next 15 years will be discussed in a future post.
Android typically captures non-consumers who eventually churn into Apple devices. This means that as long as non-consumption exists, Android grows and as long as Android exists Apple grows. If and when Android growth stops then the dynamics will change and Apple might change strategy to accelerate churn.[5]
Google and Apple will be the primary distributors for all software and services into the foreseeable future. Try as they might, challengers face over 9 billion in installed base. Note well how entrenched Windows has been on the desktop even as (free) Linux and (better) macOS alternatives have harvested usage. This rigidity has held over the 1.5 billion addressable market for 30 years now. For additional evidence consider the dynamics, or lack thereof, of the game console business.
It excludes servers and early phone platforms such as Symbian, Blackberry and Linux phones.
According to ITU Facts and Figures 2024, there were 112 mobile-cellular subscriptions per 100 inhabitants globally in 2024
Households are 1/3 human population and vehicles are only about 1/7 so Home and Automotive don't move the needle much.
AI is, if anything, putting the "smart" back in "smartphone".
This might be what is happening with the Mac Neo, decades after the PC market saturated. Perhaps pieces have finally fallen into place but apart from Chromebooks, it's been very difficult to challenge the Windows PC head-on. (Though the iPad was possibly designed to displace some of the PC usage, it hit mainly with non-consuming very young or very old and PC use was unaffected.)
Goldman Sachs is pushing back on negative sentiment surrounding Apple ahead of its second-quarter earnings, arguing that the stock's recent underperformance reflects fears that do not match the company's underlying position.
But analyst Michael Ng said, "concerns for Apple are overly pessimistic given its much stronger relative position."
Goldman Sachs forecasts fiscal second-quarter EPS of $2.00, above the Street consensus of $1.93, with outperformance expected across iPhone revenue, Mac revenue and gross margins.
Favorable foreign exchange and strong Services revenue growth are also expected to flatter results.
On Services, Goldman Sachs projects 14% year-on-year growth despite another slow App Store quarter, with iCloud+, AppleCare+, prior price increases on Apple TV+ and solid advertising performance cited as supporting drivers.
Looking ahead, the bank sees advertising inventory expansion in the App Store and Maps as further tailwinds.
Recent data points cited by Goldman Sachs include high-end smartphone outperformance flagged by TSMC on its latest earnings call, iPhone share gains in China, and reports that Apple is actively securing mobile DRAM supply while keeping pricing competitive.
The bank sees further catalysts ahead, including WWDC, where new AI Siri features are expected, and the fall iPhone lineup, which Goldman Sachs described as likely "the most innovative ever with the introduction of the iPhone Fold."
Revenues and growth rates for iPhone, Mac, iPad, Services, Wearables, plus Net Sales, Gross Margin, Operating Expense, Other Income and Expense, Tax Rate, Net Income, Share Count and EPS with a comparison to CFO guidance.
Ref. conference call's guidance, Kevan Parekh, Apple CFO: As we move ahead into March, I would like to review our outlook, […]. We expect our March total company revenue to grow by 13% to 16% year over year, which comprehends our best estimates of constrained iPhone supply during the quarter. We expect services revenue to grow at a year-over-year rate similar to what we reported in December. We expect →
In a recent interview Apple management was asked about AI, which is perceived as an area where Apple has been struggling. Greg Joswiak replied: We’ve been doing things with intelligence for many years, right? And gen AI allows us an opportunity to do that even more. So I’m excited about that, but boy, this is not a sprint. This is a marathon.
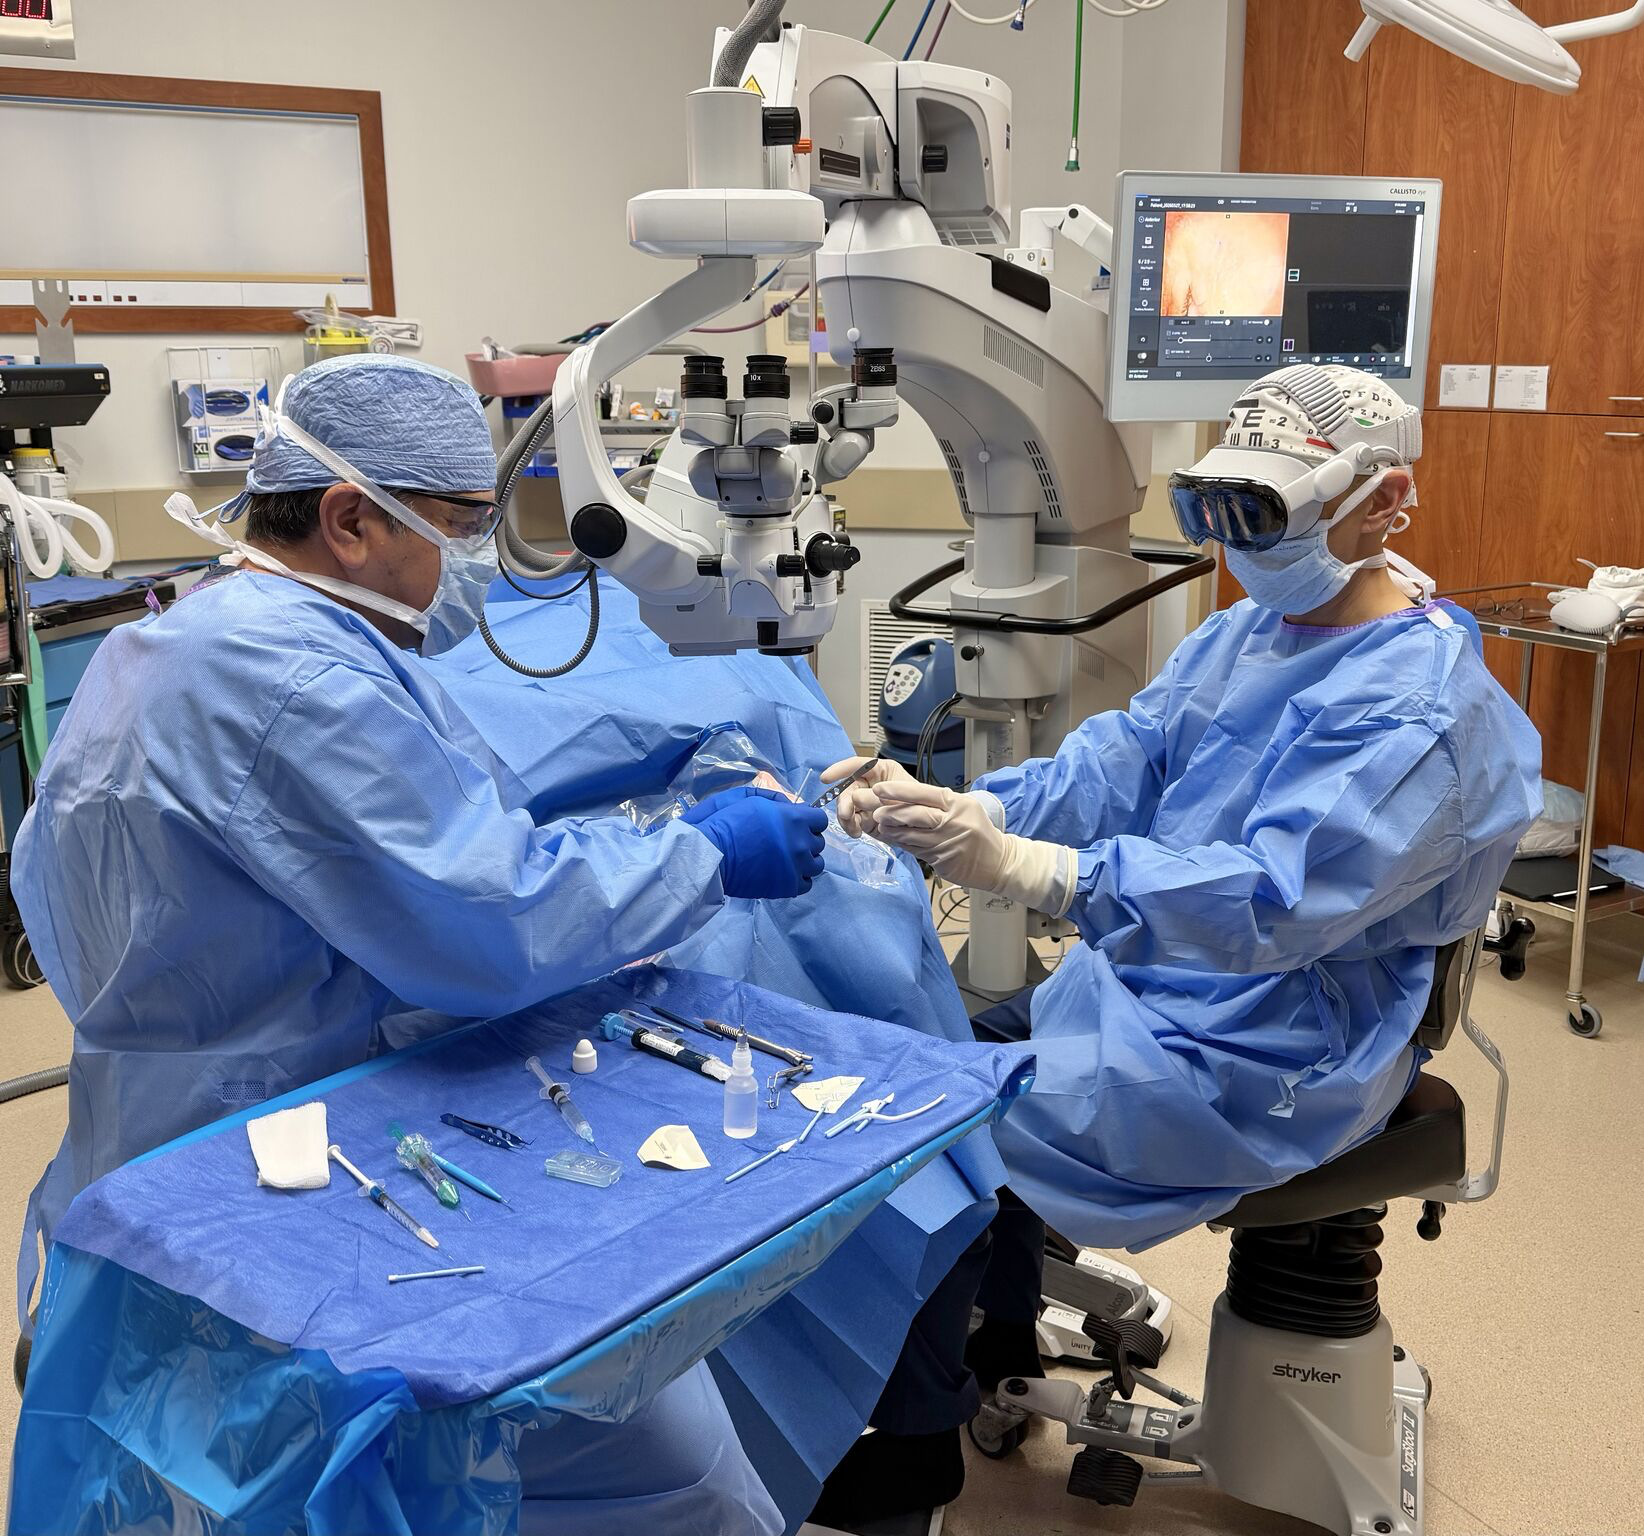
In contrast to AI, Spatial Computing is being largely ignored. It is however making significant leaps in utilization, especially in verticals. →
At just $3,000, the Studio Display XDR democratizes medical imaging, undercutting specialized monitors by up to 90% and revolutionizing healthcare accessibility.
The Studio Display XDR is priced at $2,899 with a VESA mount, and it is more affordable than many specialized medical imaging monitors.
It allows a new set of people to do what previously required only specialists to do and allows specialists to do more than they used to do. →
BofA slightly ups Apple's price target to $325, forecasting $113B revenue and $2.00 EPS for Q2, driven by strong iPhone sales and Services growth, slightly above my estimates of $110B and $2.00.
Q2 forecast update
My own estimates for Q2 revenues and EPS are $110B…
More to follow as we get closer to the earnings release date but this is a good preview. →
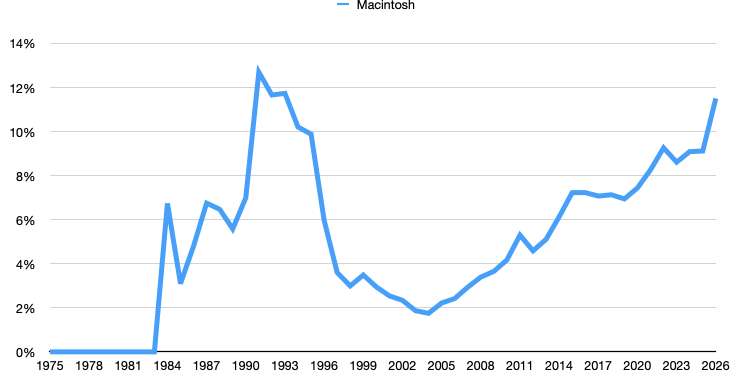
Apple's Mac shipments grew 5.4% to capture 11% market share in Q1 2026, driven by MacBook Air and Neo sales, with revenue estimates slightly differing from unit projections.
Apple growing at double market rate.
Omidia estimates that Apple reached a market shar…
…e of 11% with shipments growing 5.4% due to solid MacBook Air sales performance and the initial sell-in of the MacBook Neo.. This means 5.4% growth for Apple y/y. As I noted in my Office Hour yesterday, I adjusted my Mac growth from 0% to 6% based on the new products launched. This is an estimate of revenues not units but it might be pretty close. Omidia estimates 7,112 million units whereas I’m a little above 6 million. We seem to disagree on ASP. →
Amazon's acquisition of Globalstar boosts its satellite internet ambitions and strengthens ties with Apple, while highlighting the limited reach of space-based networks compared to terrestrial ones.
I assume Apple has wanted to steer clear of Starlink but it’s not clear that was a primary consideration in choosing Globalstar.
Starlink, considered the dominant player, serves about 11 million users. I would note that 11 million is 0.1% of the number of cellular subscriptions worldwide. →
iPhone users boast nearly quadruple the loyalty of Android counterparts, with actual annual switching rates favoring Apple slightly, despite inflated survey intentions.
I did a deep dive into the data and came up with graph above. The original report shows intention numbers which seem quite high. For instance, the net switching rate between iOS and Android is 10% in favor of Apple. This would imply that the entire user base would flip in 10 years. It would also imply…
I think actual net churn is 1.7% of the base each year. That’s still 100 million a year. For now it seems Apple is happy to maintain that rate. →
This episode of Asymco Office Hours covers a wide range of topics related to Apple, including geopolitical risks, financial performance, AI developments, and business strategy. The discussion is led by Horace Dediu and Gene Munster, with insights from industry experts.
BofA raised the firm’s price target on Apple to $325 from $320 and keeps a Buy rating on the shares ahead of fiscal Q2 earnings due after market close on Thursday, April 30. The firm, which sees upside to Street estimates given continued strong sales of iPhone and double-digit growth in Services revenue, forecasts Q2 revenue and EPS of $113B and $2.00, respectively.
Revenues and growth rates for iPhone, Mac, iPad, Services, Wearables, plus Net Sales, Gross Margin, Operating Expense, Other Income and Expense, Tax Rate, Net Income, Share Count and EPS with a comparison to CFO guidance.
Kevan Parekh, Apple CFO: As we move ahead into March, I would like to review our outlook, […]. We expect our March total company revenue to grow by 13% to 16% year over year, which comprehends our best estimates of constrained iPhone supply during the quarter.
We expect services revenue to grow at a year-over-year rate similar to what we reported in December. We expect gross margin to be between 48-49%. We expect operating expenses to be between $18.4 billion and $18.7 billion, which is at a similar level to what we reported in December and driven by higher R&D on a year-over-year basis. We expect OI&E to be around $100 million, excluding any potential impact from the mark-to-market of minority investments, and our tax rate to be around 17.5%.
I've seen several market reports which estimate that iPhone shipments grew around 3% to 6% in the quarter. When I plug in, say, IDC's iPhones number into my model, and assume quite aggressive growth on the other categories (including Services) I get a y/y revenue growth of 11%. This is far below Kevan's January's guidance quoted above (13% to 16%).
Are IDC, Gartner, et. al. signaling a huge miss?
I need to point out that in the preceding December quarter the iPhone grew revenues at 23%! In order for Apple to hit its targets
I'd also point out that when Kevan Parekh made his forecast, in late January, a full month was already on the books for Apple. Visibility into the next month would have been relatively good as orders from the channel are partly foreseeable. For a change from implying nearly 20% growth in sales/14% in units one third of the way in, to IDC's 3% in units for the whole quarter would imply a collapse in demand into February and March. We're talking double digit decline in order volumes.
Moreover, IDC commentary on Apple is
Apple secured second place, driven by the strong performance of the iPhone 17 series, which saw significant growth in China of over 30%. This led to a 3.3% year-over-year increase in global sales for Q1. Although demand remains robust, supply disruptions and a reduction in channel support in some key markets have hindered growth..
30% growth in China! For this to be tied to 3.3% growth globally would imply significant declines elsewhere. I struggle to see how this adds up.
Here is my complete forecast for the quarter including growth rate for revenues for iPhone, Mac, iPad, Services, Wearables, Net Sales, Gross Margin, Operating Exp., OIE, Tax Rate, Net Income, Share Count and EPS with a comparison to CFO guidance.
Much more was said of Jobs’ departure signaling the end of Apple than of Gates’ departure signaling the end of Microsoft. And much more was celebrated of Apple 50 than Microsoft 50. Why is that?
If you were to structure an experiment to determine the influence of processes and personalities on the outcomes of a company, you would be hard pressed to find a better pair to study. Apple and Microsoft were founded almost at the same time, due to the same enabling technologies (microprocessors) and led by two iconoclastic founders of the same age acting out of similar impulses.
The divergences were that one concentrated on software while the other on hardware. But rather than pairing up in a match made in heaven, both tried to outmaneuver the other in order to avoid dependency. →
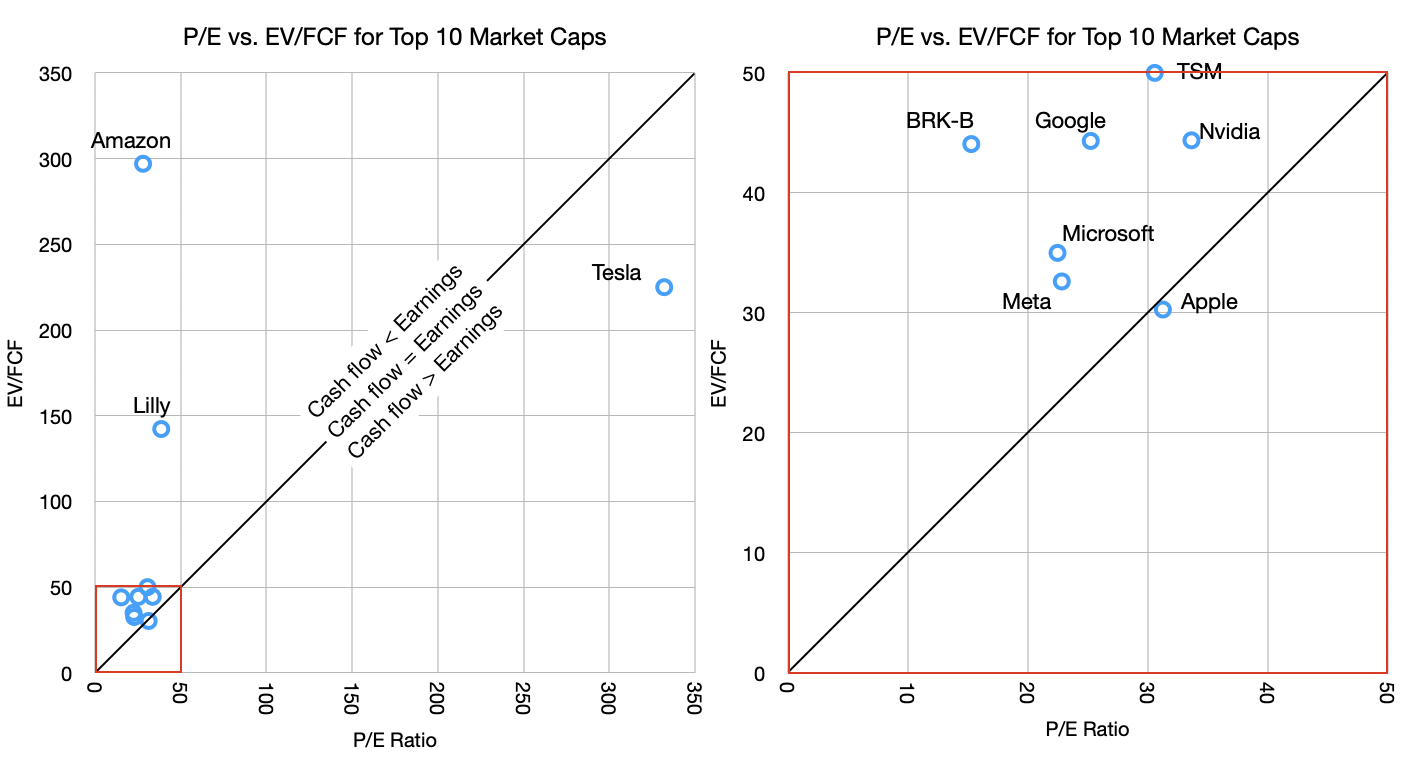
Cash flow is a fact, earnings are an opinion and share price is a dream.
A company’s total worth is the number of outstanding shares multiplied by their value. This product is called the market capitalization or Market Cap.
That’s a simplification. If you want to be more accurate, you should take the Market Cap and net out cash and debt–these are not part of the future flows of cash that can benefit shareholders.
More precisely, there is another measure called the Enterprise Value (EV) which is the total price tag of a company, representing what it would cost to buy the entire business and pay off its debts. EV = Market Cap + Total Debt + Preferred Stock + Minority Interest – Cash and Cash Equivalents.
This is the precise and complete measure of the firm’s value but we use the shortcut of Market Cap since In most cases the Preferred stock and minority interest are negligible and if cash equals debt then the result is EV =~ Market Cap. it’s easier to calculate anyways as the shares outstanding and share price are easily available. Not so for EV. →
What are the odds of it surviving another year, ten years, 50 years?
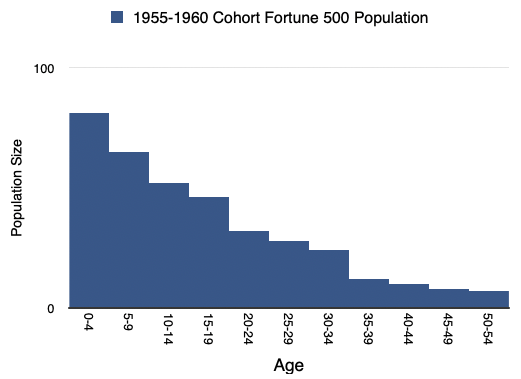
Companies don’t last long. A recent study that analyzed thousands of European firms yielded a corporate life expectancy figure of 12.5 years. The Boston Consulting Group analyzed the entry, growth, and exit dates of 35,000 publicly listed companies and determined that one in ten of all public companies fail each year, a fourfold increase since 1965.
As I illustrated many years ago in a talk titled “The Unfortunate 500” most companies die not long after adolescence. Of the Fortune 500 1955-1960 cohort, the 81 companies which joined the index in those years, only 7 remain there today. One third of the corporations on the 1970 Fortune 500 list were no longer in existence thirteen years later. Broadly speaking, as a population, large companies that make it to the Fortune 500 listing have life expectancy within that group of 17 years. →
Today marks the 16th anniversary of when Apple released the first-generation iPad.
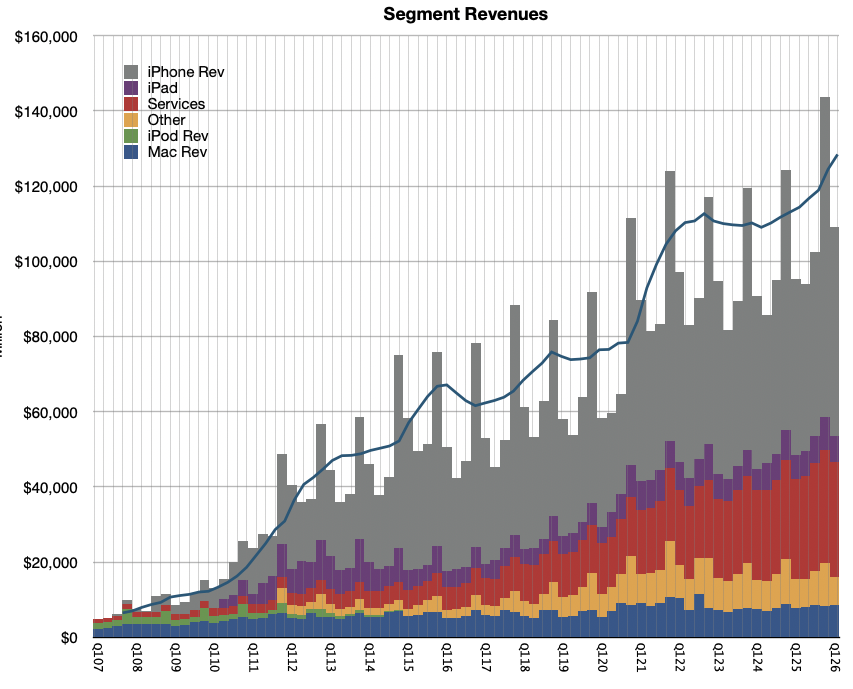
To many, including Alan Kay, the tablet form factor makes much more sense than the PC form factor. It’s more approachable, more intuitive and certainly smaller and more portable. As the graph shows, quickly after launch, the iPad overtook sales of the Mac.
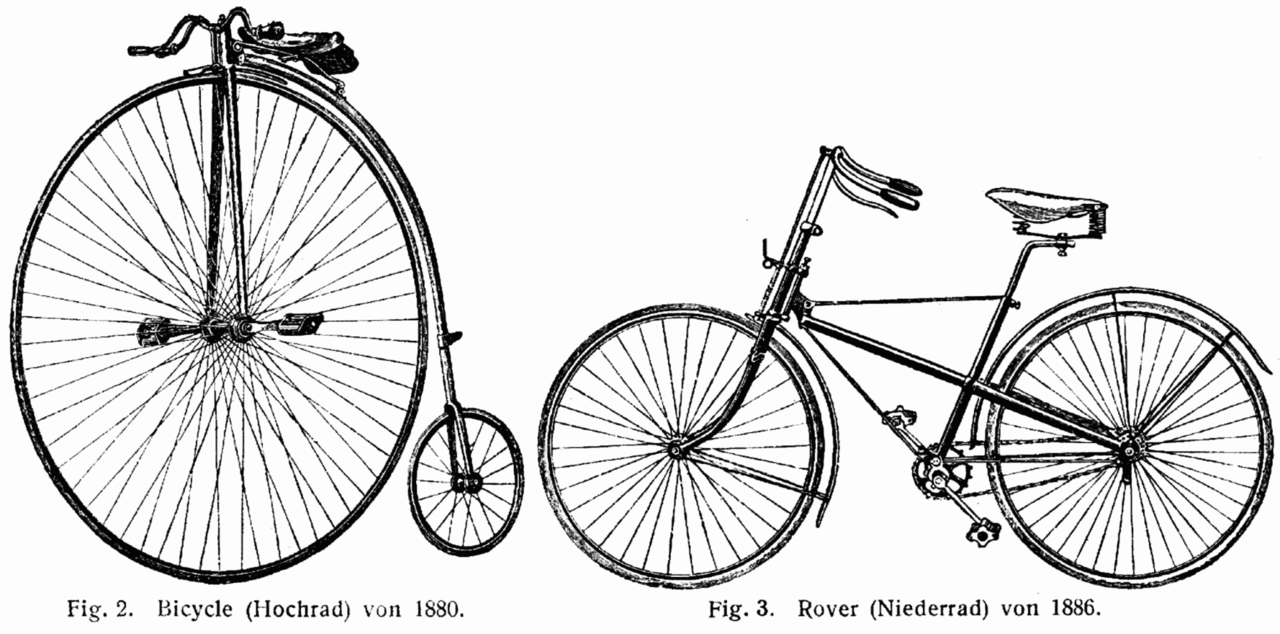
The problem arose that whereas the iPad was smaller, the iPhone what smaller still–so much so that users would take phones with them everywhere. At the same time, the “PC” shrank as well so that many notebook (laptop) computers became thin, light and had day-long battery life. The Mac at least became no bigger a burden to carry than an iPad.
So the iPad was stuck in the middle between an iPhone, that did more and more, and a Mac that was very portable. At this point many said that the iPad was a dead end form factor. →
ON September 3, 1821, 37 years after James Watt invented the concept of horsepower and started charging £5/horsepower/year for the use of his steam engine, the first demonstration of the production of a mechanical force by the interaction of an electric current and a magnetic field was given by Michael Faraday in the basement of the Royal Institution in London.
1820 is, in many chronicles, noted as beginning of the industrial revolution. It marked the end of 50 years of war, whose conclusion unleashed pent-up demand. That demand was served by relatively free trade, guaranteed by British naval power, coupled with property rights and financial instruments which allowed inventions of the previous century to finally be harnessed for commercial gain. The steam engine is the canonical invention of the era and its implementation as a source of power for factories, shipping, rail and machinery is legend.
Not usually noted as coincidental to this period is the electric motor. Yet not long after Faraday’s 1821 demonstration in London, the first DC electric motor capable of turning machinery was invented by William Sturgeon. In 1832 he built on Faraday’s electromagnet by incorporating a commutator which oscillated the direction of current to ensure continuous rotation.
Nota Bene.
The Motley Fool asks: Where Will Apple Stock Be in 5 Years? → Not reading this article is probably a wise decision. Shares could perform in line with the S&P 500’s long-term average Investors can follow a straightforward exercise to try and figure out where Apple’s stock price will be in late March 2031. It’s important to consider both the valuation and profit gains. We just released a […] →
Apple’s services continue to see increased engagement, spending → The survey of 3,500 smartphone users reveals a significant rise in average monthly spend on Apple services to $13, driven by increased adoption of premium offerings like AppleCare/One, Apple TV+, and Apple Music, with notable shifts towards AI features despite muted upgrade intent, though potential US bias may affect overall accuracy. →
iPhone sales continue to surge into February – Bernstein → February saw robust iPhone sales driven by the iPhone 17 line, with global unit sales up 26% and ASP climbing 6.9%, yet January-February revenue estimates oddly lag behind projections, sparking confusion. →
Morgan Stanley has a stark message for investors in Apple → Morgan Stanley's survey indicates strong potential for Apple stock, highlighting record iPhone upgrade intentions, especially in China, improved switching rates, and significant interest in a future foldable iPhone. These factors support robust FY26 shipment forecasts and suggest a possible revenue boost from new products. Despite some concerns about declining willingness to pay for AI features, Morgan Stanley maintains an optimistic outlook with a $315 price target. The article criticizes TheStreet's editorial approach for misrepresenting the positive survey findings as negative news about Apple. →
Mac mini and Mac Studio orders booming → Apple's Mac sales are surging due to the M5 chips' enhanced AI capabilities, outpacing other platforms and driving demand despite current shipping delays. →
Gartner adds their Mac Q1 estimate to the pile → In Q1 2026, Apple's Mac sales surged impressively by 10.7% to 12.7% year-over-year, driven by the MacBook Neo's appeal, securing a 10.6% global market share and maintaining fourth place among PC vendors, amidst a 4% rise in overall PC shipments. →