Recording and transcript of the June 9, 2026 Asymco One Office Hours, recorded the day after Apple's WWDC 2026 keynote. Horace Dediu shares his impressions of the event and takes questions from Asymco One subscribers.
Apple recently hit an all-time high. Today the stock is trading at a P/E of 35. The P/E ratio is the current share price P divided by the last four quarters’ net earnings per share E. But we also have a pretty good idea of the earnings for the next quarter, ending June (now almost half-way completed). The guidance very clearly suggests that on a one Quarter forward basis the P/E ratio is 34.
I’ve maintained for at least 15 years that a reasonable multiple for Apple is 35. This was mainly because other large cap technology companies were also trading around that number. While at this ratio, if a company is growing at 22% it means that an investor will make their money back in about 10 years. Thereafter all free cash flows will go entirely to the investor’s pocket. That seems a reasonable return. It’s not a particularly risky bet to assume 20% growth for 10 years if you look at (a) history and (b) how many people in the world have not yet started using Apple products and (c) assess how well management is doing their job.
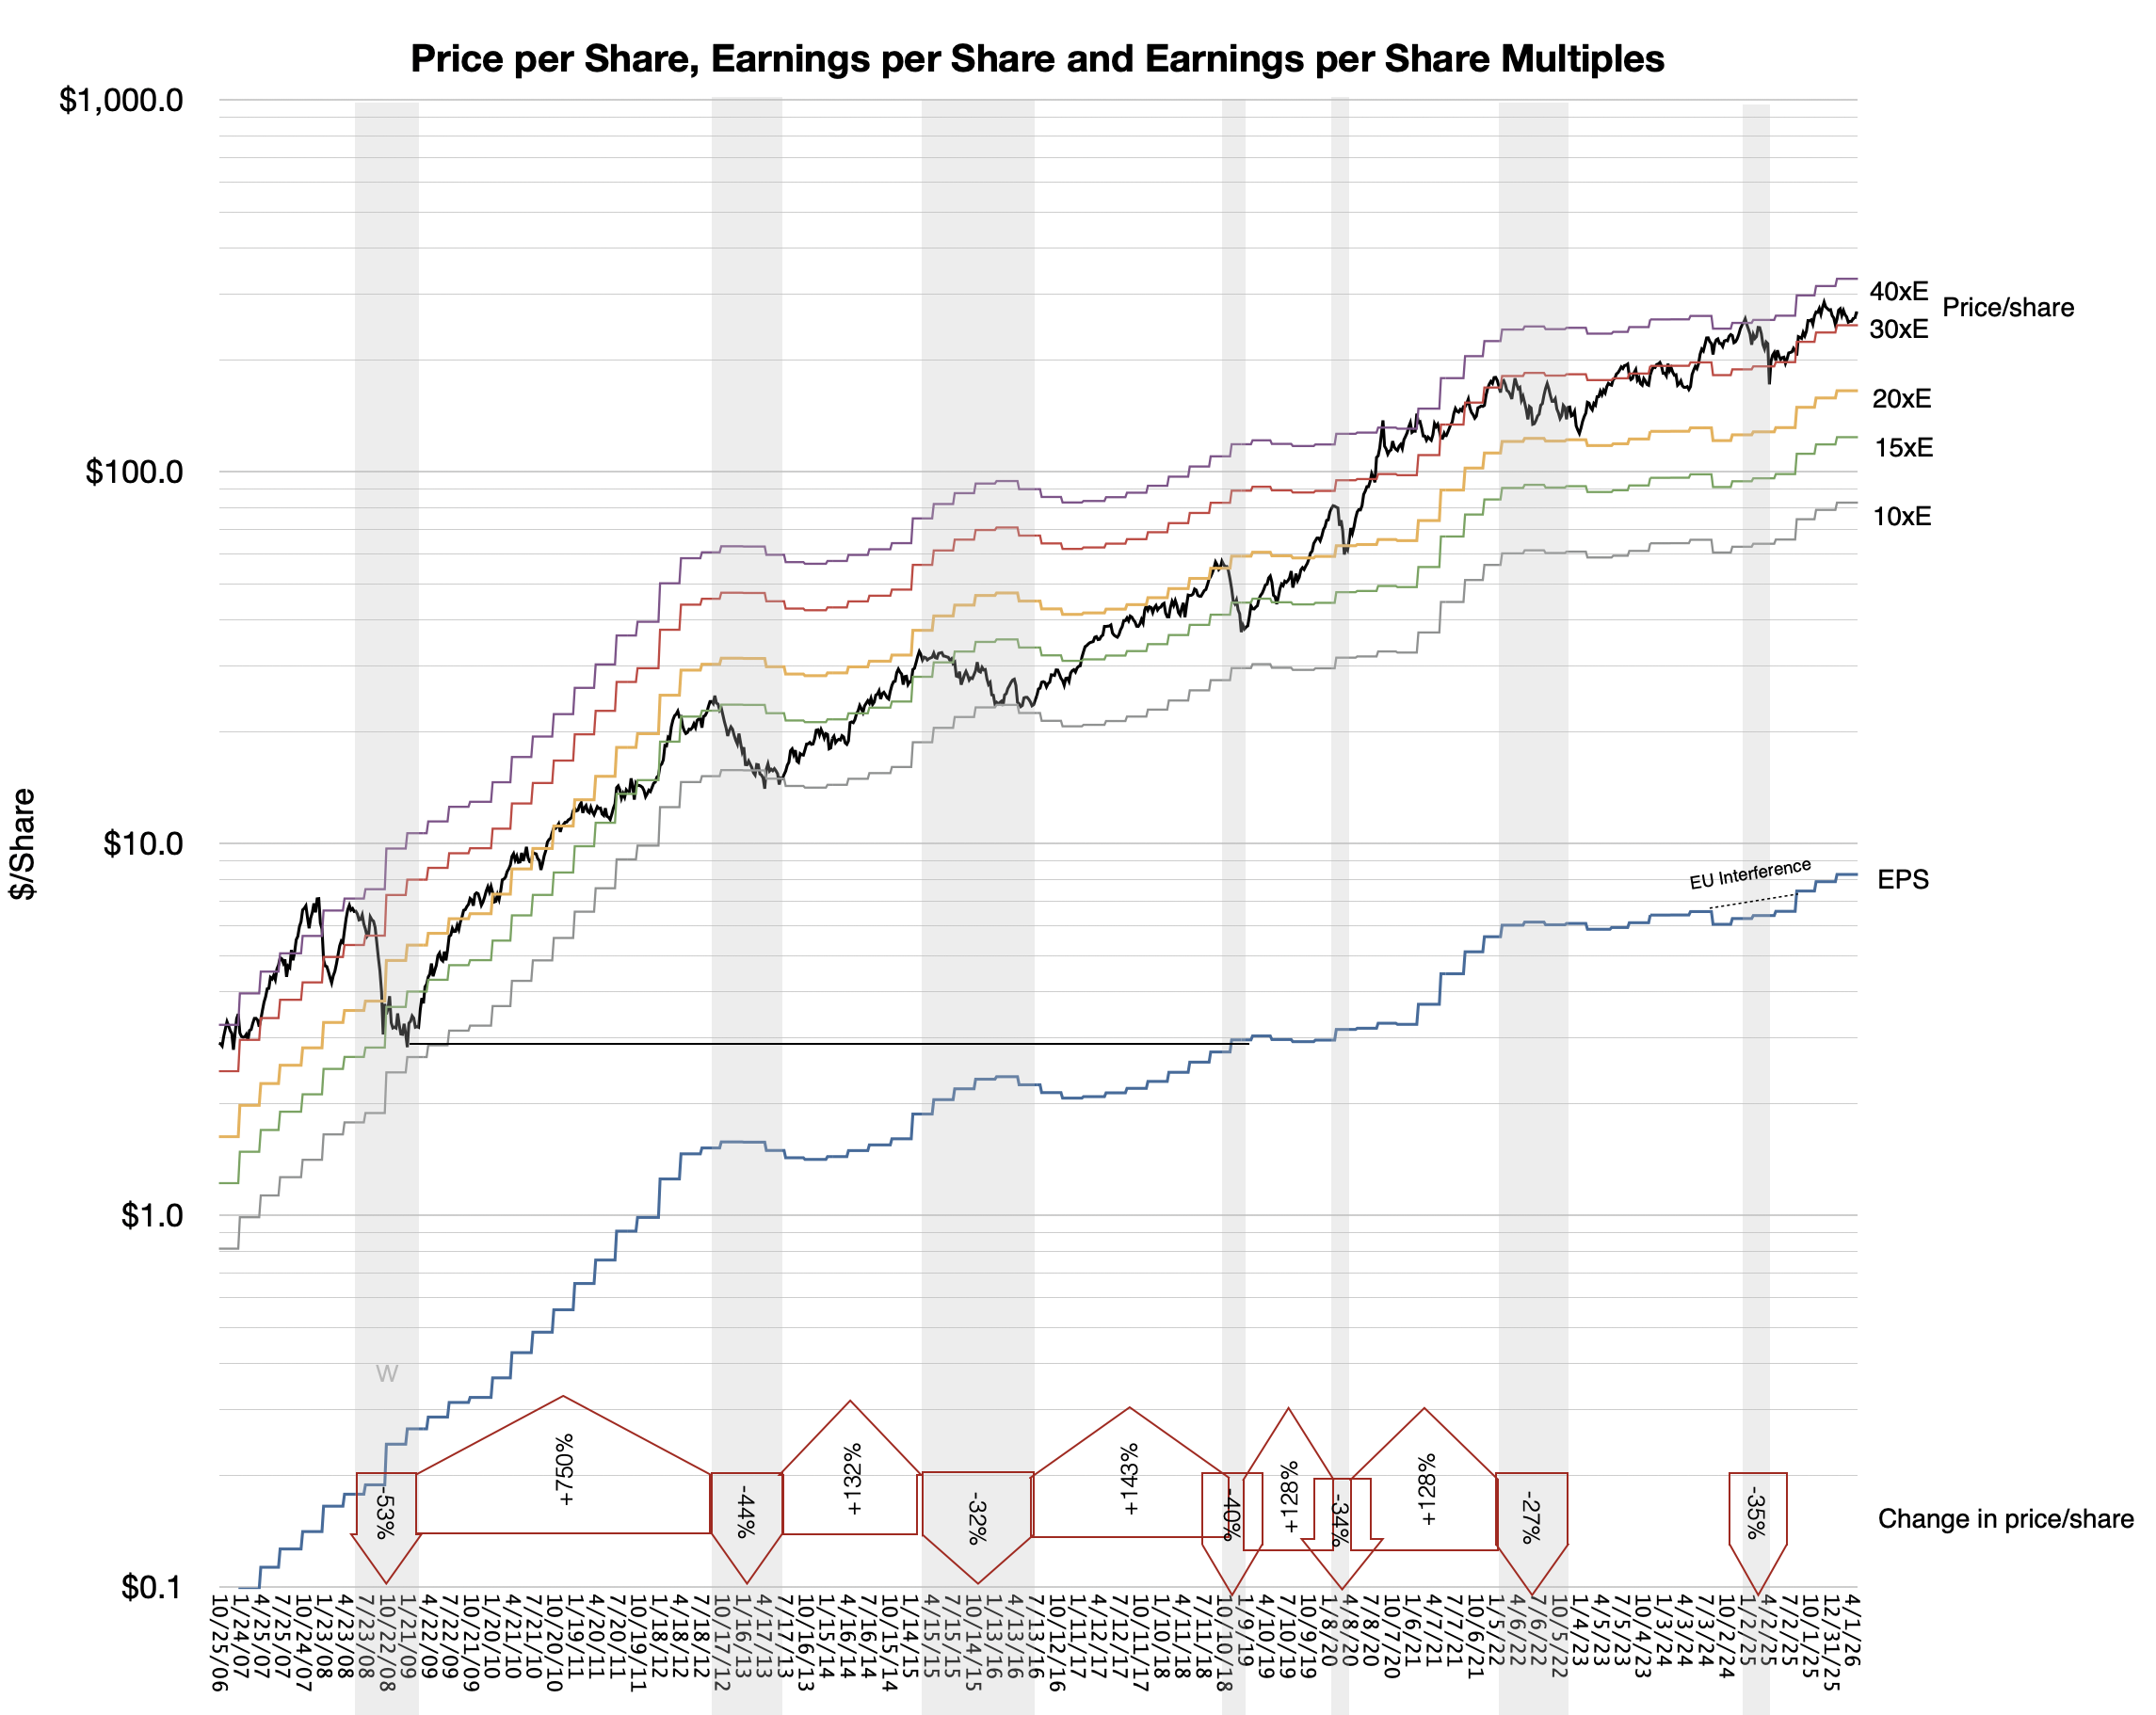
So by this measure, Apple seems to be reasonably priced. Historically it has not been reasonably priced but that is due to the disconnect between understanding the business and falling for the usual false tropes. The following graph shows the share price and where it fell between the bands of Earnings multiples. The grey areas represent periods of significant share price decline.
But much of the volatility of the stock is also due to overall sentiment collapse. That has happened on many occasions, most notably the 2008 financial crisis and “great recession.” (Another was the Covid crisis.) In these cases, regardless of underlying strength, the shares were available very cheaply.
Today perhaps we should ask if a bubble is forming due to exuberance around AI which is inflating the market in unsustainable ways.
There are four reasons why the current asset value explosion is different.
First, it is highly concentrated in a handful of names.
2005 S&P 500 top 10
% of the S&P index
2026 S&P 500 top 10
% of the S&P index
Exxon
3.1%
NVDA
7.8%
MSFT
2.5%
GOOG
7.3%
Citigroup
2.2%
AAPL
6.4%
GE
2.0%
MSFT
4.6%
Walmart
1.7%
AMZN
4.4%
BoA
1.6%
Broadcom
3.0%
J&J
1.6%
TSLA
2.4%
Pfizer
1.4%
META
2.3%
Intel
1.3%
Walmart
1.6%
AIG
1.3%
Berkshire Hathaway
1.5%
Total
18.7%
41.3%
Second it is fueled by equity not debt. Third, it involves disproportionate capital expenditure rather than M&A. Fourth it is accompanies by sharply growing revenues (though not as sharp as investment growth.)
In other words, whereas the equity value is growing rapidly, so is income and investment without leverage. This is a low-debt with high income scenario. Previous crises were high income with high debt (2008) or low income with low debt. (Dot Com).
That’s not to say that we have uniform fair equity values. We need to do quite a bit more due diligence to determine the state of the valuations precisely because we have unusual capital allocation strategies.
To cover this topic I’ll will break the analysis into multiple posts. They are:
Why the most common metrics for valuation are insufficient — the problem with the P/E ratio
What are the alternatives that into consideration exceptional cash and capital expenditures — The EV/FCF ratio
How does the P/E ratio differ from EV/FCF and what does it mean if they diverge one way or another
How do the Mag 7 et. al. appear on these Metrics
How to complement snapshots like valuation ratios with the time series of fundamentals
Why payback measures are the ultimate measure of valuation
What are the current payback measures for the Mag 7 et.al.
Compare Apple to its peer group
Finally assess whether a collapse in confidence is imminent
Please return to these pages in the next few days to read these posts.
Alphabet generated $73.266 billion in free cash flow in FY2025, which sounds enormous until you look at what's coming. CEO Sundar Pichai has guided for 2026 capital expenditures in the range of $175 to $185 billion. For context, Alphabet's FY2025 operating cash flow was $164.713 billion. If capex hits the midpoint of that guidance range, it consumes essentially all operating cash the business generates.
The trajectory has been accelerating hard. In 2023, Alphabet spent $32.3 billion on capex. In 2024, that rose to $52.5 billion. In 2025, it hit $91.4 billion, a 74% year-over-year increase. The proposed jump to $175-185 billion in 2026 would be another near-doubling. Q4 2025 alone saw capex grow 95% year-over-year to $27.9 billion.
This dynamic is playing out across the peer group. Amazon already lived this story in 2025: FY2025 free cash flow collapsed 65.95% year-over-year to $11.194 billion as capex hit $131.8 billion. CEO Andy Jassy has guided for approximately $200 billion in capital expenditures across Amazon in 2026.
Meta and Microsoft are spending aggressively too. Meta's FY2025 free cash flow declined 19.39% year-over-year to $43.6 billion against 2026 capex guidance of $115 to $135 billion. Microsoft's Q2 FY2026 capex alone was $29.9 billion, up 89% year-over-year.
Patel's broader point is that tech insiders understand the technology better than financial markets, and that returns on AI infrastructure will ultimately justify the spend. The businesses backing these bets are not struggling — Alphabet posted Google Cloud revenue of $17.7 billion in Q4 2025, up 48% year-over-year, with a 31.6% operating margin at the Alphabet level. Full detail is in Alphabet's SEC filing.
Whether it's applied enough is exactly what Patel is questioning. If you believe AI infrastructure is a winner-take-most game and Alphabet and Amazon are positioned to win it, the FCF compression looks like the price of admission. If you think the returns won't materialize at the scale management expects, zero free cash flow at a $1.7 trillion market cap is a very different conversation.
NB: Even before these future investments are considered, for the trailing twelve months Alphabet's EV/FCF has his 73 vs. a P/E ratio of 29. If FCF goes to zero…
Cash flow is a fact, earnings are an opinion and share price is a dream.
A company's total worth is the number of outstanding shares multiplied by their value. This product is called the market capitalization or Market Cap.
That's a simplification. If you want to be more accurate, you should take the Market Cap and net out cash and debt--these are not part of the future flows of cash that can benefit shareholders.
More precisely, there is another measure called the Enterprise Value (EV) which is the total price tag of a company, representing what it would cost to buy the entire business and pay off its debts. EV = Market Cap + Total Debt + Preferred Stock + Minority Interest - Cash and Cash Equivalents.
This is the precise and complete measure of the firm's value but we use the shortcut of Market Cap since In most cases the Preferred stock and minority interest are negligible and if cash equals debt then the result is EV =~ Market Cap. it's easier to calculate anyways as the shares outstanding and share price are easily available. Not so for EV.
To get a sense of how much you're paying for the company it makes sense to divide the Market Cap by the company's Earnings so you get an idea of how many years it will take to get back your investment. When dividing both Market Cap and Earnings by the number of shares it becomes the famous P/E ratio or Price per share / Earnings per share.
But if you want to be fully precise, instead of using Market Cap you should use Enterprise Value. In that case the denominator should be Free Cash Flow or FCF[1]. The ratio becomes EV/FCF. Free Cash Flow is a better measure than earnings because it takes into consideration depreciation, change in working capital and capital expenditures. It measures the actual cash a company generates after paying for its operating and capital expenditures.
EV/FCF takes into consideration unusual situations such as huge amounts of cash or debt or capital expenditures which removes shareholder access to what the company "earns" on paper. This why the adage of "earnings are an opinion but cash flow is a fact" exists.
I used EV/FCF years ago to value Apple because at a time when it held huge amounts of cash. This was before it began aggressively reducing its cash through its capital return program. The P/E ratio at the time was very low but excluding the cash, it was even lower. It was a huge red flag indicating that the company was being priced for liquidation, or as some analyst put it, priced like a steel mill going out of business. If at that time you did not believe that its demise was imminent you would have surely been richly rewarded.
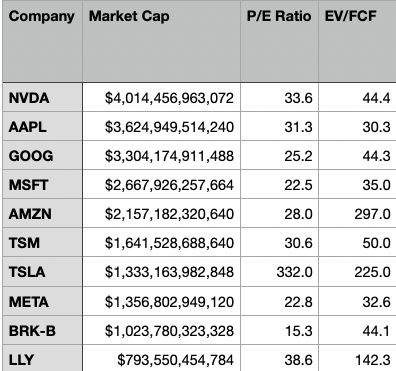
Today the anomaly that throws the P/E off is not Cash but CapEx. And it's not for Apple but for the other mega caps or AI "hyper scalers". Without worrying who is or isn't in the "Magnificent 7" I compiled the largest 10 market capitalization companies and looked at their P/E and EV/FCF ratios. At time of writing:
Company
Market Cap
P/E Ratio
EV/FCF
NVDA
$4,014,456,963,072
33.6
44.4
AAPL
$3,624,949,514,240
31.3
30.3
GOOG
$3,304,174,911,488
25.2
44.3
MSFT
$2,667,926,257,664
22.5
35.0
AMZN
$2,157,182,320,640
28.0
297.0
TSM
$1,641,528,688,640
30.6
50.0
TSLA
$1,333,163,982,848
332.0
225.0
META
$1,356,802,949,120
22.8
32.6
BRK-B
$1,023,780,323,328
15.3
44.1
LLY
$793,550,454,784
38.6
142.3
As recently as six months ago, there was a lot of talk about an AI bubble. Back then I looked at the data then and by looking at the P/E ratios convinced myself that the valuations were not "bubble" level. They were in the mid-thirties. These were not historical high especially when considering the growth these companies were experiencing (over 30%). Since then prices have come down significantly.
This is as the CapEx elephant in the room has been making itself known and there is renewed alarm at the scale of capital spending. This is reflected in the EV/FCF number but not in the P/E number.
The table above shows how much more elevated the EV/FCF ratio is relative to P/E for many of the companies. This "truer" measure of what you are paying as a share buyer is now reflecting in reduced share price and hence reduced P/E.
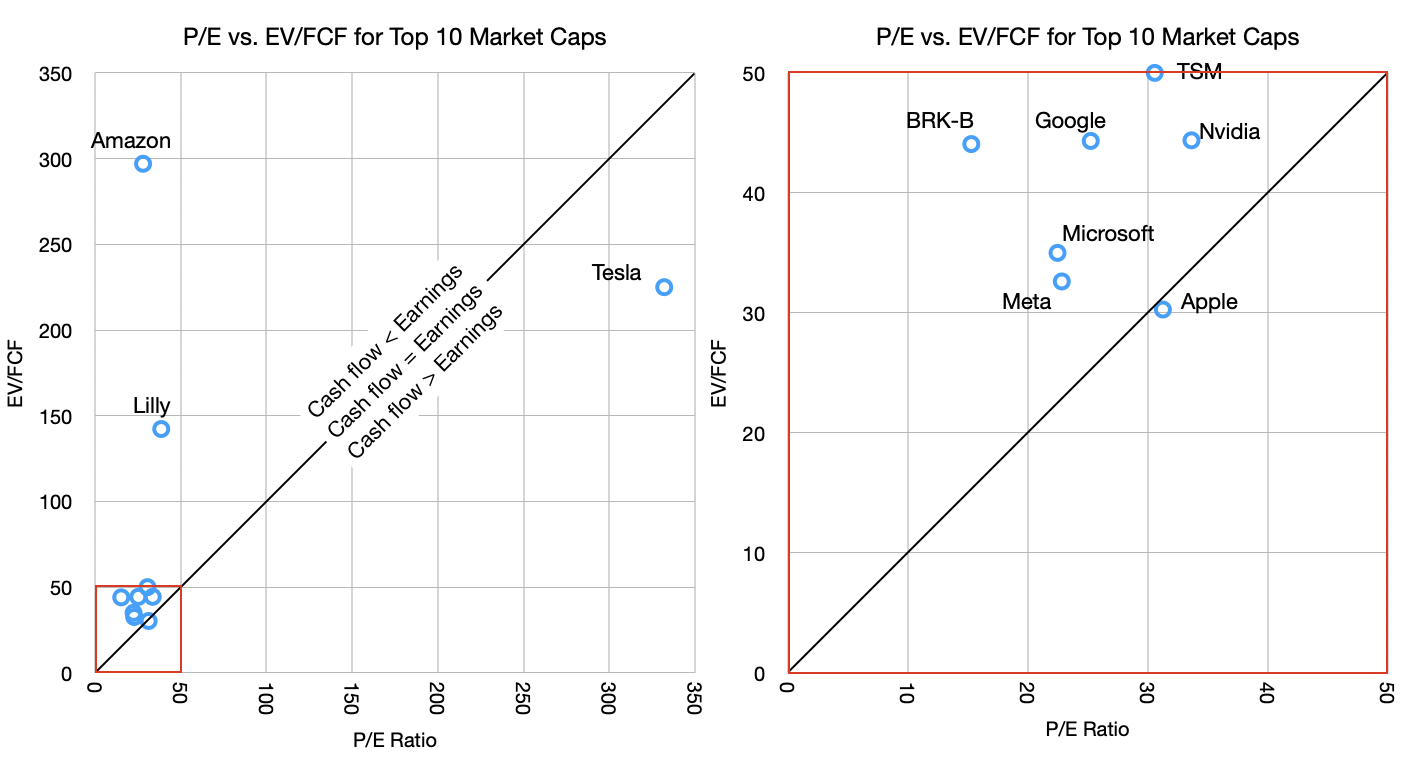
Of course, this is not true for Apple. Apple's P/E ratio and EV/FCF are nearly identical. To see this more clearly I put together these graphs.
The graph shows the P/E vs. EV/FCF for the companies in the table. The graphs are the same data but the one on the right is zoomed in on the lower left corner (note the red squares).
The reason for the zoom is that there are three outliers. Tesla, Amazon and Lilly. Tesla has absurd valuation on both P/E (300 to 400 range in last 6 months) and EV/FCF while Amazon has an outrageous EV/FCF value due to abnormal capital spending. Basically, Tesla has negligible earnings (and negative growth) while holding astronomical share price and Amazon is spending far above its median on CapEx. Amazon's 10-year EV/FCF is much lower, at approximately 55.
But let's ignore the outliers and concentrate on the other seven in the cluster. These are below 50 P/E and 50 EV/FCF thresholds.
Note that I drew a diagonal line representing the equation of P/E = EV/FCF. This should, under normal circumstances, hold for most stocks. Just like Market Cap should roughly equal Enterprise Value so Earnings should equal Free Cash Flow.
Most companies should not stray too far from this line. But what we are seeing, with the notable exception of Apple, is that most tech companies have cash flow far below earnings. This is again due to the CapEx elephant.
The argument goes that this is a temporary situation with that capital being wisely deployed for returns from AI. Presumably, these companies will swing to the other side of the line, where cash flows will exceed earnings, compensating for the capex that was denied to the shareholders.
This is where the old adage comes into play: Earnings are an opinion but cash flow is a fact. I added to that "and share price is a dream". Take the free cash flow and multiply it by a "dream" and you get the price the market sets. This dream is the multiple.
What makes the AI "bubble" interesting is how it's not fueled by debt[2] but by cash flow. Companies are turning over large portions (almost all and sometimes more) of their cash flows to investing in the dream of AI profits. All but one, of course.
There is something obviously contrarian in Apple's strategy. Perhaps it's not Apple that is odd but rather there is groupthink on behalf of the others. The question of who's right will rest on whether it turns out that AI is going to commoditize quickly or perhaps never, whether AI turns out to be modular or integrated, whether AI exhibits disruptive or sustaining competitive responses, whether it's an infrastructure subject to regulatory corrosion or whether it will migrate to the edge and iterate freely, whether it's a new experience or simply better existing experiences, whether it creates new markets or just makes existing ones more efficient.
These are not new questions. They have been applied to all software and hardware innovations of the last 40 years. We have a lot of history to inform us.
Asymco Bulletin is a digest of all the work we have published for the week ending Apr 5, 2026.
Podcast
Apple at 50: Ben Thompson of Stratechery interviews Horace Dediu → Horace describes his journey from Romania to becoming a leading tech analyst, highlighting his experiences at GTE Labs, business school under Clayton Christensen, and Nokia during the iPhone's birth. He emphasizes Apple's customer-centric approach and its potential to navigate AI challenges. Dediu also shares insights on his new paid service, Asymco One, and reflects on the importance of understanding market dynamics and customer satisfaction. He expresses optimism about Apple's future and underscores the value of deep, long-term analysis in tech forecasting. →
Apple’s Business Strategy → Apple's enterprise growth is driven by its strong consumer base. Do new services like Apple Business suggest a new emphasis? →
Melius highlights FCF while reiterating buy on Apple → In the AI era, valuation shifts from traditional P/E to EV/FCF, highlighting Apple's robust financial health and fair valuation amidst its significant product launches. →
The iPhone 50 years from now – and why Apple won’t have AI execs → Rumors suggest the iPhone 70th anniversary edition might feature an innovative new camera system, while Apple CEO Tim Cook dismisses the idea of AI-led executives due to legal and functional constraints. →
Ben Thompson of the Stratechery interviews Horace on the Stratechery Plus Podcast to discuss Horace's journey to become an influential tech analyst: early career in research, business school under Clayton Christensen, and his time at Nokia during the rise of the iPhone.
The conversation further explores Disruption Theory in the context of both smartphones and AI, why Christensen misjudged Apple, and whether AI could challenge today’s tech giants. It also marks the launch of Dediu’s new paid service Asymco One and reflects his continued conviction in Apple Inc. at its 50-year milestone.
“Given Apple’s free cash flow and we are about to embark on one of its most lucrative product rollouts since the big screen iPhones in 2014 - there is a case for Apple’s stock regaining some ground,” Melius analysts wrote in a note to clients.
Lately, Apple has announced the iPhone 17e and a refreshed iPad Air, a new MacBook Air, a MacBook Pro, new Studio Displays, the MacBook Neo, and an updated version of its over-the-ear headphones, the AirPods Max 2.
Apple shares were modestly higher in premarket trading but have lost some 8% year-to-date. Over the past 12 months, shares have gained 12%.
NB: Free cash flow (FCF) is the amount by which a business's operating cash flow exceeds its working capital needs and expenditures on fixed assets (known as capital expenditures). It is that portion of cash flow that can be extracted from a company and distributed to creditors and securities holders without causing issues in its operations. As such, it is an indicator of a company's financial flexibility and is of interest to holders of the company's equity, debt, preferred stock and convertible securities, as well as potential lenders and investors. It has come recently into vogue when the bill for AI infrastructures has come due...
The table above shows the P/E ratios vs. the EV/FCF ratios of the top 10 largest market caps in the world.
The 3rd? most valuable company on Earth watched as its rivals lit $650 billion on fire and did nothing. The biggest cash bonfire in history, by far, eagerly fed by all the usual suspects but one.
It's either the dumbest or the most brilliant move in corporate history.
Apple used to be the biggest capex spender, mainly because it paid for most of the property plant and equipment in the factories that made its phones and computers. The so-called tooling or equipment spending plus its leased store renovations and some data centers were costs no other tech giants had and so Apple was an outlier. It was, as I wrote at the time, equivalent to buying a few aircraft carriers every year.
But that all changed with AI. Amazon is spending $200 billion this year on AI data centers. Google, $185 billion. Microsoft, $114 billion. Meta, $135 billion. Combined: $650 billion. [Not including OpenAI, Anthropic and SpaceX/XAI.] That is like buying the US Navy every year. And yet Apple's capital budget is still a modest $14 billion, oscillating with new hardware tooling cycles.
Apple is refusing to transfer its cash flow to Nvidia. Curiously, it believes that its cash flow belongs to its shareholders, not to Nvidia's.
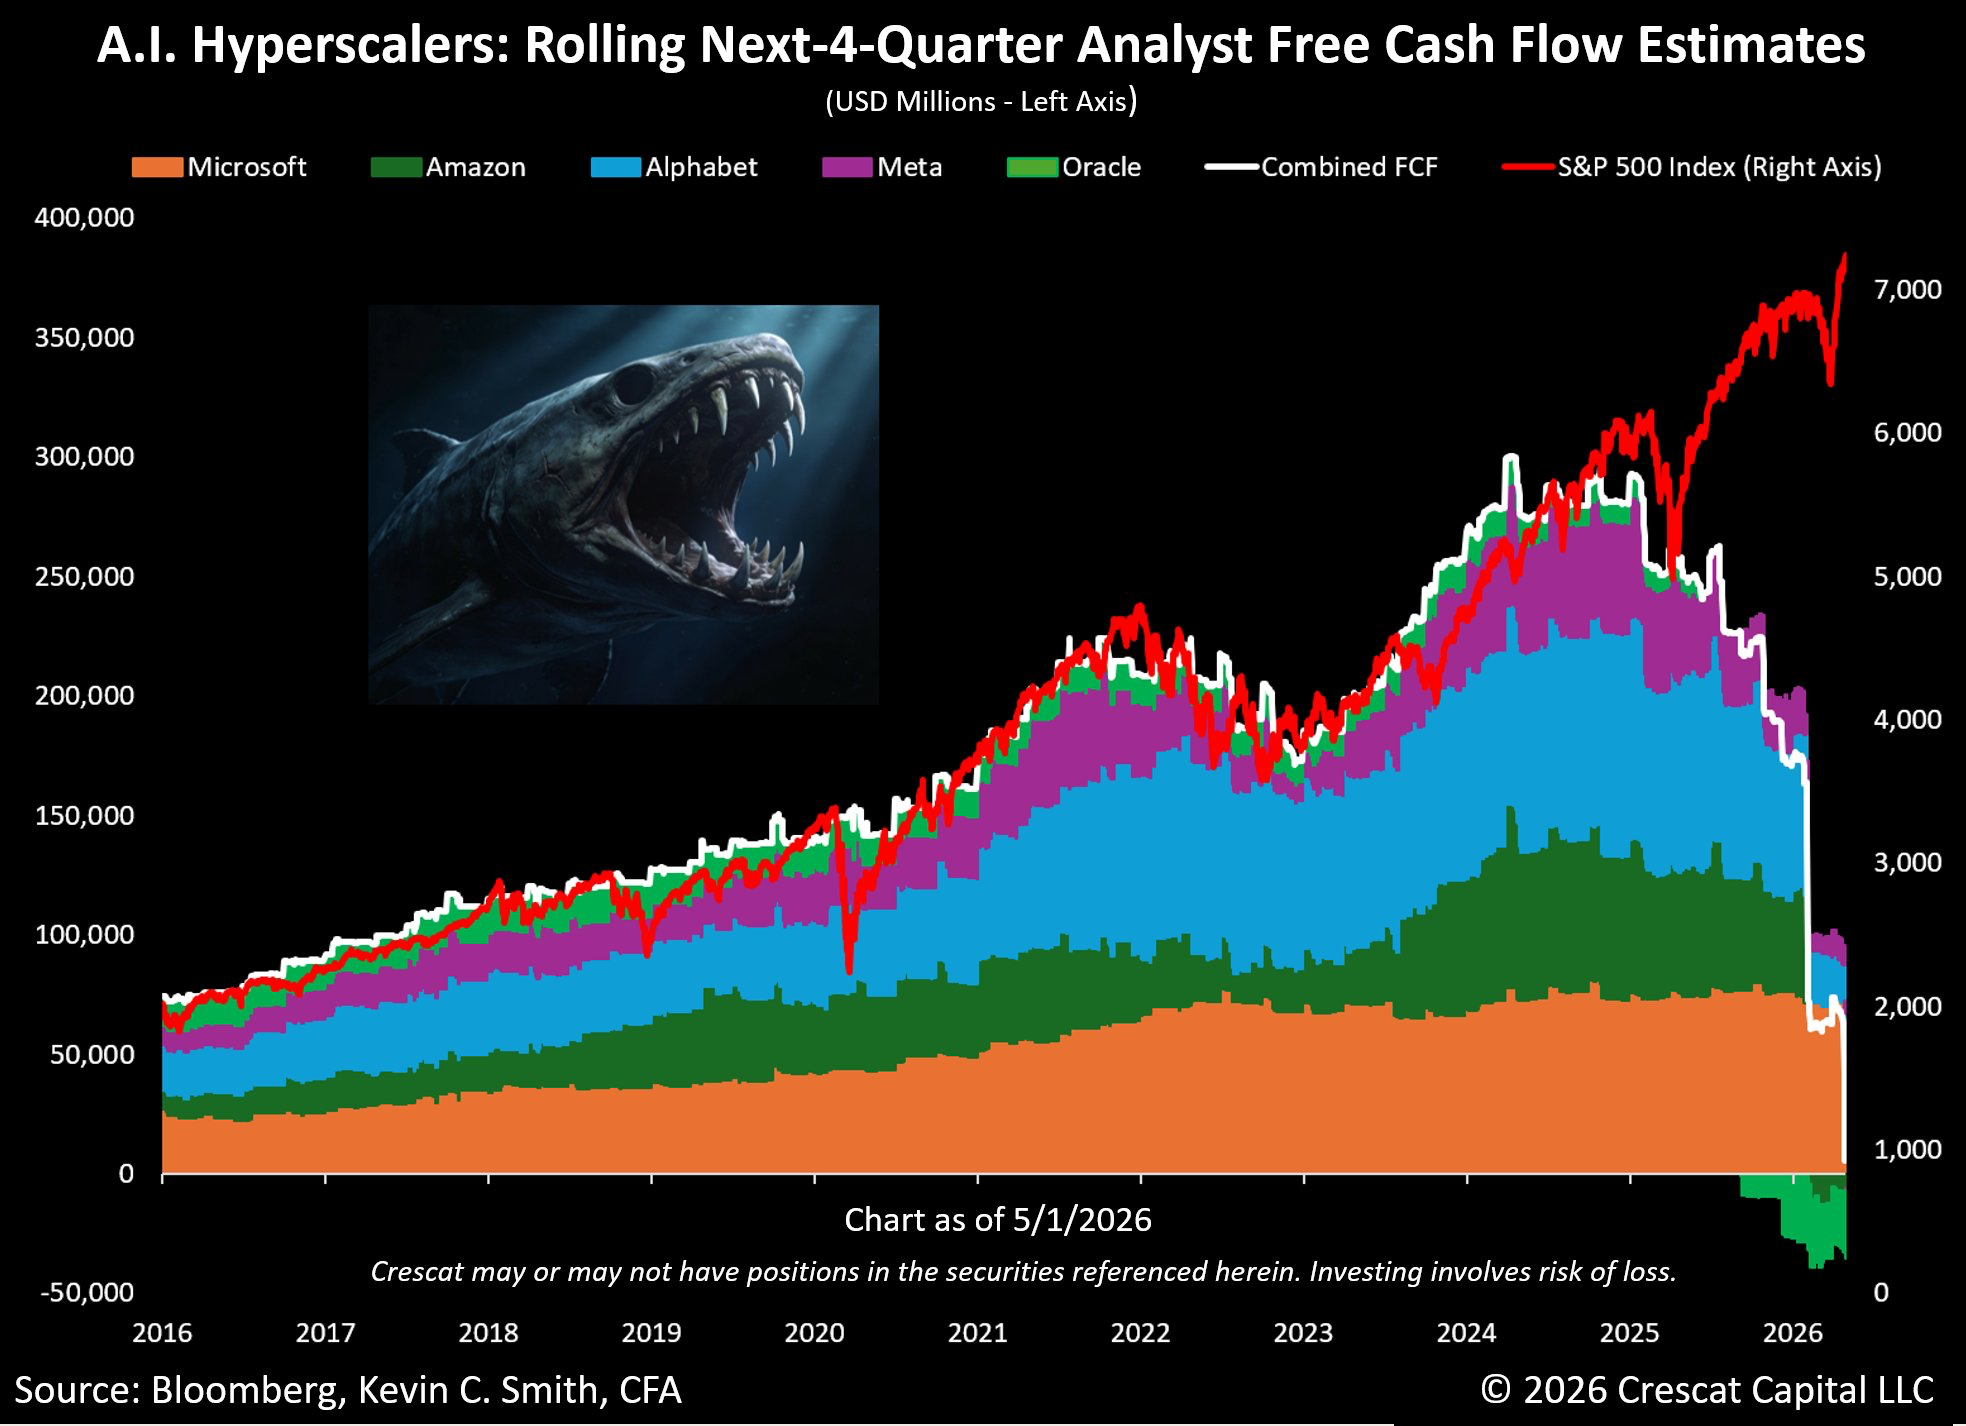
The hyperscalers are now spending 94% of their operating cash flows on AI infrastructure. Amazon is projected to go negative free cash flow this year with as much as $28 billion in the red. Alphabet's free cash flow is expected to collapse 90% from $73 billion to $8 billion. These companies used to be the greatest cash machines ever built. Now they're borrowing money to keep the data center lights on.
The Big Five raised $121 billion in bonds in 2025 alone. Morgan Stanley projects $1.5 trillion in tech debt over the coming years. For the first time in history, hyperscalers hold more debt than cash. Perhaps this is why their P/E ratios slumped from mid thirties to mid twenties.
And what are they getting for that $650 billion? AI services generate roughly $35 billion in total revenue or 5% of what's being spent on infrastructure. There are dreams of more of course, but the business models of AI have yet to resonate, especially for consumers.
Now here is where Apple's bet becomes genius. AI models are commoditizing faster than anyone predicted. Software and hardware both have tendencies to commodify. Protections exist but they have to do with integration and distribution. DeepSeek built a model for $6 million that matches systems costing $100 million. Open source models now power 80% of startups seeking VC funding. The moat these companies are spending hundreds of billions to build is evaporating.
Apple understood this before anyone else. It didn't build its own AI model, it licensed Google's Gemini for about $1 billion a year. Why spend $100 billion building a factory when outsourcing costs a billion? And if a better model appears next year, Apple just switches vendors.
But Apple is not sitting still. It just dropped the M5 chip with a 16 core Neural Engine and Neural Accelerators built into every GPU core. It runs 70 billion parameter AI models locally, eventually even on your phone. The M5 delivers 4x the AI performance of the M4 and Apple doesn't need $200 billion in data centers.
Because Apple turned 2 billion devices into the data center. Every iPhone, Mac, iPad gets distributed AI at a scale no server farm can match. While its rivals burn cash, Apple is doing the opposite. $90.7 billion in stock buybacks last fiscal year. Its competitors? Combined buybacks collapsed 74% from their peak.
Apple didn't miss the AI revolution. It just bet that the winners won't be the ones who build the infrastructure. They'll be the ones who own the customer and no one else on Earth owns the best customers.
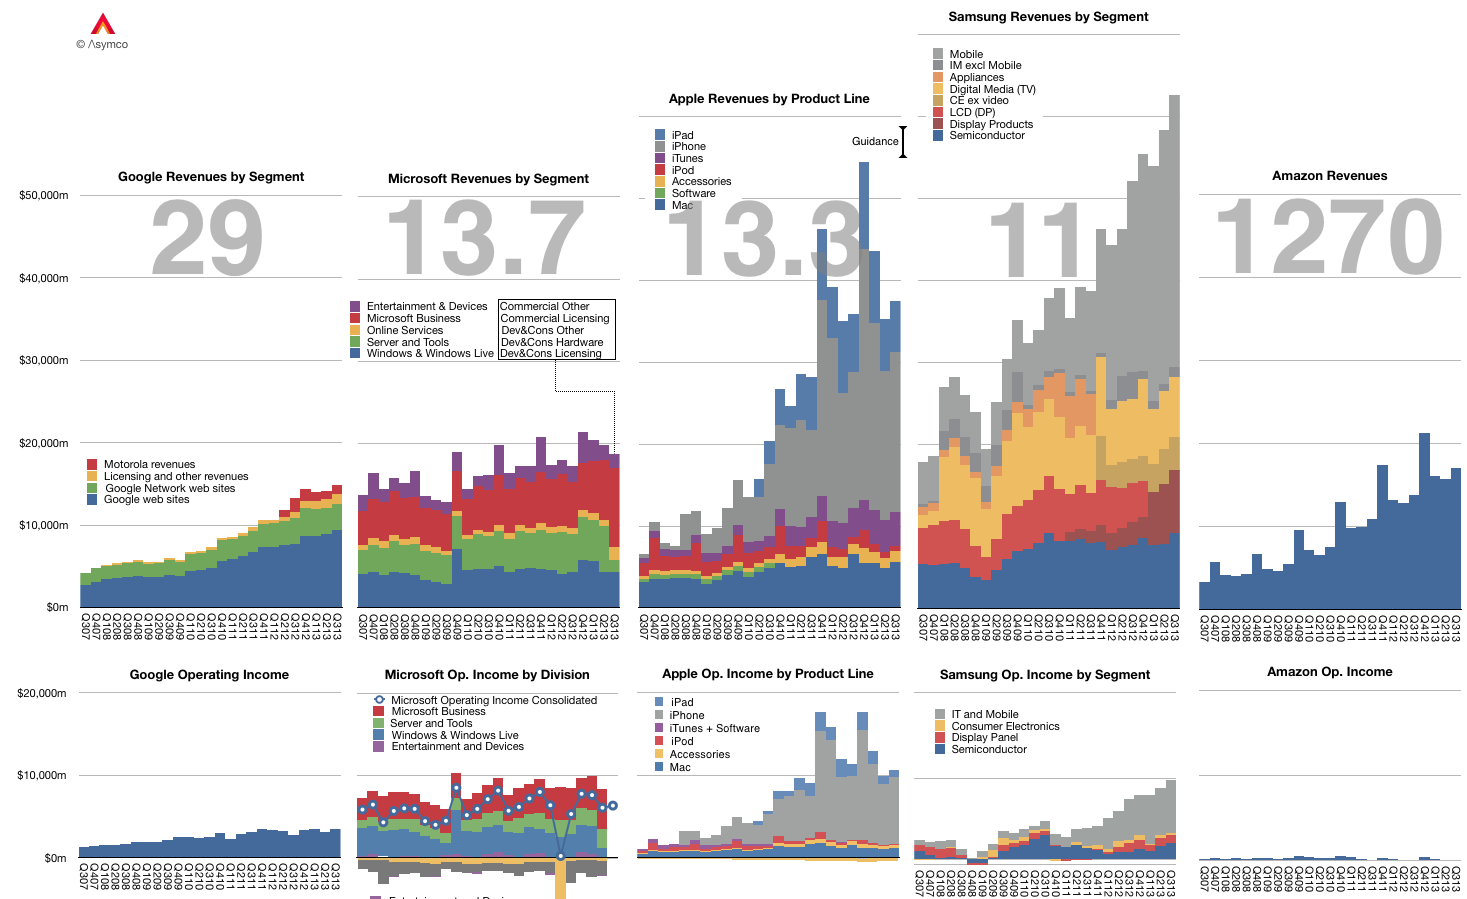
The graph below shows the Revenue and Operating Income for a select group of companies. The large numbers represent the share price to earnings (trailing twelve months) ratio (P/E or PE ratio).
Of course the P/E ratio hides a lot of subtlety. It mostly fails to account for the fact that earnings are largely a matter of opinion. A company can defer income (as Apple and Microsoft do), it can invest earnings (as Amazon does) and can otherwise avoid declaring it since it's taxable.
A better measure is the Enterprise Value to Free Cash Flow ratio (EV/FCF). It reflects a "harder" measure of performance in the form of free cash flow. It is not a matter of opinion but a fact. Enterprise Value also excludes cash which is a measure of past performance.
Nominally both P/E and EV/FCF measure the valuation of a company. They give what amounts to the number of years that current performance can be expected to last. For example a P/E or EV/FCF of 10 can be read as "If I purchase a share today, I should expect the company to pay me back in earnings in 10 years." Any earnings after 10 years are essentially "profit" for the investor.
Inverted these ratios are a measure of Yield or how much of the total investment is paid back in a given year. In the example above, the Yield would be 10% or "If I purchase a share today, the company will pay me back 10% a year in earnings."
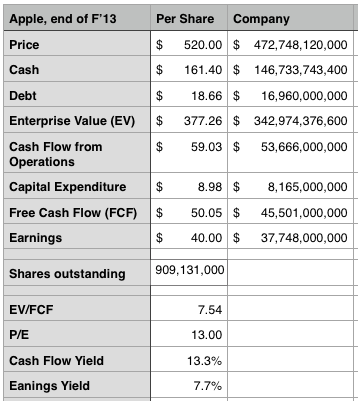
Relying on P/E is troublesome since, as mentioned above, it's deceptive. We get into difficulty when P/E and EV/FCF differ greatly. If a company has minimal cash and declares all free cash flow as earnings then the ratios are the same. However, consider how different these two ratios are for Apple:
The P/E ratio is 13 while the EV/FCF is 7.5. ((It would be very interesting to have both ratios available for all the companies in the graph above.))
This means the investment horizon is nearly half of what P/E suggests. (The cash flow yield should give pause). Put another way, the market suggests that Apple has 7 more years of current profitability and not 13. Note that the P/E ratio for the S&P 500 is above 19.
As Apple's deferrals are increasing investors should look again at what the company's worth. We had similar confusion when the company was deferring most of its iPhone revenue.
The end of June will mark the third anniversary of the market release of the iPhone. When it arrived in June 2007, anticipation for the product was significant with high consumer awareness and expectations--though the 10 million/yr. target for 2008 was met with skepticism by many.
The iPhone launched on June 29th 2007, with only a few days remaining in the quarter. 270k units were sold in that quarter and that was considered a solid start. When the company reported earnings a few weeks later (July 18th 2007) the company's stock price jumped to $140 a share.
As a sign of optimism in the company's prospects, the P/E ratio showed that the company was expected to reach 35% growth (35 P/E).
Was this optimism warranted?
A huge world-wide recession started only six months after the iPhone launched and, by some accounts, it is still lingering today. That meant the company faced decreasing consumer spending and constrained markets world-wide. The recession was expected to challenge Apple's premium positioning across all its product lines. The optimism from 2007 seemed exuberant. Where do we stand today?
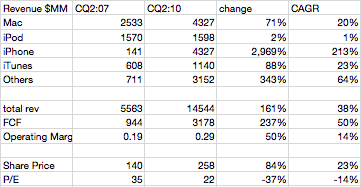
This table shows the actual values of the iPhone's 2007 launch quarter vs. the estimated values for Apple's income statement exactly three years later.
Free cash flow grew 237% or at a compounded 50%, significantly above the 35% that the P/E of 2007 would have suggested. The exuberance of 2007 turned out to be pessimism.
Although we don't know what the share price will be come July, as of today the share price has grown at less than half the rate of FCF growth: 84% or 23% compounded. As a result the P/E dropped from 35 to 22.
It's remarkable that growth expectations today are lower than they were at iPhone's birth even though the company outperformed those expectations through an unforeseen economic crisis.