Asymco

Asymmetric Intelligence

net income

  1. How to Measure WWDC

    Research · 2 comments

    How to measure helping others

    René Descartes, who published the phrase I think, therefore I am" in Discourse on the Method, in 1637

    Apple isn't measured by revenue or profit, at least not primarily. The measure is always satisfied customers. The application of services, software and computing hardware to improve lives has always been the modus vivendi and the resulting customer creation has always been the metric of success. Revenues and profits follow customer creation in a 1:1 relationship.

    WWDC seems to attract attention as a catharsis for product and strategy announcements but it was never intended to be this. It's about developers (the D in WWDC) and what matters to them: APIs, operating system updates, languages, SDK, and other tooling. It's also a chance to reveal the economic value proposition for those developers who are following their part of the $2 trillion ecosystem.

    And so the measure of WWDC should be how developers are created and satisfied. The products, which come later, are important but what matters more is developer opportunity, productivity and satisfaction.

    So here is what I'm looking forward to:

    • New developer opportunity with AI. This is via easier integrations, more choices perhaps in terms of back ends and possible hooks into different parts of the ecosystem. To wit: Swift extensions, *Kit extensions with hooks to smart home, exercise/fitness, accessibility.
    • New developer productivity tools: How is AI going to improve the toolchain for developers.
    • New developer business models: how agents can be built and integrated into privacy and safety that only Apple can guarantee.

    As Apple has shown with accessibility improvements (foreshadowing!), AI can be used to make people's lives better especially those who cannot perform due to disability. AI can lift those "below the median" in terms of many forms of ability: below median communications, below median health and below median mobility. Those with more limited ability can be "enhanced" into at least median ability. By definition, half of humans are below the median so helping them is as useful as helping those above the median.

    This is in contrast to the narrative that AI makes supermen. The opportunity is not mainly about taking over high ability tasks and forcing human effort to be displaced. it's much more about making the less able become more abled. (Characteristic of GenAI output is the "averageness" of it. For those of exceptional ability it feels worse/erroneous and irritates. For those of less ability it's empowering. AI pushes toward the median, both from below and above.)

    Below the median here does not necessarily mean below the median income or wealth. Ability is not always correlated with income. There are many Apple customers and potential Apple customers who can use help. I surely can use help in many areas of life.

    WWDC is about the scaffolding upon which these grand problems can be solved. Scaffolding is not pretty to look at and most look away in disappointment if that's all that is revealed. But no matter how well regarded, no great building has ever been built without scaffolding.
  2. The problem with the P/E ratio

    Research · 1 comment

    Why the most common measure for valuation is inadequate in an age of AI

    Software and services companies like Google, Microsoft, Amazon, Meta are spending on Capital Expenditures at the rate of heavy industry manufacturing. This defies their description as "asset light" business models which depend on services, distribution or platform economics.

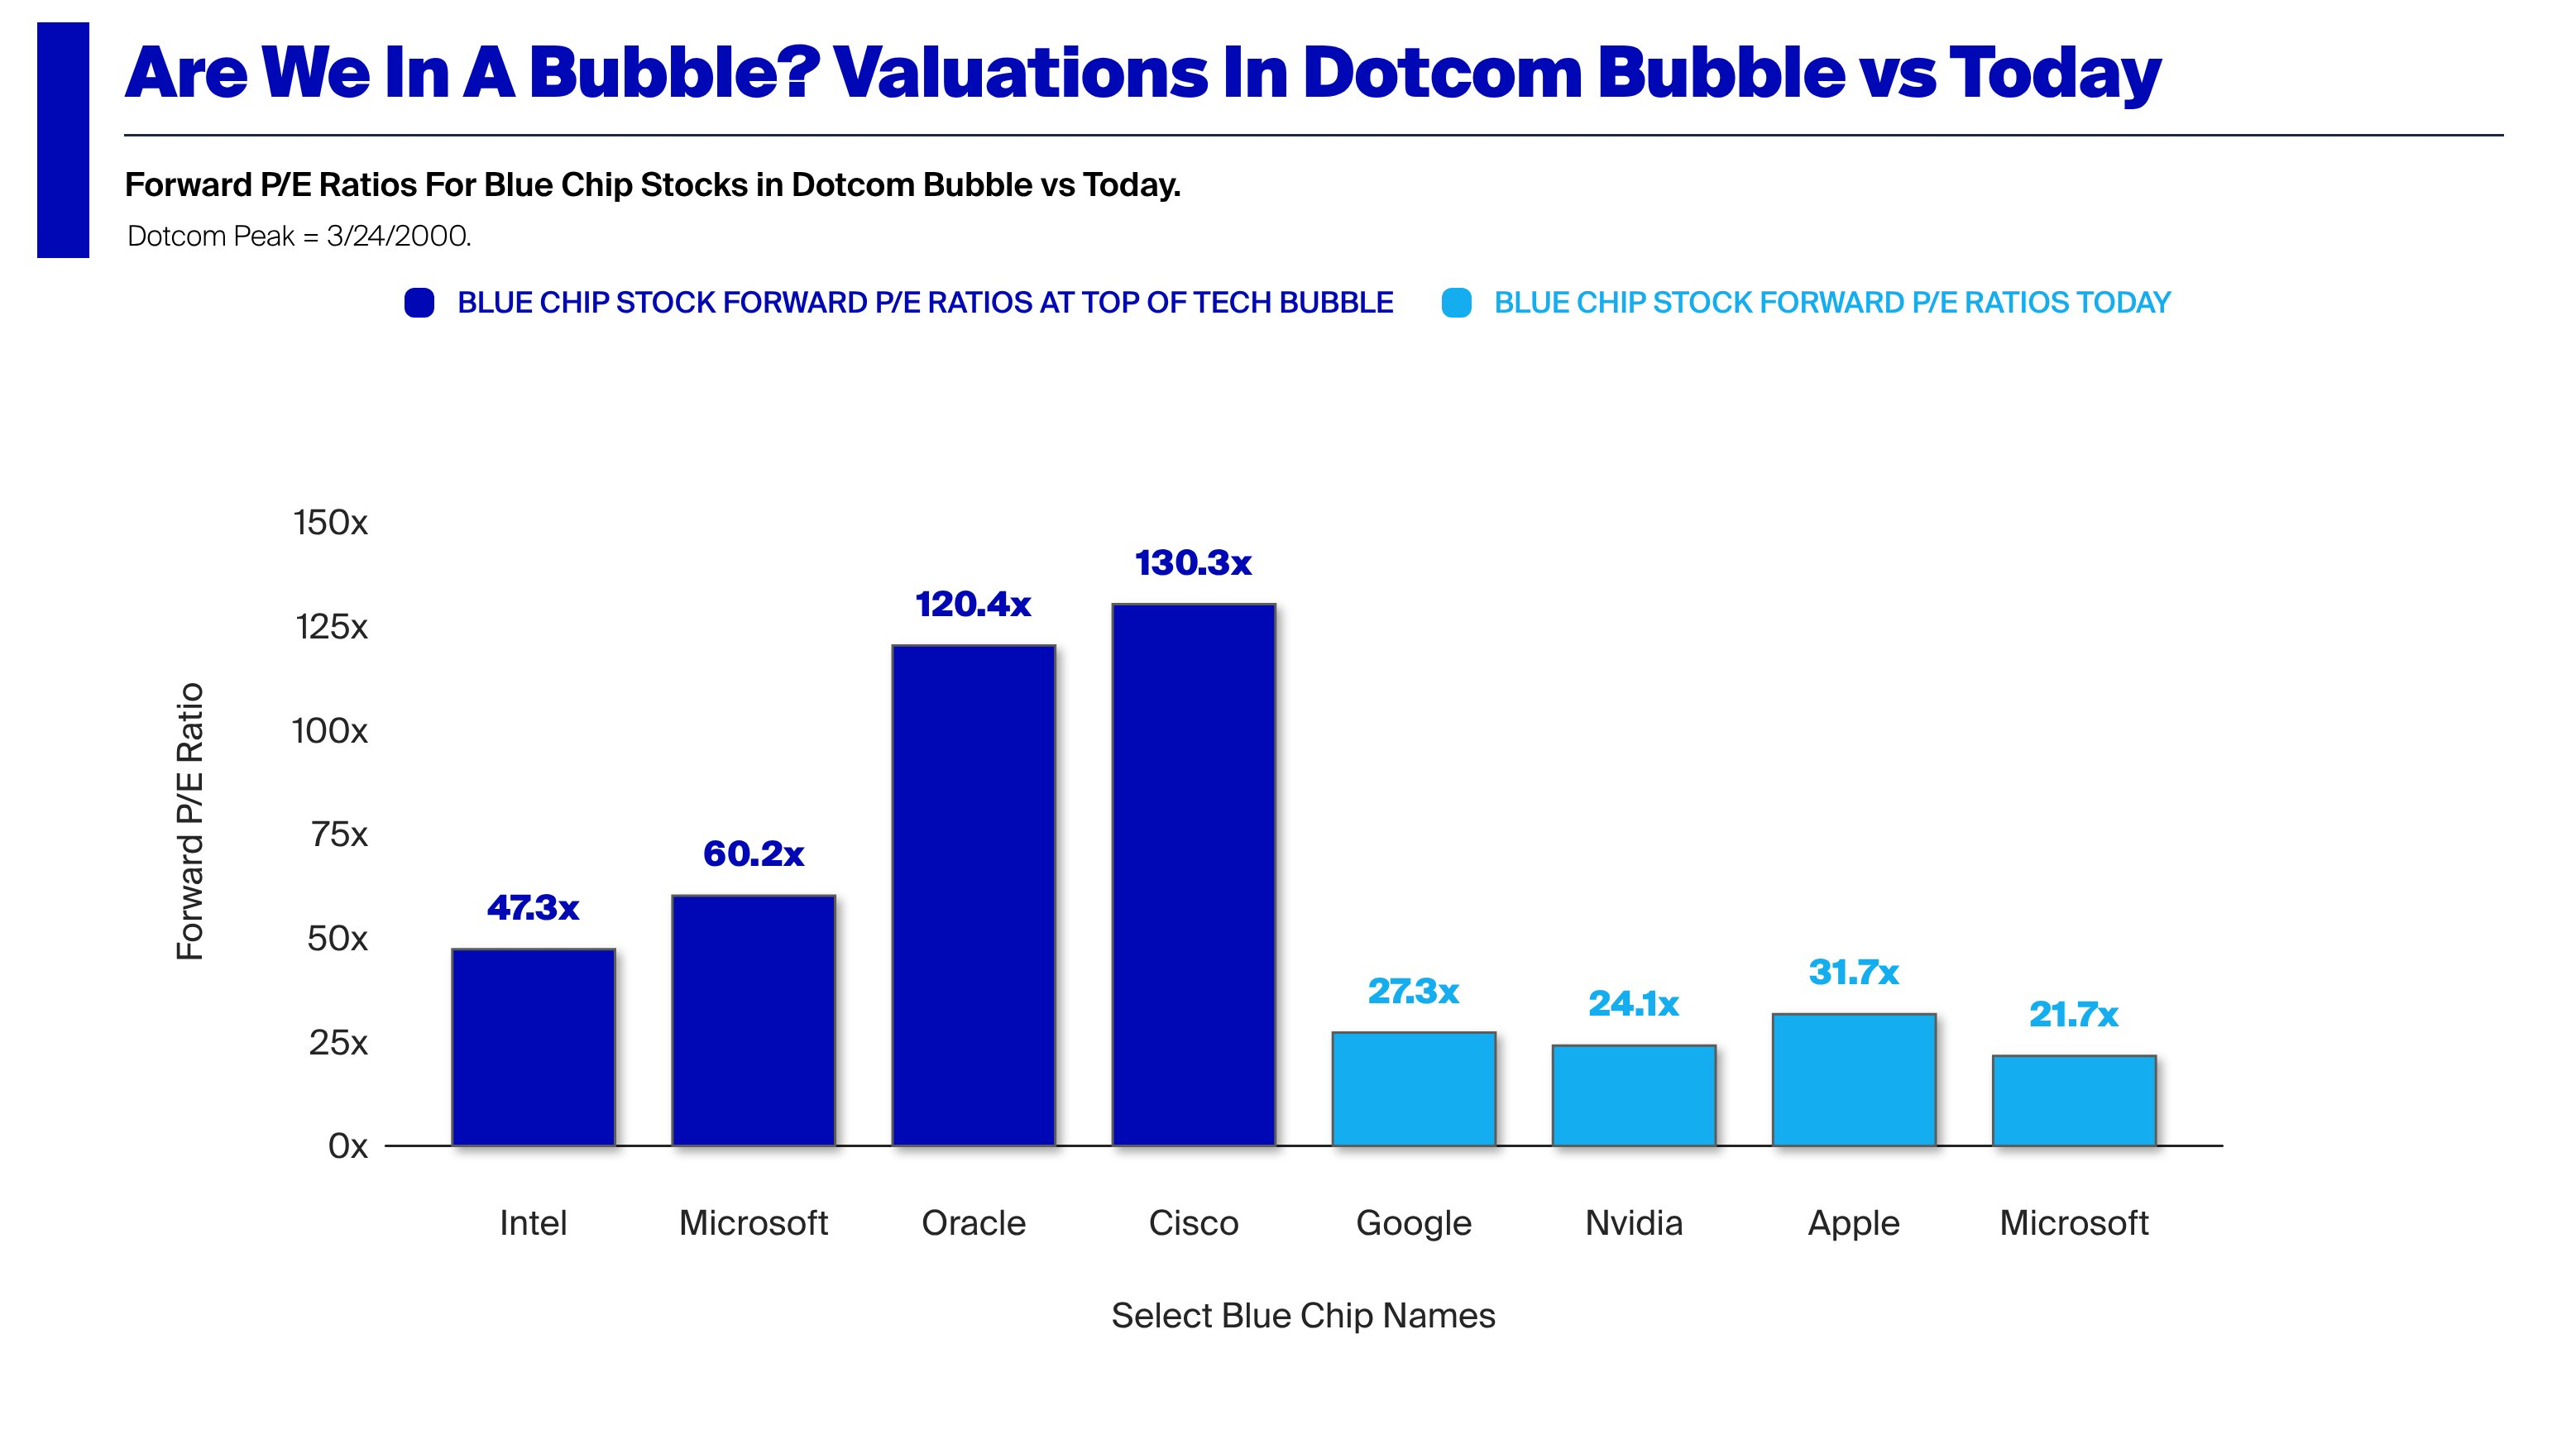
    The problem isn't just semantic. It is that for their entire existence, these companies were valued for their profitability and measured in terms of a P/E ratio and earnings growth. The situation has changed dramatically. Their revenues are up, the earnings are up and growth is up and share prices are way up. But not their P/E ratios. Why is this?

    Consider the graph below showing the (forward) P/E ratios of the Dot Com market leaders vs. the market leaders today.

    This even as share prices and value concentration have risen even faster than in the Dot Com era. Seen from the P/E basis, it does not look like we are in a bubble. Earning growth is way up so the share prices are not outrageous on that basis. That is contrary to 1999 when P/E ratios in the hundreds were considered normal. Expectations of an internet fueled boom were speculative. Expectation of an AI earnings boom seem well founded.

    But these companies could still be over-valued. The P/E ratio is not the full picture. It is in fact a simplifying shortcut which ignores significant pockets and omissions of value.

    For this analysis I'll use a sample including some of the largest market caps in the world with two exceptions. The exceptions are Lilly (LLY), Berkshire Hathaway (BRK-B) which are on the list but not in the top 10 (though in top 15) and Saudi Aramco and Broadcom which are in the top 10 but not on the list[1].

    CompanyMarket Cap
    NVDA$5,709,746,405,376
    AAPL$4,379,916,369,920
    GOOG$4,811,891,146,752
    MSFT$3,041,424,048,128
    AMZN$2,874,514,866,176
    TSM$2,166,463,135,744
    TSLA$1,664,912,326,656
    META$1,569,837,154,304
    BRK-B$1,044,046,610,432
    LLY$897,716,060,160

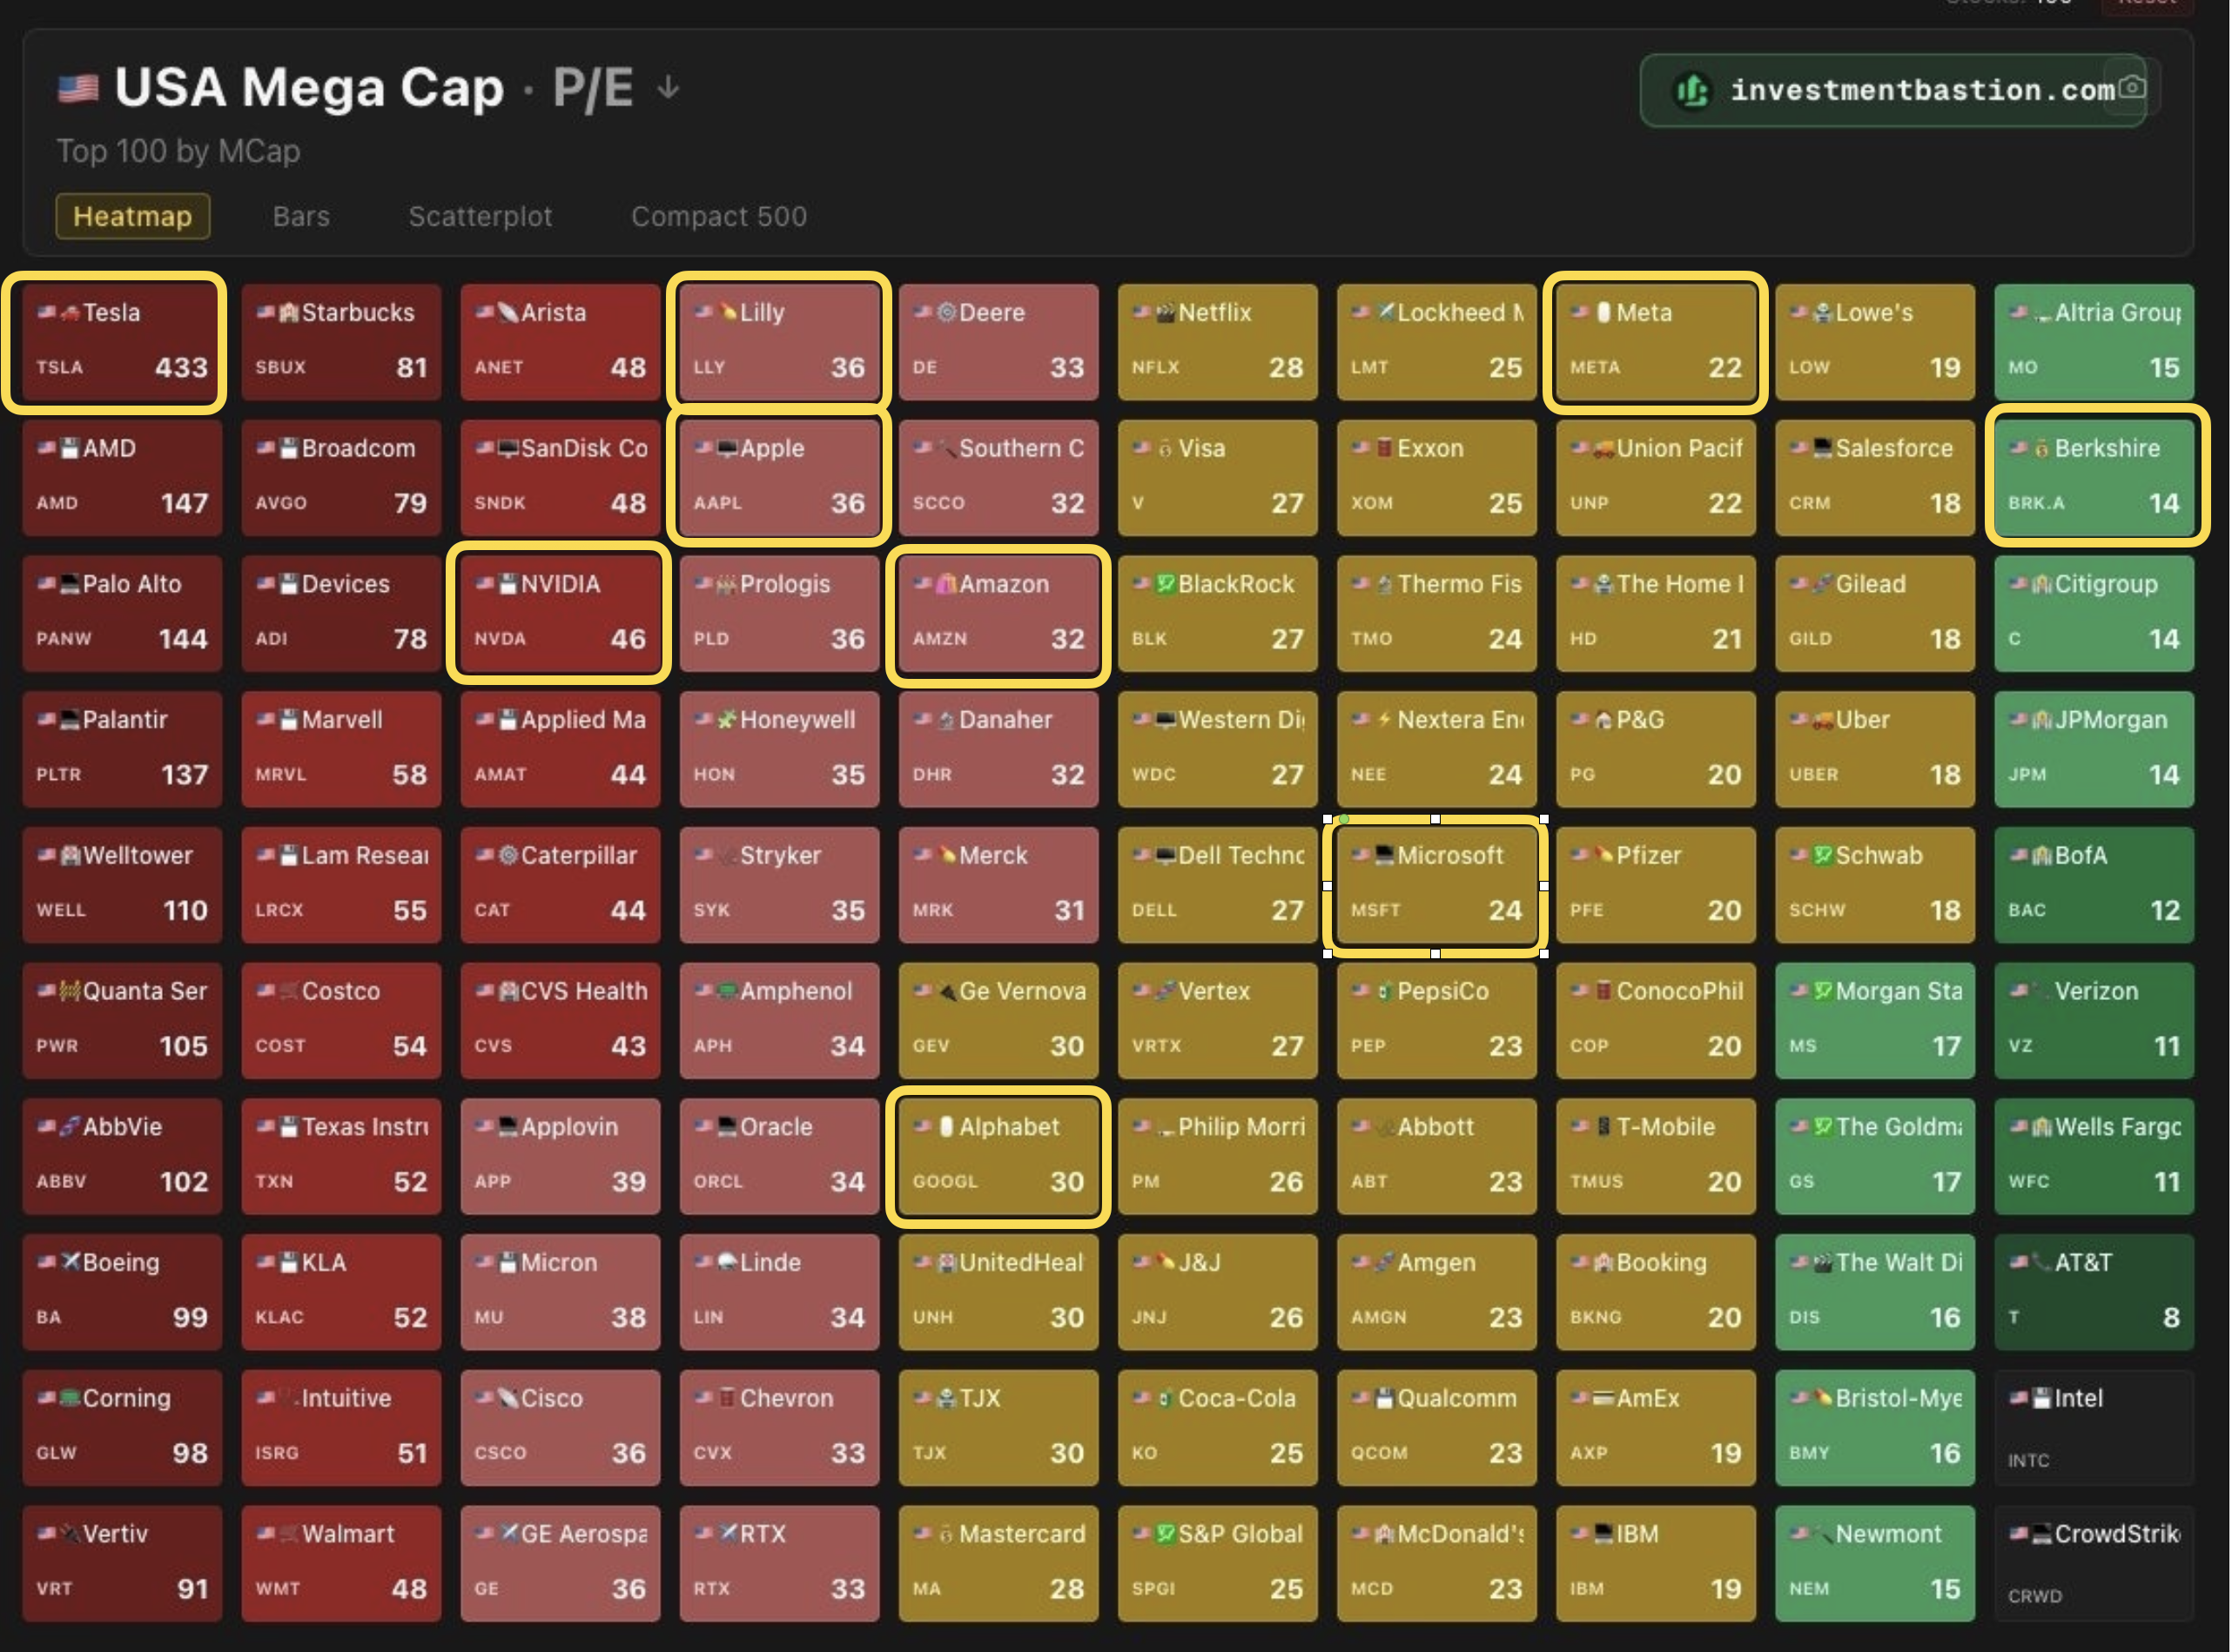
    The following diagram shows the P/E ratios of the sample relative to the top 100 US market caps[2]. Note that, with one exception, the companies are not in the dark red zone with above P/E of 60. The exception is, of course, Tesla, which, at P/E of 400+ is 14x the average multiple.

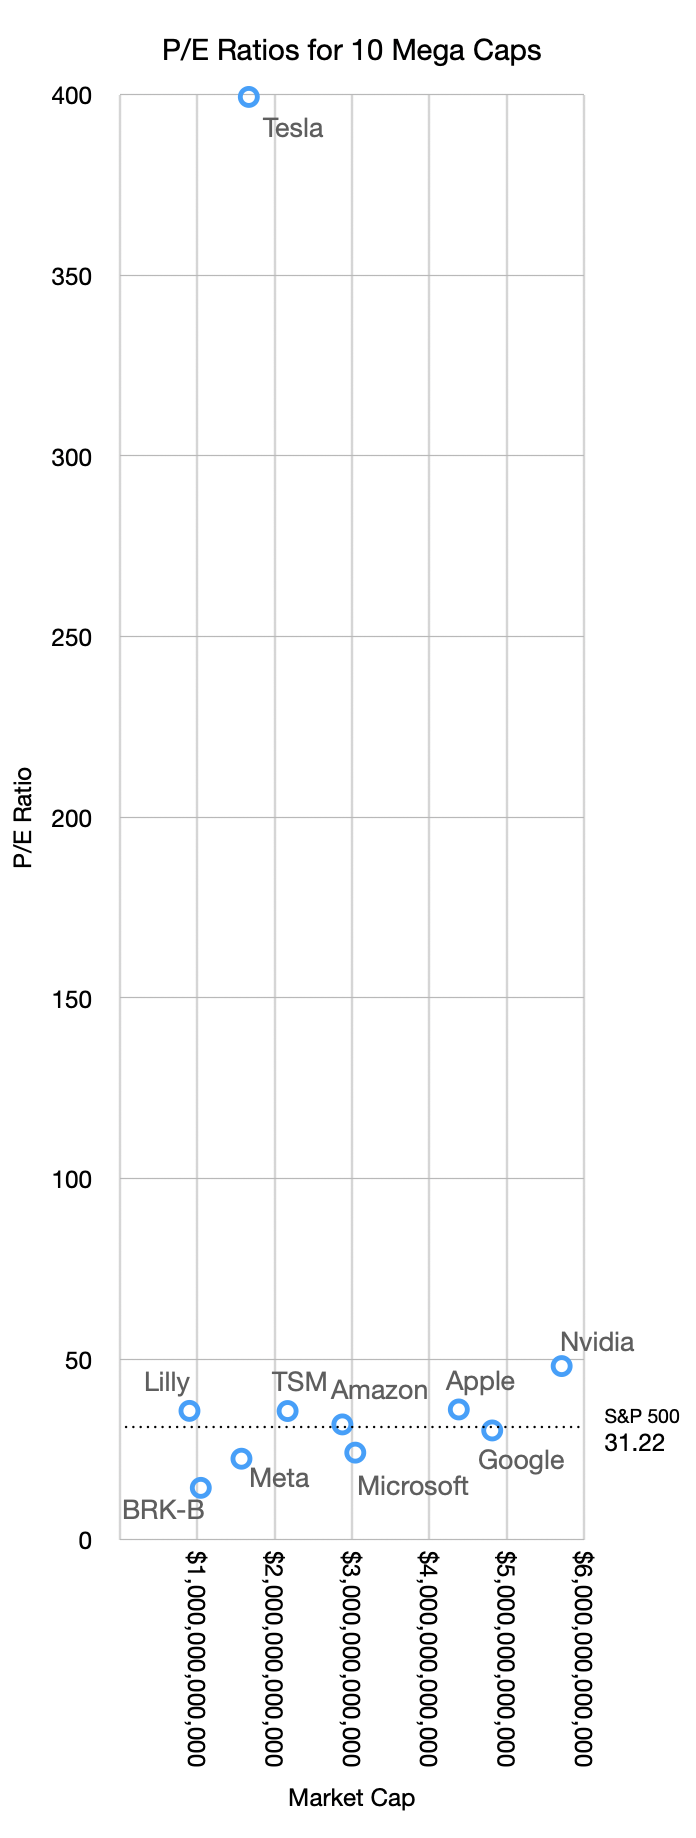
    Moreover, compared with the S&P 500, these P/E ratios are in-line with the median. The following graph shows the sample set with P/E ratio vs. Market Cap.

    Excluding the one anomaly the relationship seen is that higher market caps roughly correspond to higher P/Es. Nvidia has a market cap over $5.7 trillion with a P/E of 48 while Meta has a market cap of $1.5 trillion and a P/E of 22.5.

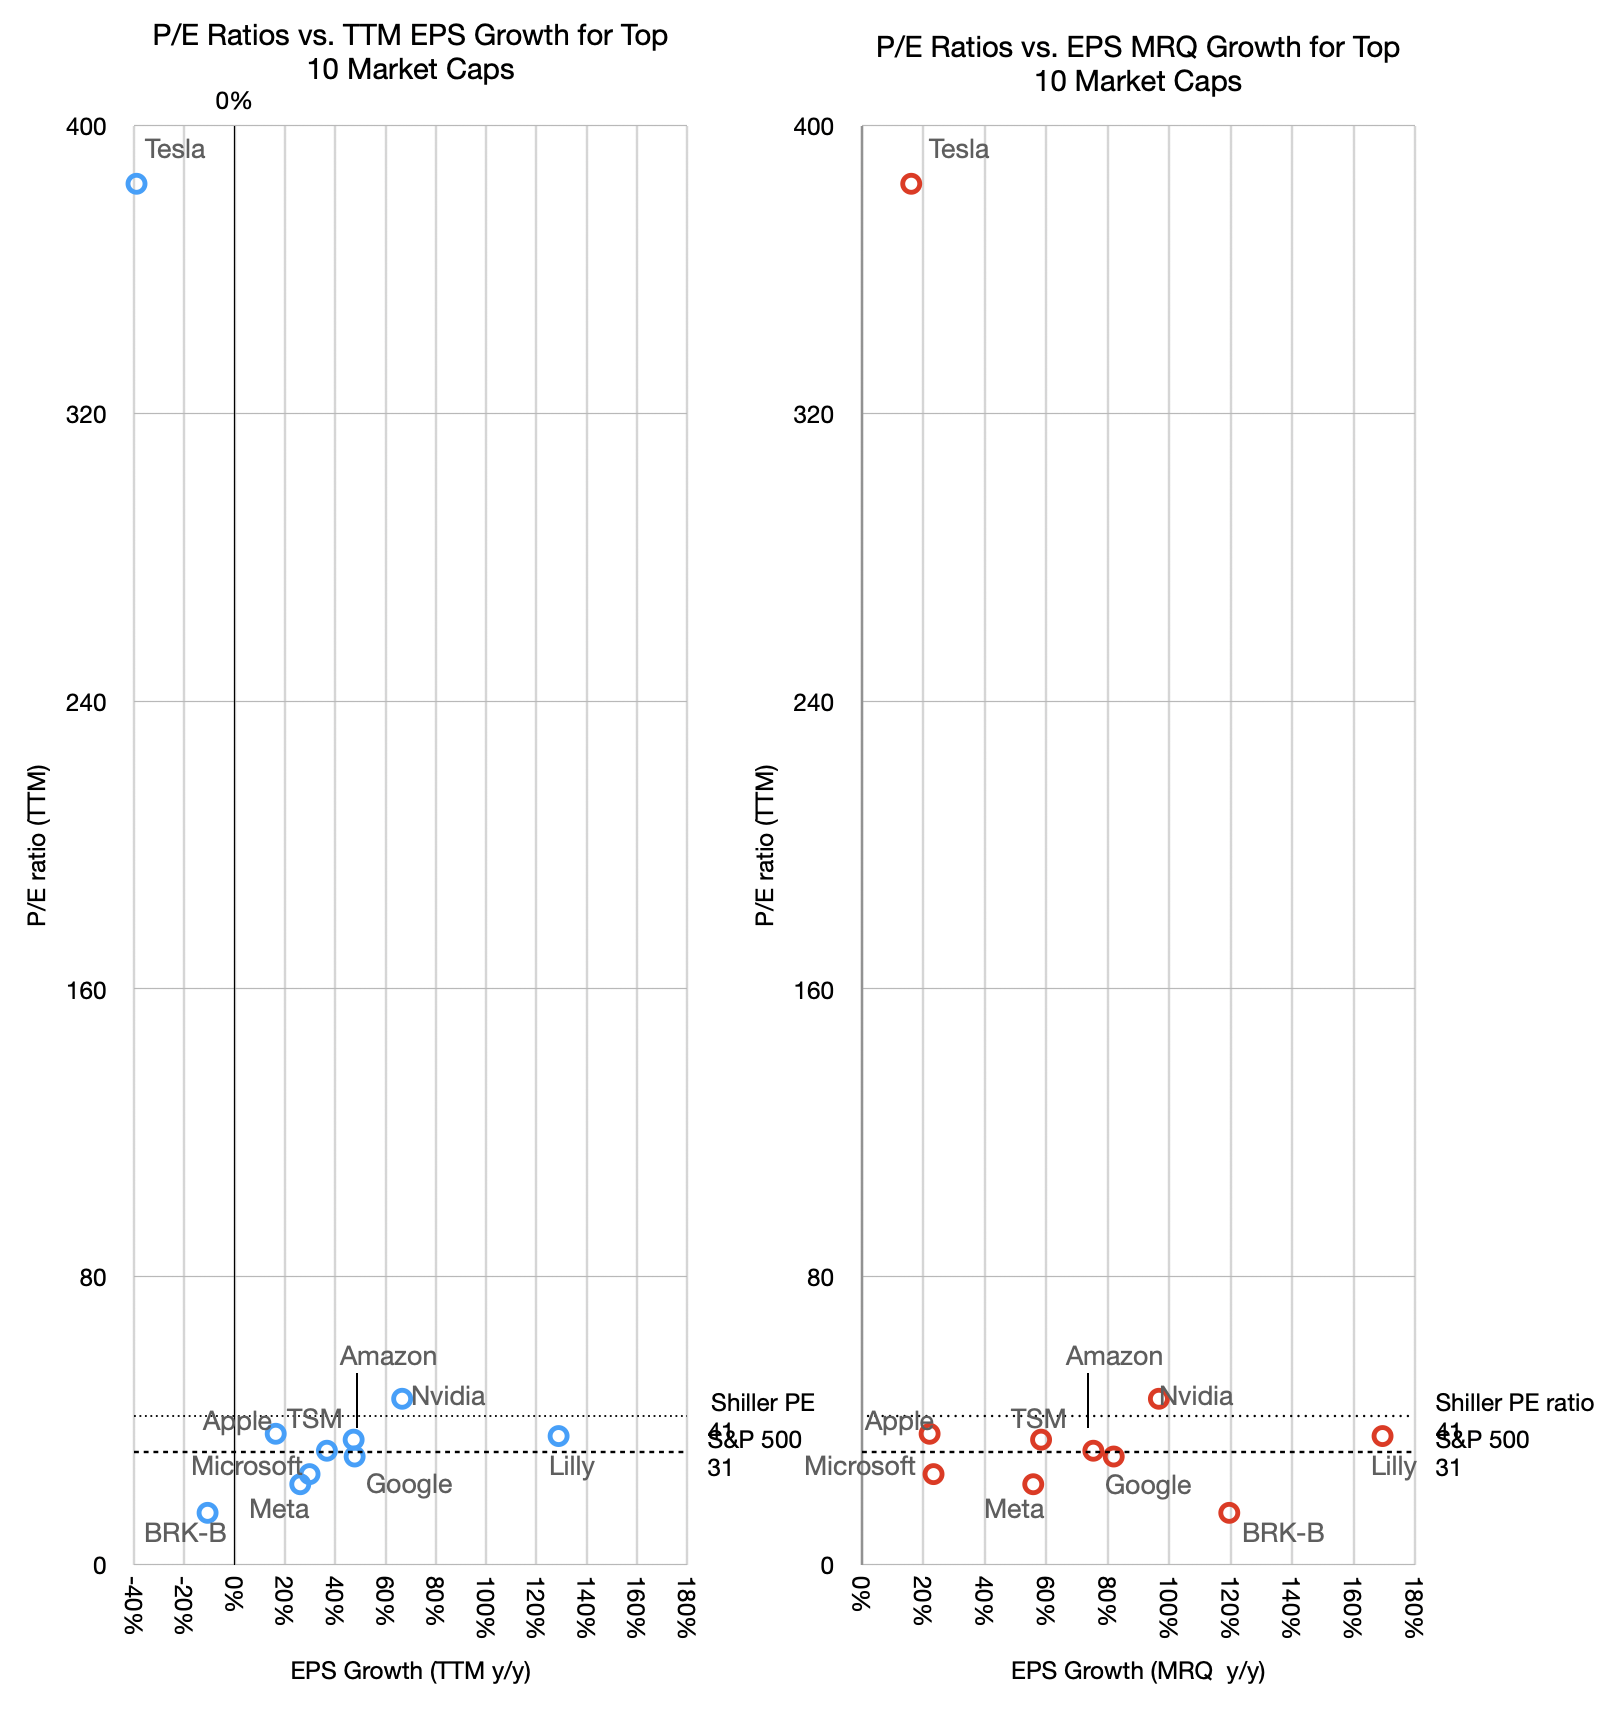
    Higher P/Es should also correspond to higher growth rates. The graph below shows the relationship between P/E and growth, both in the most recent quarter (MRQ) and trailing twelve months (TTM).

    There is a loose relationship between P/E and TTM growth but not with last quarter's growth. The one anomaly is even more prominent as it shows negative growth with exceptional valuation. Fundamentally however the relationship between P/E and growth is weak. Companies having widely divergent growth show similar P/E ratios. Alphabet for example has seen its P/E ratio in the 20s with growth in the 80s TTM and 50s MRQ.

    This might sound familiar. From 2008 to 2020 Apple was trading at a P/E ratio in the teens and low 20s while growing as fast as 80%. The logic was captured by my analogy of the goose that lays the golden eggs. Apple was able to create extraordinary products but the market considered such hits fleeting. It valued consistency over heroism. Getting on base vs. home runs. And so the P/E began to rise only once Services became more prominent. Regardless of how foreseeable this pattern was, it took a decade and is still ongoing for the pricing to catch up.

    But the situation with AI companies (that is, all the big tech companies but Apple) is that their earnings today are somewhat an illusion.

    An old maxim that says "earnings are an opinion while cash flow is a fact.[3]"

    This is because Net income can be manipulated by accounting abstractions, whereas cash flow is based on bank transactions.

    To wit: Net income (earnings) is calculated using accrual accounting, which relies heavily on judgment calls rather than bank balances. Companies recognize revenues the moment a contract is signed, even if the cash won't be collected for months. Or they can dial in a delay as they desire.

    Because of varying accounting policies, two identical companies with the exact same physical business can report vastly different earnings figures.

    Cash flow is objective and simply tracks the actual movement of money in and out of the business. Real dollars either enter the bank account or they don't. A company can look highly profitable on an income statement but still go bankrupt if its cash is trapped in unpaid invoices or unsold inventory.

    Finally, cash flow can be strongly negative while earnings are strongly positive. This is because investment in capital equipment does not appear in the income statement.

    Therefore true economic value is determined by the cash a company can actually distribute or reinvest rather than how it declares profitability based on accounting abstractions.

    AI companies are not necessarily hiding behind suspect earnings but their extraordinary capital expenditures are draining their cash and thus what investors have access to.

    Earnings seem to be soaring so the ratio P/E suggests a modest valuation. This is based on opinion or at least incompleteness.

    We should look at a better indicator. It's the EV/FCF ratio. We will look at this next.

    1. The top 10 ranking can change rapidly and it makes analysis difficult over longer time periods. The inclusion of LLY and BRK-B allow for visibility outside of the tech sector and they were in the list mid 2025. Saudi Aramco is in a completely different environment influenced by non-economic factors.
    2. TSMC is absent from the table as it is US only companies. It is notable perhaps that of the top 15, three are not US companies (TSMC, Samsung and Saudi Aramco). Furthermore the top Chinese company, Tencent is 25th, valued at $532 billion and the top European company is ASML at 21st and $610 billion.
    3. Attributed to economist Alfred Rappaport.
  3. Asymetric Episode 137 — E is Our Friend

    Asymetric Podcast

    Horace speaks carefully and with knowledge about opinions, facts and fantasies, and shares what he thinks John Ternus’s most important job is.

    Topics include:

    • Is a crash coming? 
    • The CapEx problem
    • AI and Apple
    • Convergence vs. fragmentation
    • Ternus and Apple's culture

    Now in Beta for asymco one subscribers

    Listen to Asymetric in your favorite podcast app.

  4. iPhone Share of US Big 3 Carriers reaches 75%, 77% with Verizon

    Nota Bene · 2 comments

    Android down 14.4%. Small players getting crushed.

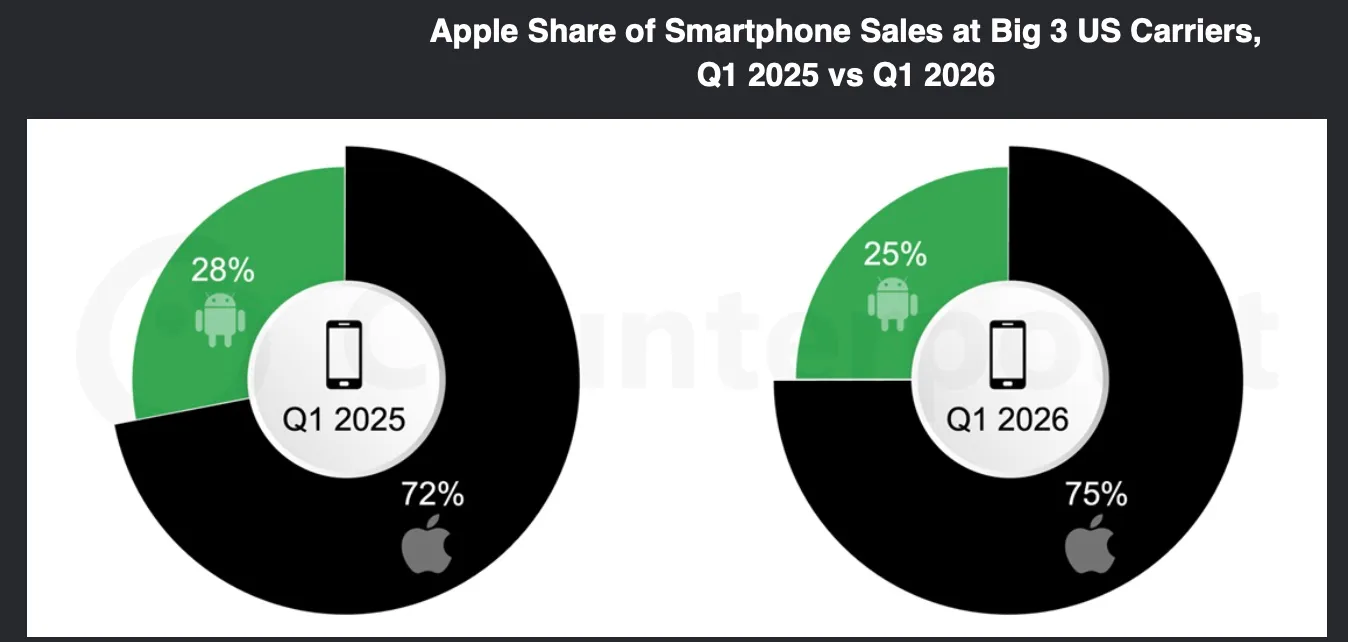
    Apple’s quarter one (Q1) 2026 iPhone sales volume in the US was up 1.3% year-over-year (YoY), outperforming the country’s overall smartphone market.

    That market declined 5.7% YoY, according to Counterpoint’s US Monthly Smartphone Channel Share Tracker. Apple’s share of volume grew by 4% YoY, as Android device sales declined 14.4% YoY.

    On the impact of the delayed launch,Graham said, “The premium smartphone space in the US is highly consolidated compared to some other markets, with Apple, Google, Samsung and, to some extent, Motorola comprising the vast majority of sales here. When one brand delays a flagship launch, it opens a window of opportunity to fill that vacuum. Apple did just that.”

    Apple grew its market share in each of the Big 3 US carriers. Its share grew the most at Verizon to 77% in Q1 2026.

    “If Apple can avoid significant price increases and continue to outpace its peers in promotional dollars, it will be tough for Android manufacturers to keep up in the year ahead, said Klaehne.

    Source: Counterpoint Research

    NB: What are the dynamics of the US market? The split between Apple and the rest of the market seems to be starker than ever. It's ask if there is a K shaped market emerging…

  5. Is a Crash Coming?

    Research · 7 comments

    A Series on Valuation in the age of AI

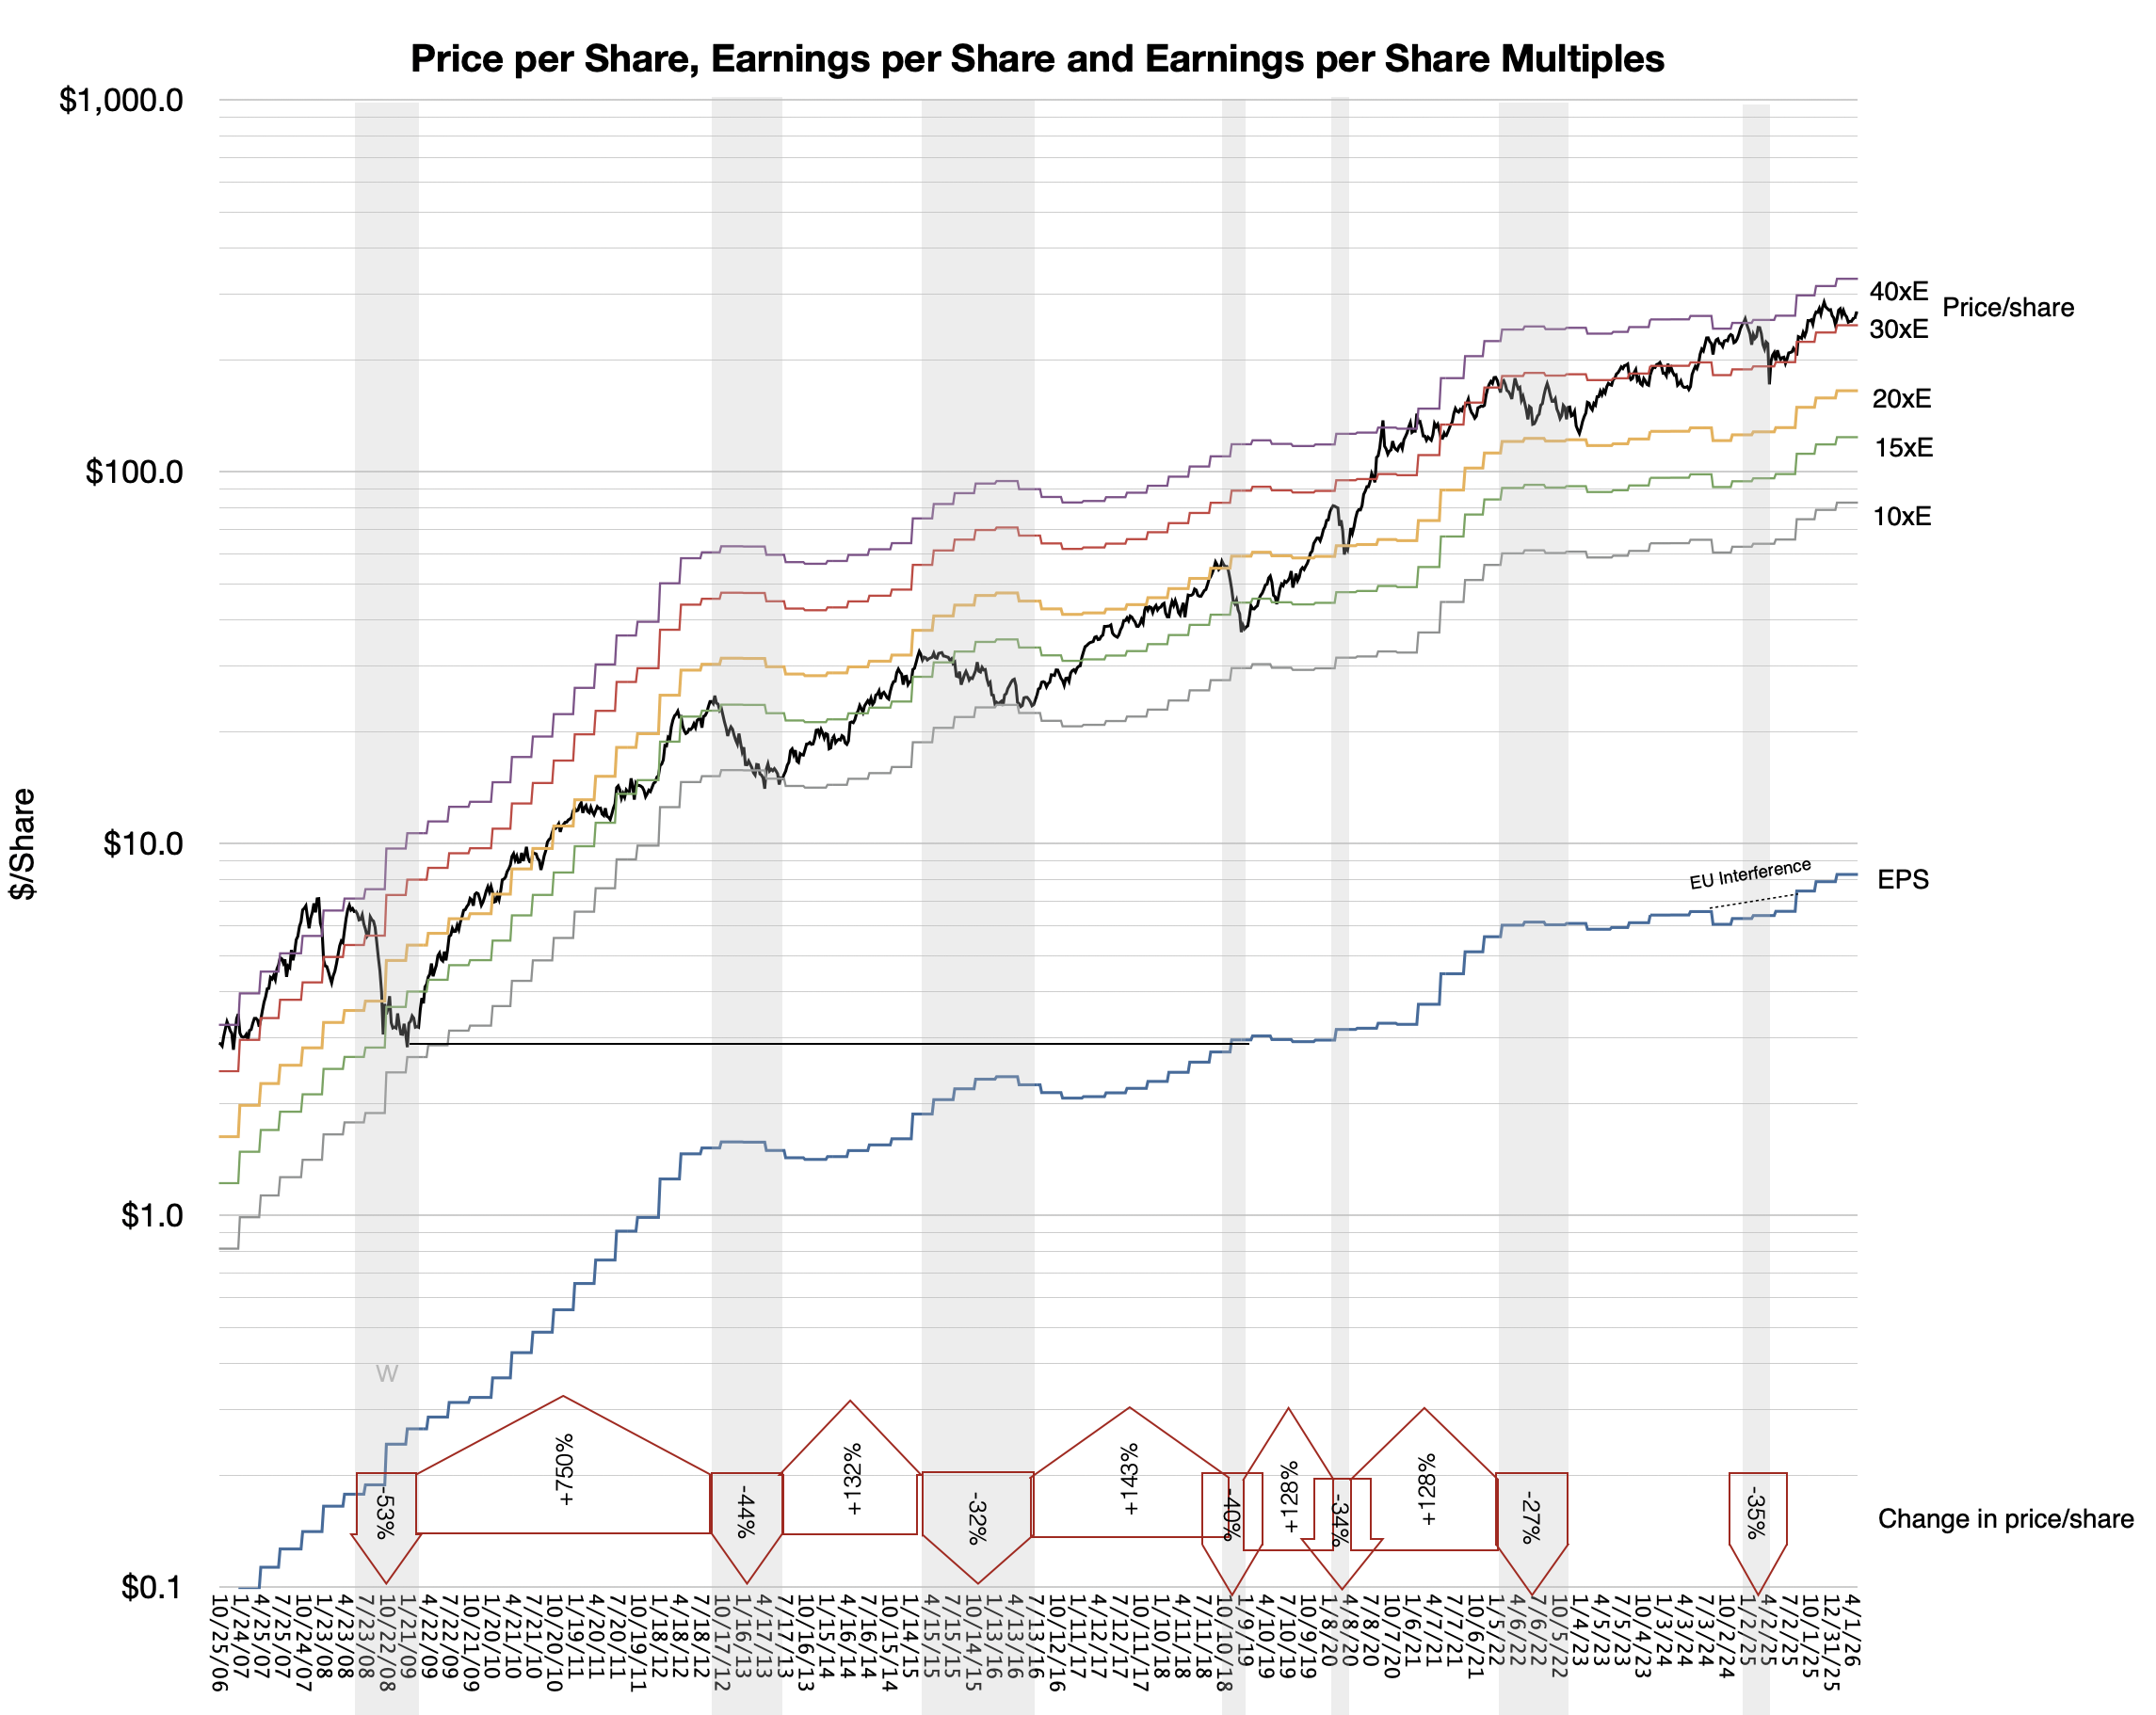
    Apple recently hit an all-time high. Today the stock is trading at a P/E of 35. The P/E ratio is the current share price P divided by the last four quarters’ net earnings per share E. But we also have a pretty good idea of the earnings for the next quarter, ending June (now almost half-way completed). The guidance very clearly suggests that on a one Quarter forward basis the P/E ratio is 34.

    I’ve maintained for at least 15 years that a reasonable multiple for Apple is 35. This was mainly because other large cap technology companies were also trading around that number. While at this ratio, if a company is growing at 22% it means that an investor will make their money back in about 10 years. Thereafter all free cash flows will go entirely to the investor’s pocket. That seems a reasonable return. It’s not a particularly risky bet to assume 20% growth for 10 years if you look at (a) history and (b) how many people in the world have not yet started using Apple products and (c) assess how well management is doing their job.

    So by this measure, Apple seems to be reasonably priced. Historically it has not been reasonably priced but that is due to the disconnect between understanding the business and falling for the usual false tropes. The following graph shows the share price and where it fell between the bands of Earnings multiples. The grey areas represent periods of significant share price decline.

    But much of the volatility of the stock is also due to overall sentiment collapse. That has happened on many occasions, most notably the 2008 financial crisis and “great recession.” (Another was the Covid crisis.) In these cases, regardless of underlying strength, the shares were available very cheaply.

    Today perhaps we should ask if a bubble is forming due to exuberance around AI which is inflating the market in unsustainable ways.

    There are four reasons why the current asset value explosion is different.

    First, it is highly concentrated in a handful of names.

    2005 S&P 500 top 10% of the S&P index2026 S&P 500 top 10% of the S&P index
    Exxon3.1%NVDA7.8%
    MSFT2.5%GOOG7.3%
    Citigroup2.2%AAPL6.4%
    GE2.0%MSFT4.6%
    Walmart1.7%AMZN4.4%
    BoA1.6%Broadcom3.0%
    J&J1.6%TSLA2.4%
    Pfizer1.4%META2.3%
    Intel1.3%Walmart1.6%
    AIG1.3%Berkshire Hathaway1.5%
    Total18.7%41.3%

    Second it is fueled by equity not debt. Third, it involves disproportionate capital expenditure rather than M&A. Fourth it is accompanies by sharply growing revenues (though not as sharp as investment growth.)

    In other words, whereas the equity value is growing rapidly, so is income and investment without leverage. This is a low-debt with high income scenario. Previous crises were high income with high debt (2008) or low income with low debt. (Dot Com).

    That’s not to say that we have uniform fair equity values. We need to do quite a bit more due diligence to determine the state of the valuations precisely because we have unusual capital allocation strategies.

    To cover this topic I’ll will break the analysis into multiple posts. They are:

    • Why the most common metrics for valuation are insufficient — the problem with the P/E ratio
    • What are the alternatives that into consideration exceptional cash and capital expenditures — The EV/FCF ratio
    • How does the P/E ratio differ from EV/FCF and what does it mean if they diverge one way or another
    • How do the Mag 7 et. al. appear on these Metrics
    • How to complement snapshots like valuation ratios with the time series of fundamentals
    • Why payback measures are the ultimate measure of valuation
    • What are the current payback measures for the Mag 7 et.al.
    • Compare Apple to its peer group
    • Finally assess whether a collapse in confidence is imminent

    Please return to these pages in the next few days to read these posts.

  6. John Ternus has left big shoes to fill

    Research · 4 comments

    April 21, 2040

    It's been 15 years but John Ternus has finally stepped down as Apple CEO. Analysts described the transition as expected rather than disruptive, noting that investors had long anticipated Ternus' eventual departure. Nevertheless, he leaves with many questions still unanswered about Apple's long term strategy. Apple incoming CEO faces a defining challenge: Fixing the company’s Services dependence.

    It's been a tumultuous tenure for Ternus but he is leaving with significant accomplishments:

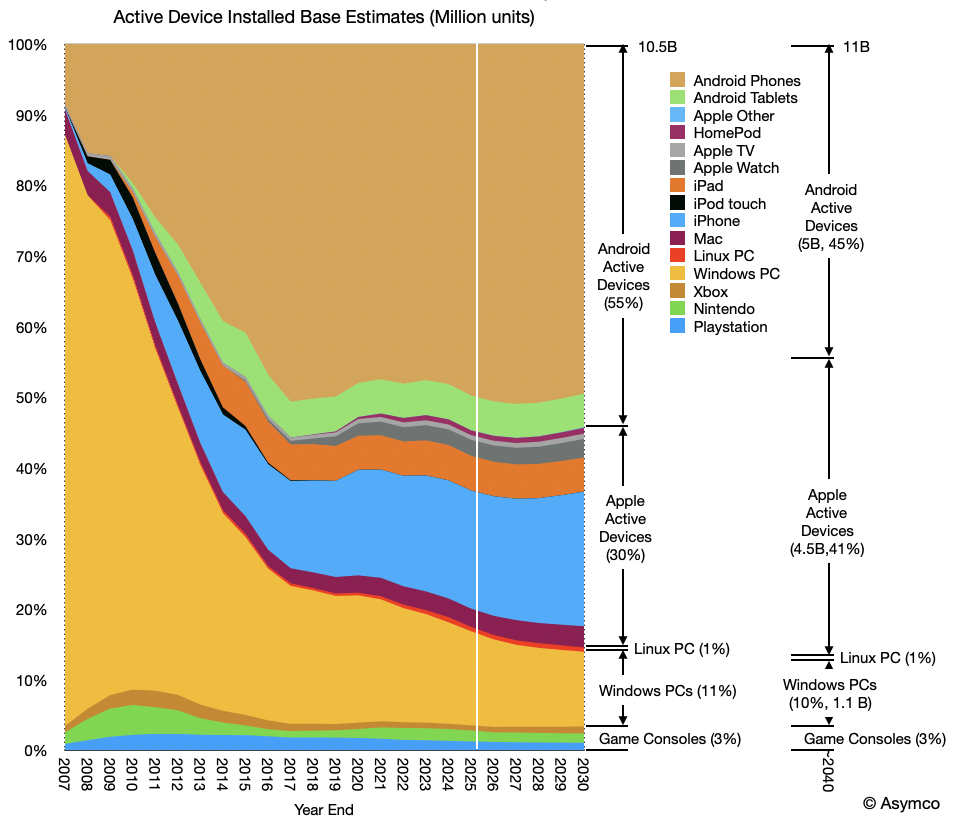
    • John grew Apple devices to 4.5 billion from 2.5 billion when he took over in 2026. Many have pointed out that he has been building on Tim Cook's success and that John has only added 2 billion devices in 15 years, averaging 110 million per year. The reality is that most of those have been switchers from Android rather than first-time users. Because of this, Android's 5 billion active devices means Android users still outnumber Apple users. Apple's users do have attach rates of over 2.5 devices per user including passive AI wearables but the competition is not standing still. The new CEO will face the challenge of trying to wrest majority market share in a saturated 12 billion active device market.
    • With over 2 billion customers, Apple is capturing over 40% of all AI revenues. Critics point out that the company has not grown beyond its core: high net worth and high income households. Much of that foundation was laid by his predecessor and arguably all that John has done is maintain a base that grew organically as global income has risen. Over a billion middle/high income individuals have joined the world economy as Apple users but that is hardly attributable to Ternus. His engineering acumen did not give him the insight into marketing to low income countries where most of the users are shunning Apple products.
    • John has had to navigate a challenging geopolitical situation with the rise of India as the world power and the decline of China. Critics pointed out that Apple's dependence on India is an Achilles' heel and that his transition of production and market growth from China to India has been rough and challenges remain with regulation and labor unrest. The Indian middle class has been the growth engine for a decade but, as all eyes are on Africa and South America, Apple has been on its back foot.
    • Apple grew the AI business but now depends too much on in. Growth since 2038 has slowed from mid teens to low teens and analysts are pointing out that Apple is too dependent on Services as its biggest source of revenue. Apple's P/E ratio is now below the average of the Fab Five reflecting investor skepticism that it can capitalize on submersible data centers in international waters. Its insistence on local sovereignty for data storage goes against the bathospheric consensus.
    • Competition has been kept at bay, so far. Apple has seen off challenges by Anthropic, Netflix and SpaceX but there are hundreds of startups looking to build the next Services killer. Billions of satisfied customers are not the moat they used to be.

    Apple has made it this far, recently celebrating its 65 anniversary but there is no guarantee that it can continue its run as the world's most valuable company. The next CEO has to steer the ship Ternus just managed to helm through stormy seas.

  7. Asymco Bulletin 009 - Apr 19, 2026

    Bulletin

    Asymco Bulletin is a digest of all the work we have published for the week ending Apr 19, 2026.

    Research

    Estimates for Apple’s March Quarter 2026

    Estimates for Apple’s March Quarter 2026

    Revenues and growth rates for iPhone, Mac, iPad, Services, Wearables, plus Net Sales, Gross Margin, Operating Expense, Other Income and Expense, Tax Rate, Net Income, Share Count and EPS with a comparison to CFO guidance.

    Ref. conference call's guidance, Kevan Parekh, Apple CFO: As we move ahead into March, I would like to review our outlook, […]. We expect our March total company revenue to grow by 13% to 16% year over year, which comprehends our best estimates of constrained iPhone supply during the quarter. We expect services revenue to grow at a year-over-year rate similar to what we reported in December. We expect →

    The Inevitability of Combining the Digital and Physical Worlds

    The Inevitability of Combining the Digital and Physical Worlds

    In a recent interview Apple management was asked about AI, which is perceived as an area where Apple has been struggling. Greg Joswiak replied: We’ve been doing things with intelligence for many years, right? And gen AI allows us an opportunity to do that even more. So I’m excited about that, but boy, this is not a sprint. This is a marathon.

    In contrast to AI, Spatial Computing is being largely ignored. It is however making significant leaps in utilization, especially in verticals. →


    Nota Bene

    Monday Notes: Neo still sinking in

    Monday Notes: Neo still sinking in →

    Apple's potential to double its Mac user base through strategic budget expansion and memory supply tactics presents a promising growth trajectory.

    260 million Mac users? Huge room for growth.

    Two analysts, two stories. The Neo will move the needle and the supply crunch will hamper competition…

    Nevertheless, a doubling of the Mac user base is certainly a worthy and achievable goal over the next decade. →

    Apple Studio Display XDR Now Cleared for Diagnostic Radiology

    Apple Studio Display XDR Now Cleared for Diagnostic Radiology →

    At just $3,000, the Studio Display XDR democratizes medical imaging, undercutting specialized monitors by up to 90% and revolutionizing healthcare accessibility.

    The ‌Studio Display‌ XDR is priced at $2,899 with a VESA mount, and it is more affordable than many specialized medical imaging monitors.

    It allows a new set of people to do what previously required only specialists to do and allows specialists to do more than they used to do. →

    Antelope standing beside a wooden desk with a vintage Macintosh computer

    All of a sudden, everyone is doomed except Apple →

    Despite optimistic predictions for Mac growth, persistent skepticism argues Apple faces inevitable doom due to supply issues and product flaws.

    As honored as I am to be the recipient of an antlers tip, I must respectfully disagree…

    The only thing you could be sure of is that Apple is doomed. →

    Computer History Museum interviews Bertrand Serlet

    Computer History Museum interviews Bertrand Serlet →

    Bertrand Serlet, a pivotal yet understated architect behind Apple's OS X, exemplifies the profound impact of tech's quiet innovators.

    Pay attention to the quiet ones

    This is one in a series on Apple’s quieter heroes.…

    That this interview only has 6000 views after three years shows how much untold history exists. →

    Bank of America raises Apple price target to $325 from $320 →

    BofA slightly ups Apple's price target to $325, forecasting $113B revenue and $2.00 EPS for Q2, driven by strong iPhone sales and Services growth, slightly above my estimates of $110B and $2.00.

    Q2 forecast update

    My own estimates for Q2 revenues and EPS are $110B…

    More to follow as we get closer to the earnings release date but this is a good preview. →

    Omdia releases first estimate for Q1 PC unit shipments →

    Apple's Mac shipments grew 5.4% to capture 11% market share in Q1 2026, driven by MacBook Air and Neo sales, with revenue estimates slightly differing from unit projections.

    Apple growing at double market rate.

    Omidia estimates that Apple reached a market shar…

    …e of 11% with shipments growing 5.4% due to solid MacBook Air sales performance and the initial sell-in of the MacBook Neo.. This means 5.4% growth for Apple y/y. As I noted in my Office Hour yesterday, I adjusted my Mac growth from 0% to 6% based on the new products launched. This is an estimate of revenues not units but it might be pretty close. Omidia estimates 7,112 million units whereas I’m a little above 6 million. We seem to disagree on ASP. →

    Apple and Amazon Partner on Satellite Deal

    Apple and Amazon Partner on Satellite Deal →

    Amazon's acquisition of Globalstar boosts its satellite internet ambitions and strengthens ties with Apple, while highlighting the limited reach of space-based networks compared to terrestrial ones.

    I assume Apple has wanted to steer clear of Starlink but it’s not clear that was a primary consideration in choosing Globalstar.

    Starlink, considered the dominant player, serves about 11 million users. I would note that 11 million is 0.1% of the number of cellular subscriptions worldwide. →

    iPhone vs Android Switching Rates →

    iPhone users boast nearly quadruple the loyalty of Android counterparts, with actual annual switching rates favoring Apple slightly, despite inflated survey intentions.

    I did a deep dive into the data and came up with graph above. The original report shows intention numbers which seem quite high. For instance, the net switching rate between iOS and Android is 10% in favor of Apple. This would imply that the entire user base would flip in 10 years. It would also imply…

    I think actual net churn is 1.7% of the base each year. That’s still 100 million a year. For now it seems Apple is happy to maintain that rate. →


    Office Hours

    Asymco One Office Hours Live Q&A with Horace Dediu & Gene Munster: April 8, 2026

    Asymco One Office Hours Live Q&A with Horace Dediu & Gene Munster: April 8, 2026 →

    Asymco Office Hours, April 8, 2026

    Hosts: Horace Dediu and Gene Munster

    This episode of Asymco Office Hours covers a wide range of topics related to Apple, including geopolitical risks, financial performance, AI developments, and business strategy. The discussion is led by Horace Dediu and Gene Munster, with insights from industry experts.


    Podcast

    Asymetric Podcast: Waterloo

    Asymetric Podcast: Waterloo →

    In this Asymmetric Podcast episode, Horace muses on buying flowers, highlights Apple's distinguishing product, and teases his new research. →


    Asymco One gives you full access to our research, analysis, and commentary. Subscribe with code BULLETIN for a discount.

    Feedback: Have questions or comments? Reach out to us at contact@asymco.com. We’d love to hear from you.

  8. Estimates for Apple's March Quarter 2026

    Research · 2 comments

    Revenues and growth rates for iPhone, Mac, iPad, Services, Wearables, plus Net Sales, Gross Margin, Operating Expense, Other Income and Expense, Tax Rate, Net Income, Share Count and EPS with a comparison to CFO guidance.

    Kevan Parekh, Apple CFO: As we move ahead into March, I would like to review our outlook, […]. We expect our March total company revenue to grow by 13% to 16% year over year, which comprehends our best estimates of constrained iPhone supply during the quarter.

    We expect services revenue to grow at a year-over-year rate similar to what we reported in December. We expect gross margin to be between 48-49%. We expect operating expenses to be between $18.4 billion and $18.7 billion, which is at a similar level to what we reported in December and driven by higher R&D on a year-over-year basis. We expect OI&E to be around $100 million, excluding any potential impact from the mark-to-market of minority investments, and our tax rate to be around 17.5%.

    I've seen several market reports which estimate that iPhone shipments grew around 3% to 6% in the quarter. When I plug in, say, IDC's iPhones number into my model, and assume quite aggressive growth on the other categories (including Services) I get a y/y revenue growth of 11%. This is far below Kevan's January's guidance quoted above (13% to 16%).

    Are IDC, Gartner, et. al. signaling a huge miss?

    I need to point out that in the preceding December quarter the iPhone grew revenues at 23%! In order for Apple to hit its targets

    I'd also point out that when Kevan Parekh made his forecast, in late January, a full month was already on the books for Apple. Visibility into the next month would have been relatively good as orders from the channel are partly foreseeable. For a change from implying nearly 20% growth in sales/14% in units one third of the way in, to IDC's 3% in units for the whole quarter would imply a collapse in demand into February and March. We're talking double digit decline in order volumes.

    Moreover, IDC commentary on Apple is

    Apple secured second place, driven by the strong performance of the iPhone 17 series, which saw significant growth in China of over 30%. This led to a 3.3% year-over-year increase in global sales for Q1. Although demand remains robust, supply disruptions and a reduction in channel support in some key markets have hindered growth..

    30% growth in China! For this to be tied to 3.3% growth globally would imply significant declines elsewhere. I struggle to see how this adds up.

    Here is my complete forecast for the quarter including growth rate for revenues for iPhone, Mac, iPad, Services, Wearables, Net Sales, Gross Margin, Operating Exp., OIE, Tax Rate, Net Income, Share Count and EPS with a comparison to CFO guidance.

  9. Apple Services in Europe: Scale and Growth

    Research · 7 comments

    Apple offers an answer.

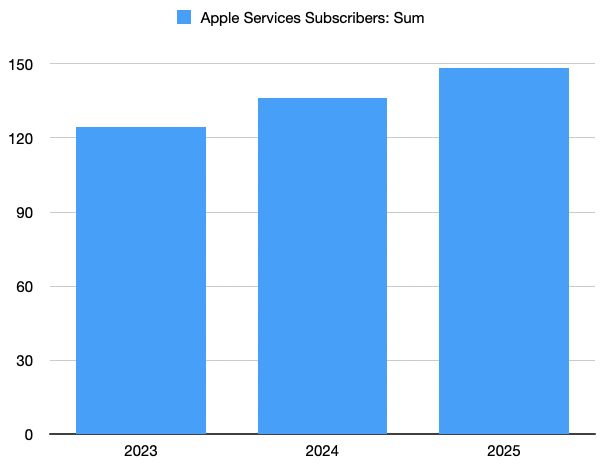
    Since October 2023, Apple has been reporting the average monthly users of the App Store in 27 EU Member States. The reports are updated every six months.

    I took three samples spanning 2023 to July 2024 to observe the evolution of the market.

    A few notes:

    • The list is complete including all member countries, with a combined population of 450 million people.
    • The resolution is 1 million users per country which I assume to be rounding down. That is, if a country has 3.8 million users, it's reported at 3 million and .8 million is reported as "under 1 million"
    • For this reason the error is an undercounting error.
    • Some estimates are made to reflect this error when looking at the trajectory over time.

    The samples I used yield the following user totals:

    The totals are in millions.

    Discussion

  10. Google and Apple: The Future

    Research

    In yesterday's post, I proposed a way to inspect the Google-Apple distribution deal. It could be understood as a flat-rate deal where default placement of Google search in Safari is paid for with a constant run rate. This was the assumption for a few years with estimates for this run rate ranging widely.

    Alternatively, it could be understood as a commission rate where payments are in proportion to ad sales. This is the 36% commission rate that has leaked during the antitrust trial.

    Finally, it could also be seen as an access fee for each individual. This is the 17c/user/day that seems apparent from my calculations.

    If one were to critique these options, I would disqualify the flat rate as unfavorable to Apple since the user base grows and behaviors can shift. The distribution commission sounds ideal but it would be problematic to enforce. How exactly can one track the precise income obtained by Google for each use of search, maps or YouTube on iOS or MacOS devices reliably enough with an audit trail for Apple to inspect?

    For these reasons, I believe the fee of $x/user (or possibly active device as a proxy) makes more sense. The burden would be on Apple to prove that they have such active users/devices while Google could sample their metrics to confirm. Data on active users and devices are figures that Apple already supplies publicly and a method for determining them likely could stand scrutiny by outsiders. The server logs showing active devices can't be too onerous to share.

    And so that's the model I'm going with. Having said that, the formulation of compensation for what is a complex distribution deal is likely complex. The abstraction to users/devices is one we have to live with given the challenges of inspecting the invisible.

    That's the model of the present. The future however is clouded by the potential interference of authorities. In this case, an antitrust prosecution of Google is asking whether the way Google buys distribution is anti-competitive. The legal arguments are beyond scope here but the gist of it is that buying exclusive distribution when you are dominant may close options to not-so-dominant competitors.

    The consequences, if we are to believe the commentary, are that the deal with Apple could be declared illegal and thus, stay with me here, Apple would lose a lucrative source of income.

    Let me repeat this for emphasis: If Google were found guilty of anti-competitive behavior, Apple would be punished.

    Let me expand for emphasis: If Google were found guilty of anti-competitive behavior, Google will be forced spend far less and be marched off a gangplank to swim in far greater profits.

    Given this commentary one wonders why Google's management and legal team aren't begging the judge to rule against them and why Google shareholders aren't hoisting the prosecuting team on their shoulders.

    The deal between Google and Apple exists only because both Google and Apple find it to be a better alternative to not having a deal or having any another deal. It does not exist because Apple benefits and Google doesn't or that Google benefits and Apple doesn't.

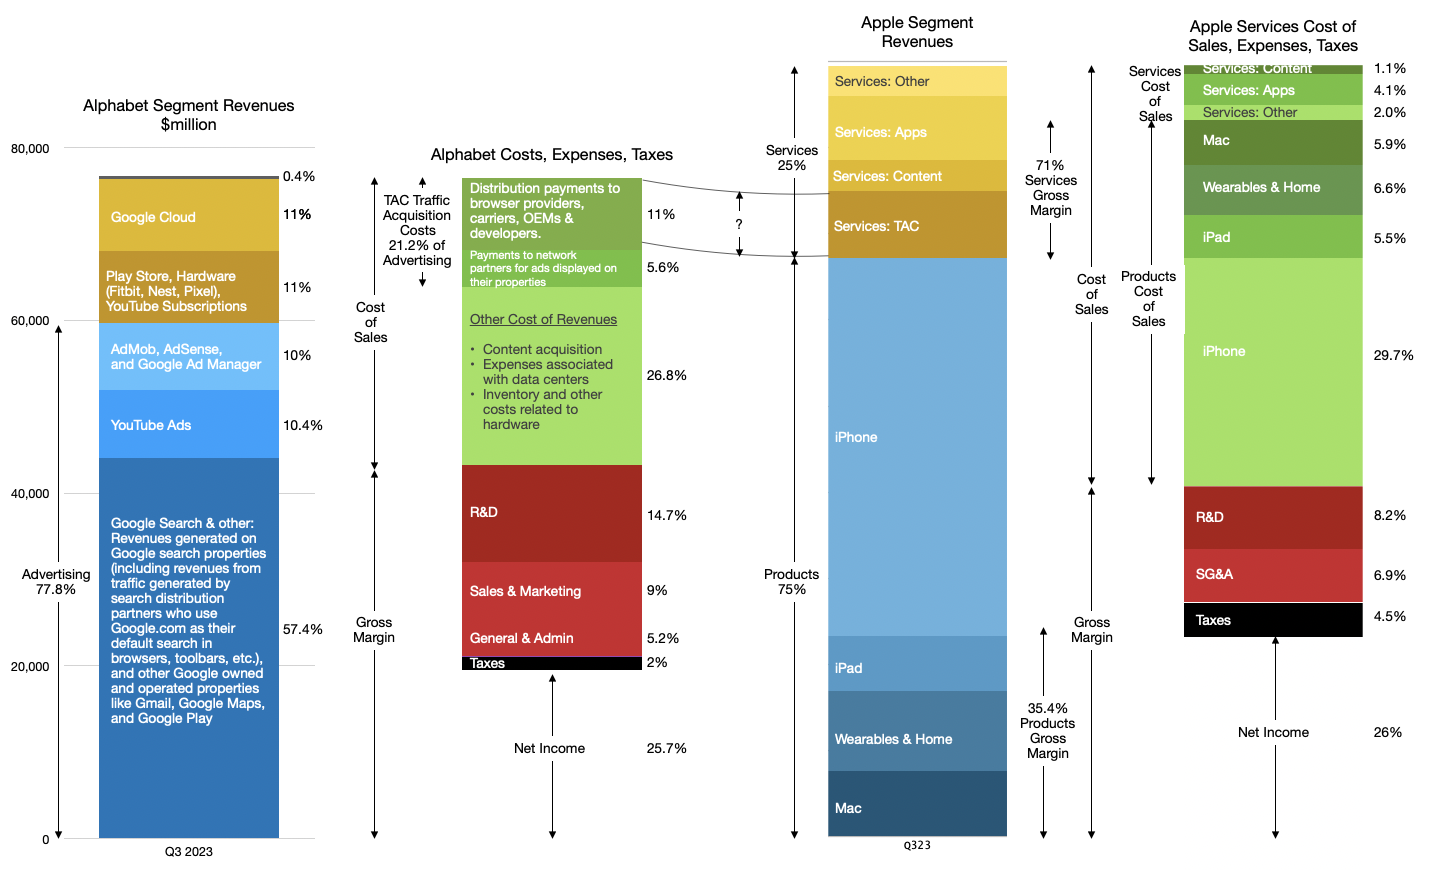
    As I've explained the first post in this series, Google's benefit is distribution or access to 1.3 billion very valuable customers. For this they pay quite a lot and Apple receives quite a lot in turn. The relationship is shown in this illustration:

    But—and here you should pay close attention—Apple also pays something for that benefit. Apple's $26b+ income from Google's TAC payments are in exchange for offering access. To Google. Not to someone else. And not to itself. Apple's costs are opportunity costs.

    If Google had not offered the area marked with a question mark in the image above then Apple would have found alternatives. Alternatives that it's saying no to today.

    Apple's alternative to the deal is what needs to be studied.

    Could, for example, Apple have signed Microsoft for Bing access in Safari? Sure! They probably didn't because, as they declared, the quality of Bing would not be as good and as a result most people would switch out of it and thus result in lower revenues. Then again, perhaps Apple could make a fortune from Microsoft. Apple could have enabled Microsoft to rise to 40% market share in search, and also improving its quality. How much would that be worth to Microsoft? How much additional opportunity could Microsoft create from establishing such a strong consumer-facing franchise—something they have struggled to obtain even with vast expenditures. Surely Microsoft could be convinced to split revenues 50/50 for what would be all marginally zero-cost new upside!

    Could Apple have developed its own search? Sure! They probably already did. Internet Search is a lot easier in 2023 than it was in 2007. Costs for computation, communication and storage drop exponentially while the number of internet hosts has stopped growing. Apple uses indexing in Siri and each iPhone, Mac and iPad runs a local search engine (Spotlight). Again, there are reasons why this is not as good or easy as signing Google up. But on the other hand, perhaps Apple could be making a killing on search. Why accept a 36% commission from Google when they could take 100% of 40% of all Search?

    But most importantly, a declaration that this deal is invalid simply means that Apple and Google would craft another deal that would work around the restrictions. And that new deal would probably turn out to be more beneficial to Apple.

    Why, I hear you ask?

    Because Google would ask for the changes! Google would be forced to re-negotiate because they lost at trial. If that were the case, Apple would naturally ask for concessions. The most certain outcome would be that Apple will be paid even more for access to its users.

    How much more? Remember that Google must ensure access to Apple's customers. According to my calculations Apple customers deliver almost 40% of its advertising revenues. The 36% commission suggests that there is plenty of head-room. Apple could ask for 50% and meter the results on a different basis. This would be a 39% increase in pricing for distribution.

    This would result in a deal worth $41 billion/yr.

    To implement workarounds, the companies would need to bridge their servers in order to ensure metering along new metrics. There would a great deal of complexity. But it would be worth it because both would find such a deal better than alternatives.

    Fundamentally, the relationship between Google and Apple exists and will continue to exist because it is mutually beneficial and a better alternative to any other agreement or no agreement. If the current deal is found unsound, for whatever reason, a new deal will be created because it will need to be created.

    Apple sits in a better position today than it ever did. Its customer base is growing while its pricing power with consumers is growing. In contrast, Google is the process of explaining that it did not break any laws. This while losing Android users to Apple. How does this lead to a vulnerability for Apple?

    What we are witness to here is Apple increasing its distribution pricing power while simultaneously decreasing its opportunity costs.

    The idea that Google being found guilty of anti-competitive behavior would result in a "hit to Apple earnings" is preposterous and fails on first inspection. The exact opposite is the likely outcome.

  11. Google and Apple: The Deal

    Research

    In Google and Apple: The Beginning, we looked at the history of the relationship and the situation which emerged when Mobile Computing rose to such a level of ubiquity that it determined the fate of both companies. Apple today holds firmly in its grasp about 27% of all smartphone users (1.3 billion out of about 4.8 billion). That audience consists of the top quartile of users in terms of income, access to credit, consumption and loyalty. I performed a deep dive on newly available data which confirms that App Store users individually spend more than 7 times Play Store users.

    Apple has over 1 billion customers but also they're the best billion.

    For this reason, Google has needed to ensure that it maintains access to Apple users for its main business: search. Just like any developer looking at iOS and Android ecosystems, Google knows that Apple's customers are highly desirable, profitable and loyal. Apple had to remain a distribution partner for Google.

    How to do that? Google distributors are incentivized with what Google calls TAC or traffic acquisition costs. This is how Google describes TAC in its 10Q filings:

    TAC includes:
    ◦ Amounts paid to our distribution partners who make available our search access points and services. Our distribution partners include browser providers, mobile carriers, original equipment manufacturers, and software developers.
    ◦ Amounts paid to Google Network partners primarily for ads displayed on their properties.

    Apple belongs to the first category, a distribution partner that is both a browser provider and OEM. These costs are part of Google's "Cost of revenues" or Cost of Sales. These are costs that are proportional to sales and are usually measured as a percent of sales. The higher the sales, the higher the costs.

    So the question that has been hovering over both companies for a long time is just how much is the portion of TAC allocated to Apple? Consequently, how much does Apple receive in such payments? This is a relevant figure as it affects the degree of co-dependency but also of relative profitability of each business. Apple gaining highly profitable commissions for access to its customers and Google getting highly profitable search terms from those same customers.

    Here's what we know: Google reports its overall TAC total as part of its cost of revenues and Apple reports its overall Services revenues and margins as a separate segment. Google also reports TAC as a cost against its Advertising segment revenues.

    In the last quarter TAC was $12.6 billion, a 21.2% cost against an Advertising total of about $59.4 billion. Apple reports Services top line only without sub-segments so we don't know how much of that TAC it receives. Services for Apple includes many elements including licensing, AppleCare, cloud subscriptions, digital content, third party subscriptions, apps, payment, advertising and other services. Some of these elements can be estimated as we have some historic data. Apps in particular can be teased out as we have developer payment data.

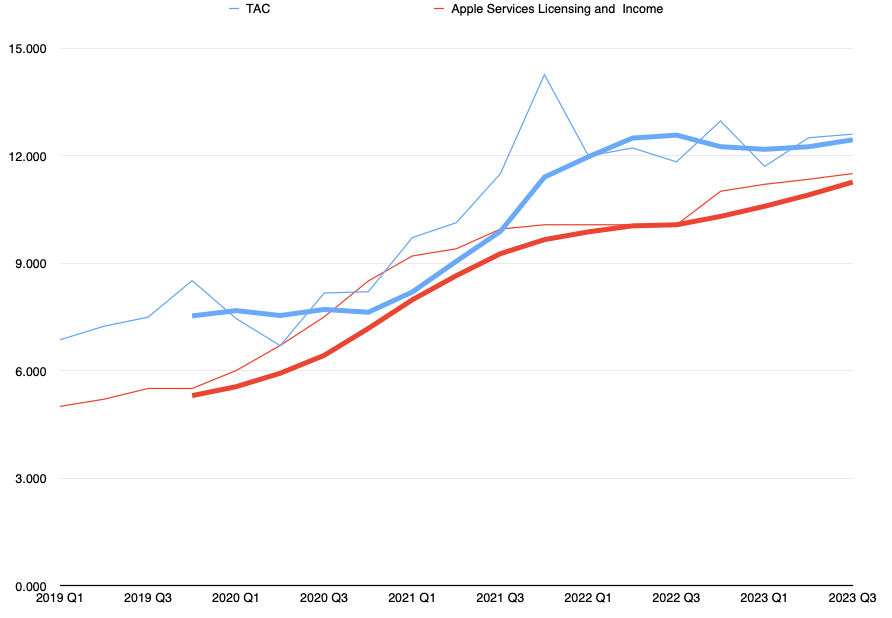
    I've been estimating what would be Apple's TAC+cloud+payments as a bundle over the years. Looking at this figure vs. what Google reports as TAC yields this graph:

    The thin lines are the actual data and the thick lines are 4 period averages. Apple is red, Google is Blue.

    What this shows is that Google TAC is fairly well correlated to what Apple receives and that there is a gap of some degree. What is needed is an estimate of the percent of TAC that goes to Apple and a percent of Apple Services that matches it. Two variables but one equation.

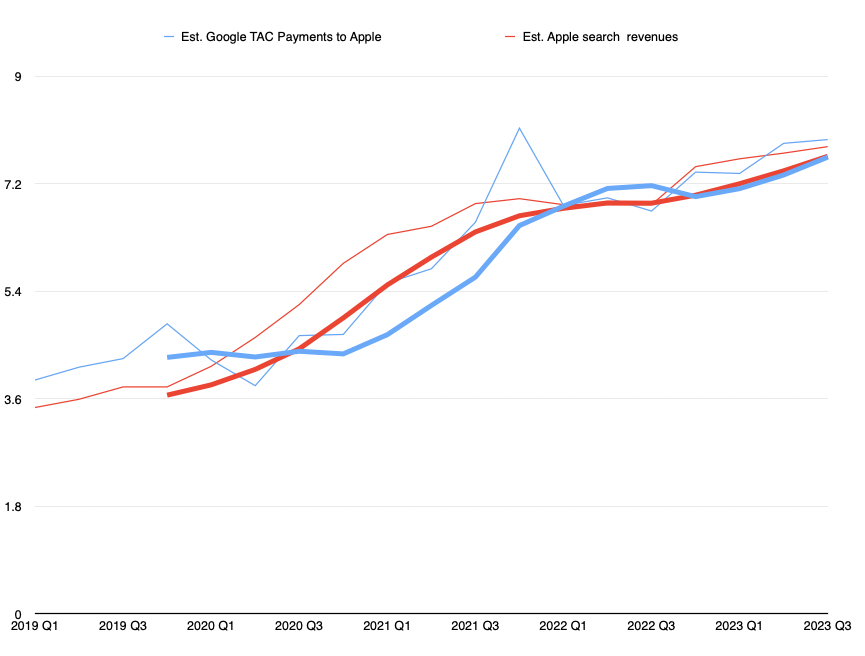
    After some iteration through some constraints (which would be laborious to explicate but I can reveal at the next live event) I built the following estimate:

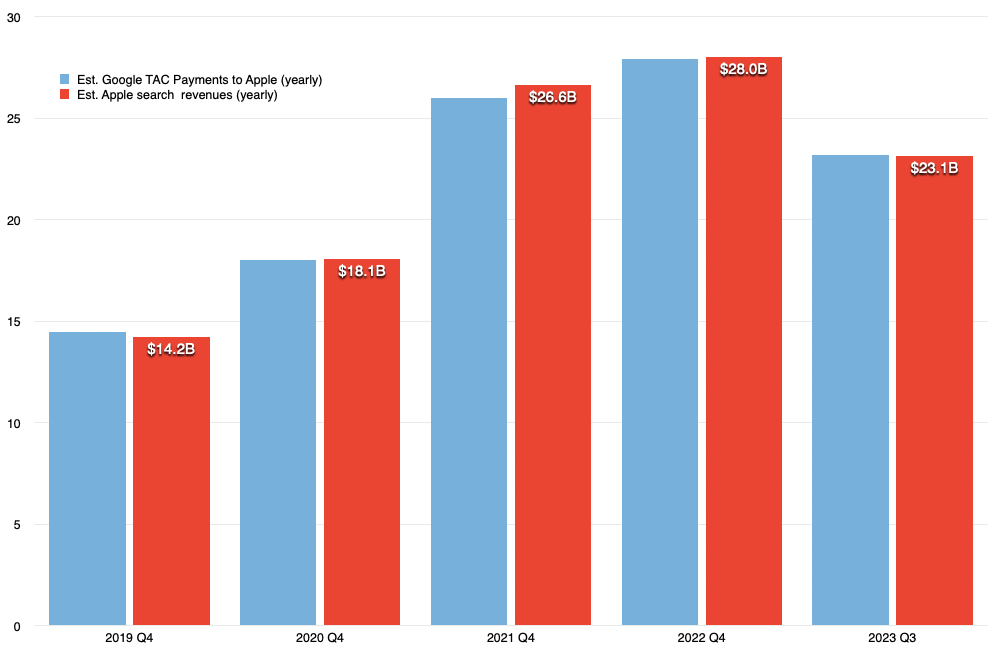
    Though not matching identically, the yearly totals are pretty close to each other. The resulting yearly payments are

    • 2019: $14.2 billion
    • 2020: $18 billion
    • 2021: $26 billion
    • 2022: $28 billion
    • 2023 (first 3 quarters): $23 billion

    I would say this might be an upper bound for the estimate but not too far from reality. Most estimates to date have been far lower and I don't think they are accurate.

    To stress test this I ran several sanity tests including comparing the revenue per user for Apple users and for non-Apple users and checking the sensitivity of services gross margins to TAC total.

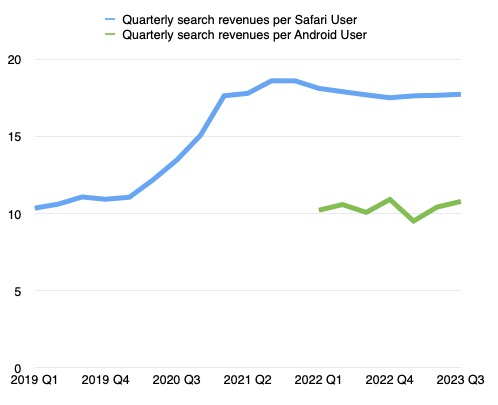
    I'll just expand a bit on the revenue per user implications. We can calculate the revenues per user since we know that, according to Google's CEO, Apple receives 36% commission on search. Having the figures above, we can estimate the search income attributed to Apple and, by subtraction, the same for non-Apple. Then we can divide by the install base of each.

    This shows that the deal could very well be indexed on the number of users with a specific value attached to each per quarter/month/day as these figures are fairly stable. The figure at this time shows that Apple users are valued at about $17.7/quarter or 19c/day while non-Apple users are around $10/quarter or 11c/day.

    It also shows that Apple got "a raise" during 2021, increasing the amount it gets paid per user by about 60%.

    It also suggests that Apple users generate about 37% of all of Google's advertising revenue, disproportionately as it's from a 27% user base market share.

    None of these conclusions should seem surprising or extraordinary. If anything, they suggest that Apple is providing Google with bargain access to its customers. I suspect that Apple users are more valuable than a ratio of 2:1 in search. The app (and content and device ASP) economics are far more lopsided.

    Apple is most certainly also very well aware of this and yet has maintained relatively modest pressure on Google in terms of pricing for access. There might be good reasons of which we are not aware of but as the antitrust pressure grows, so might Apple's interest in getting a better deal.

    In the next installment of this series we will look into just how much better this deal can get.