The next Asymco Office Hours Live Q&A will be on this Friday July 31st at 12pm ET / 9am PT, the day after Apple’s fiscal Q3 2026 earnings call on Thursday. Horace will review the results and their implications, and we will take Q&A from our live audience.
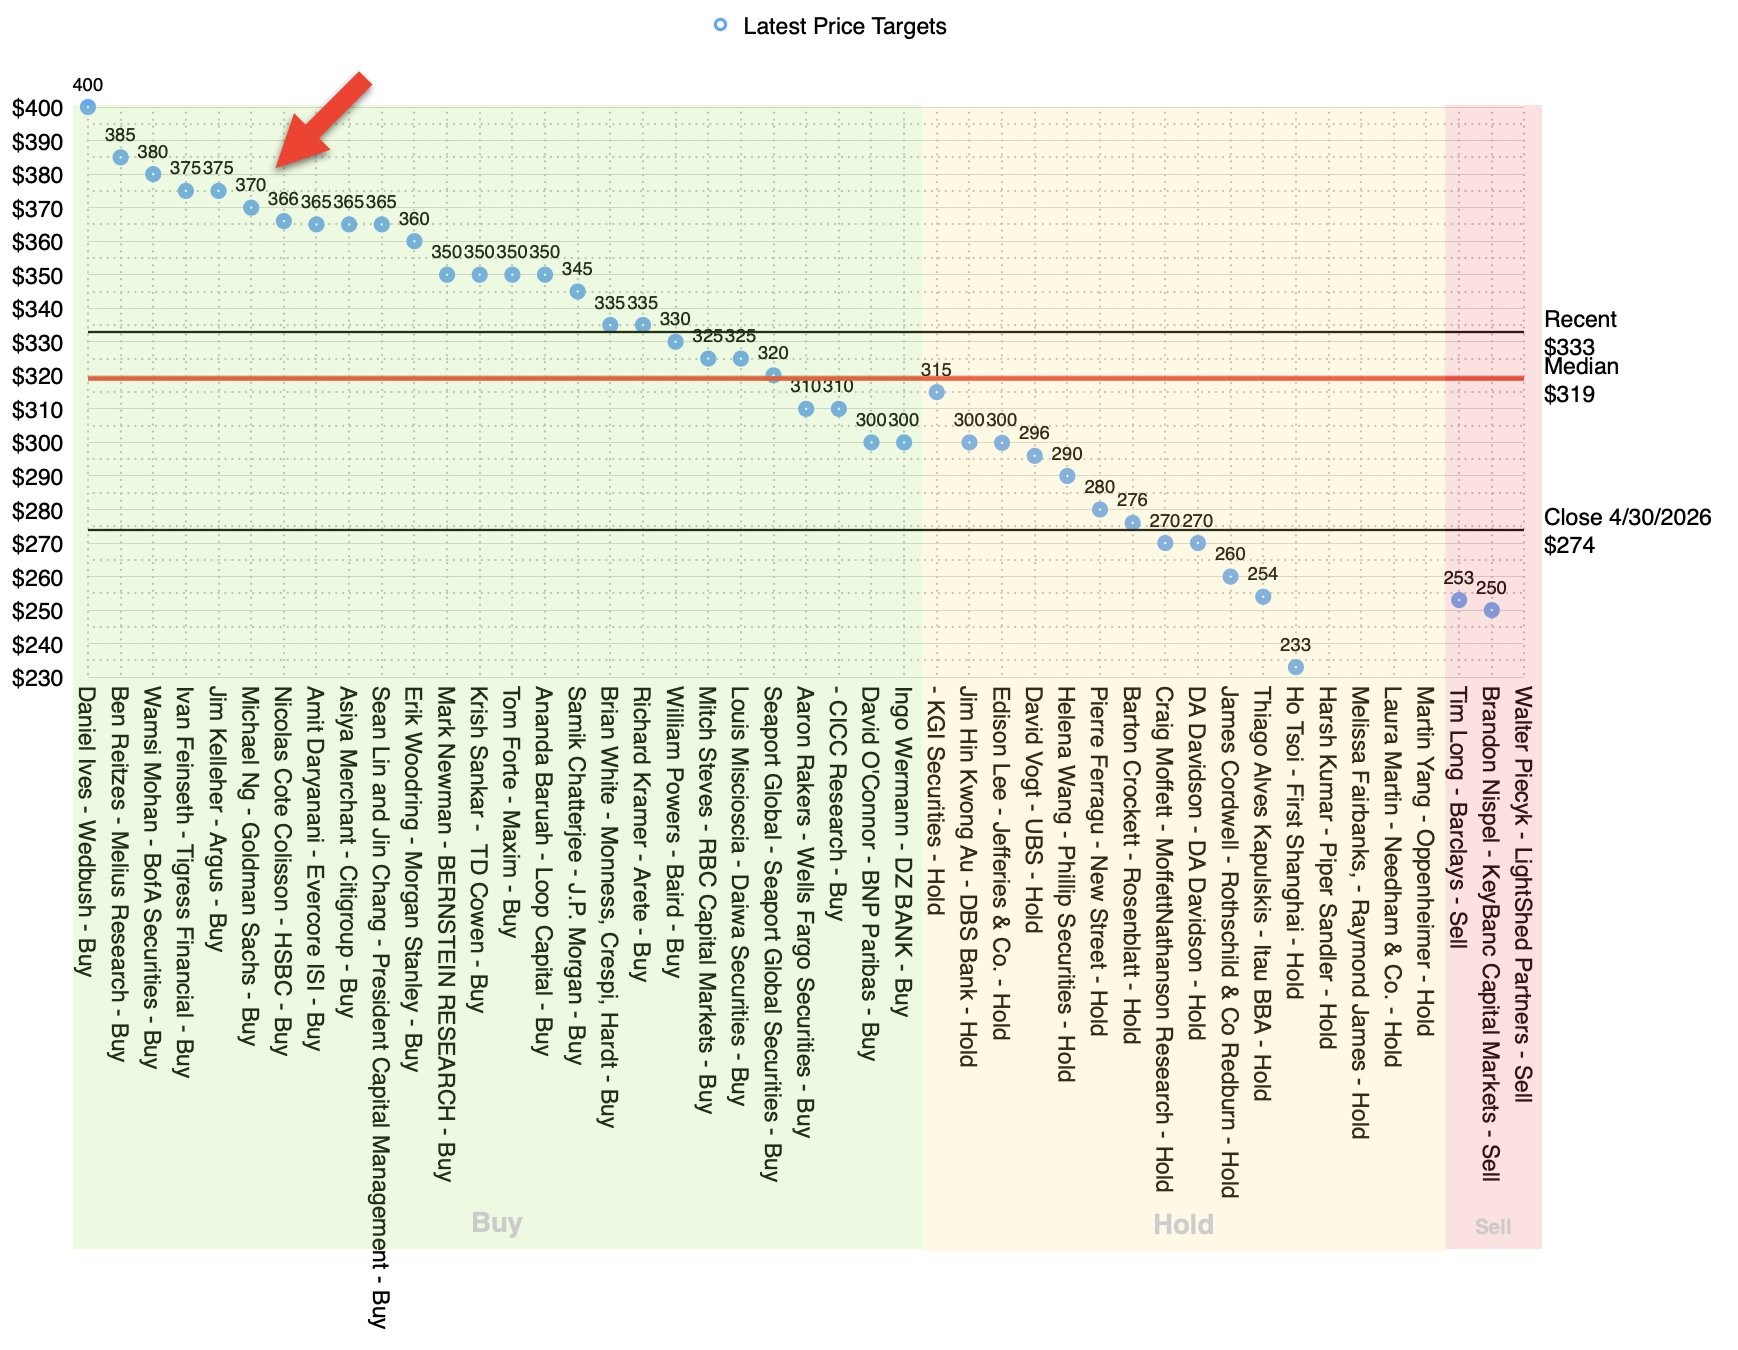
Goldman Sachs reiterated a Buy rating on AAPL stock and raised its price target ahead of Q3 FY26 earnings.
The analyst raised his price target for AAPL stock to $370 from $330, increasing his valuation multiple to reflect his growing optimism in the company’s iPhone replacement cycle and AI efforts.
Ng expects Apple to report better-than-expected Q3 FY26 earnings, driven by 17% revenue growth to $110.1 billion, which is at the high end of AAPL’s revenue growth guidance range of 14%-17%. He also expects iPhone revenue of $54.8 billion (23% growth), above the consensus estimate of $53.7 billion. Ng expects iPhone revenue growth to be driven by a 15% unit growth and a 7% rise in ASP (average selling price) on a premium mix shift.
Additionally, Ng projects 15% growth in Apple’s Services revenue, in line with the Street’s expectations. Within Apple’s Services business, Ng noted continued slowdown in App Store growth due to lower commission rates across markets such as China and Japan. Nonetheless, the analyst expects double-digit growth in the Services business, driven by strength in the services tied to Apple’s products (such as iCloud+ and AppleCare+).
Ng noted that Apple stock is outperforming the broader market since the beginning of the second quarter, as investors rotated away from traditional AI infrastructure stocks. He added that investor sentiment also improved as Apple gained market share despite industry-wide price hikes due to elevated memory costs. Furthermore, the progress in Apple Intelligence following the WWDC event also helped address AI disruption concerns.
Meanwhile, Ng expects Apple’s recently announced price hikes for Mac and iPad to support earnings growth over the next few quarters, as he believes that the company’s user base is “relatively price inelastic given brand stickiness, U.S. carrier subsidies, and availability of recent low-cost product launches (iPhone 17e, MacBook Neo).”
NB: Ng is near the high range for both his price target and quarterly estimates.
My estimate is higher on the iPhone unit growth but lower on the ASP growth. Regarding iPhone revenue growth, my estimate is 21% vs. his 23%. We are $1 billion apart on net revenues, almost all attributed to the iPhone ASP difference.
Data, data everywhere but not a conclusion in sight.
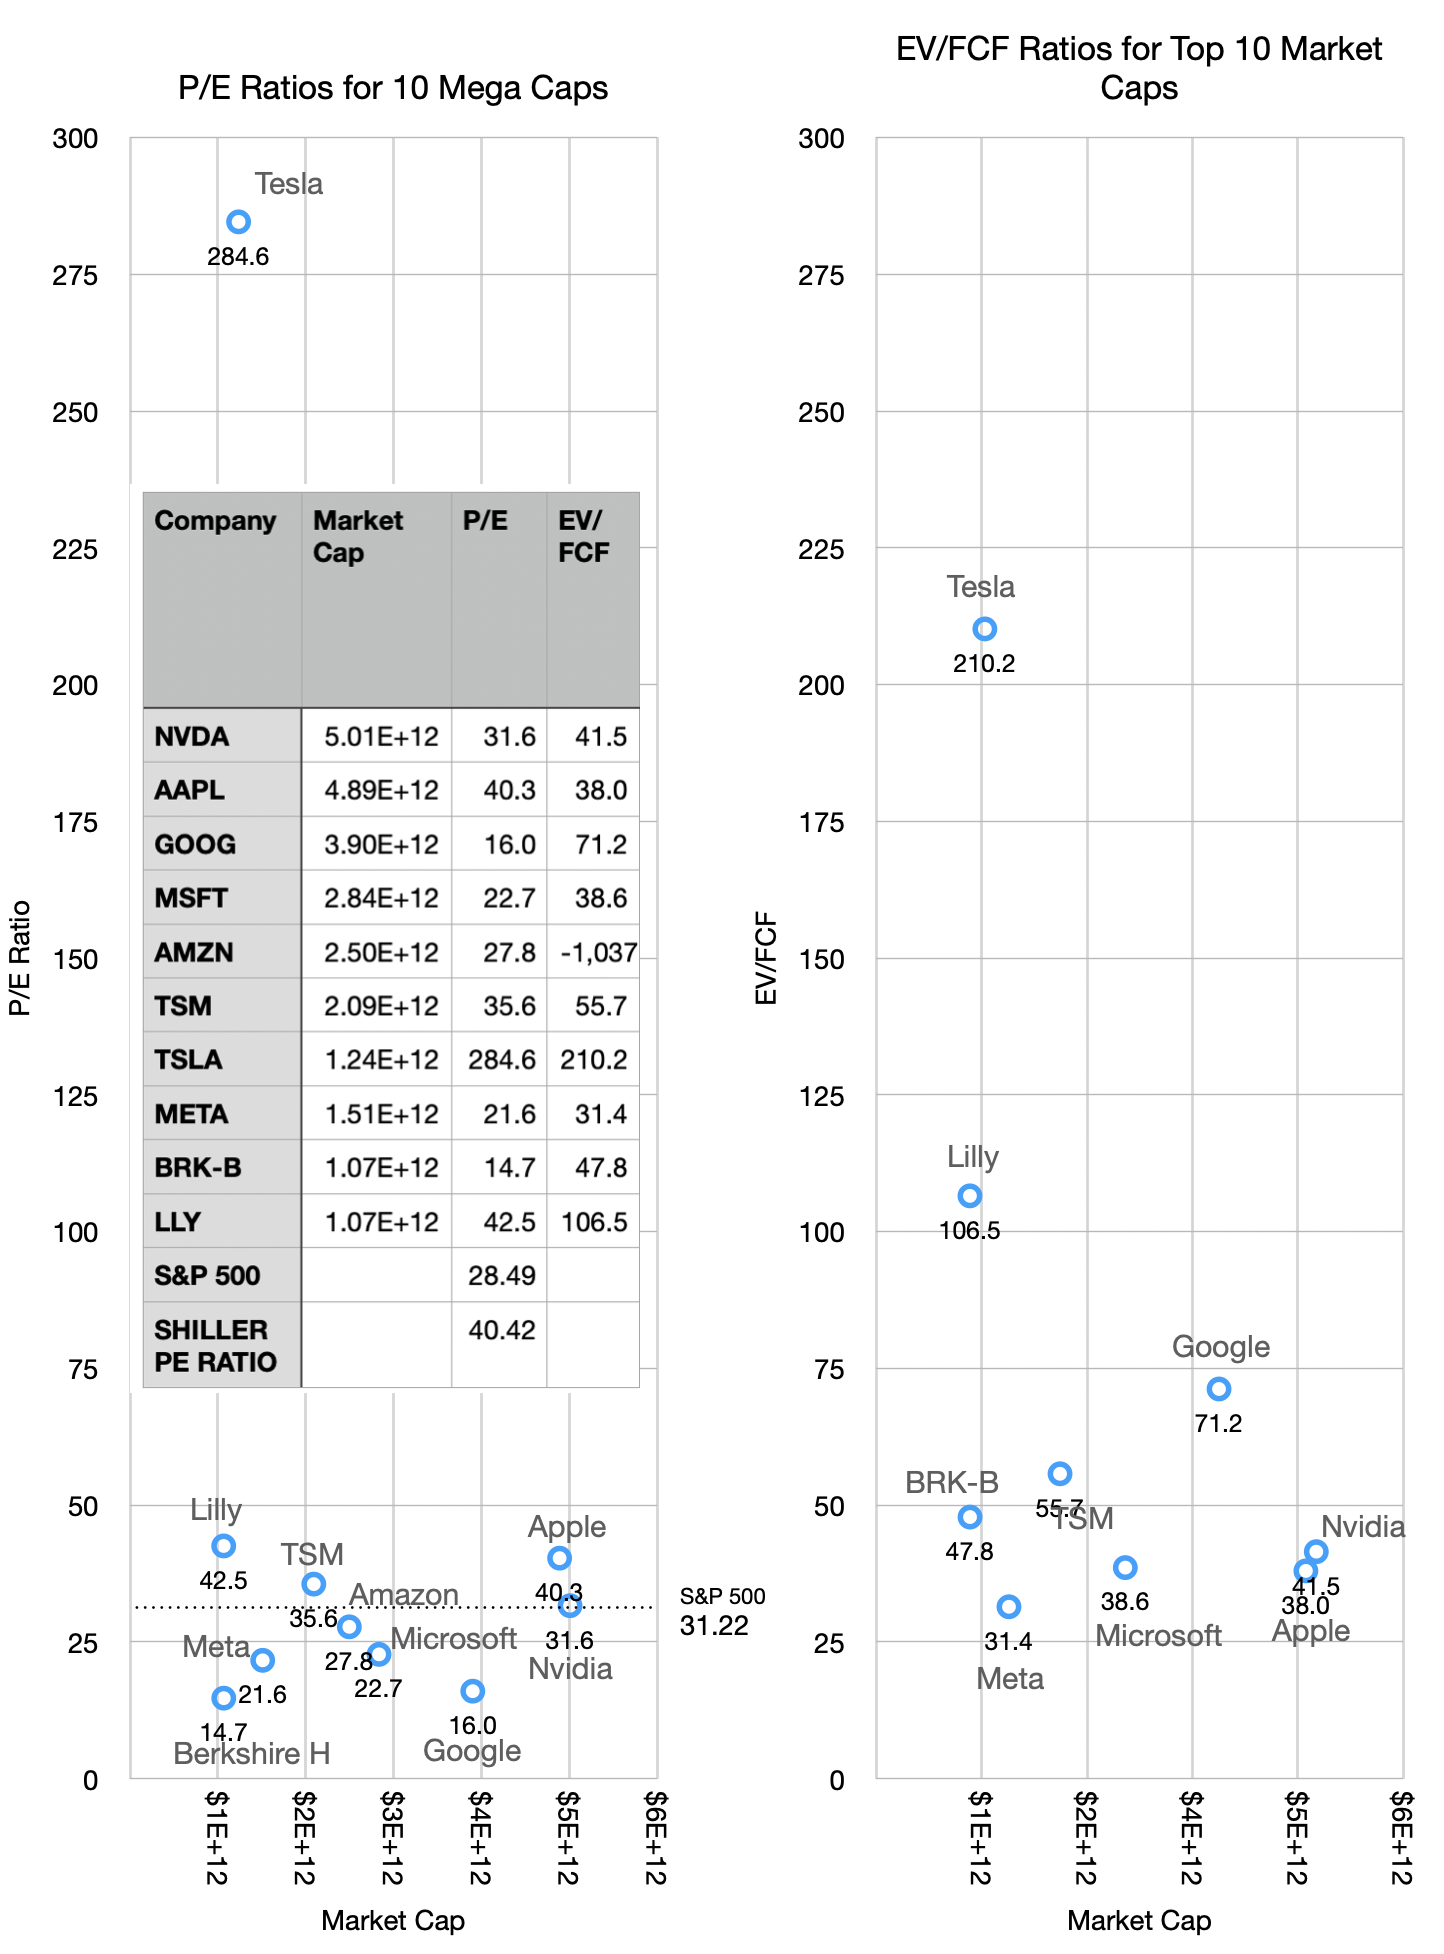
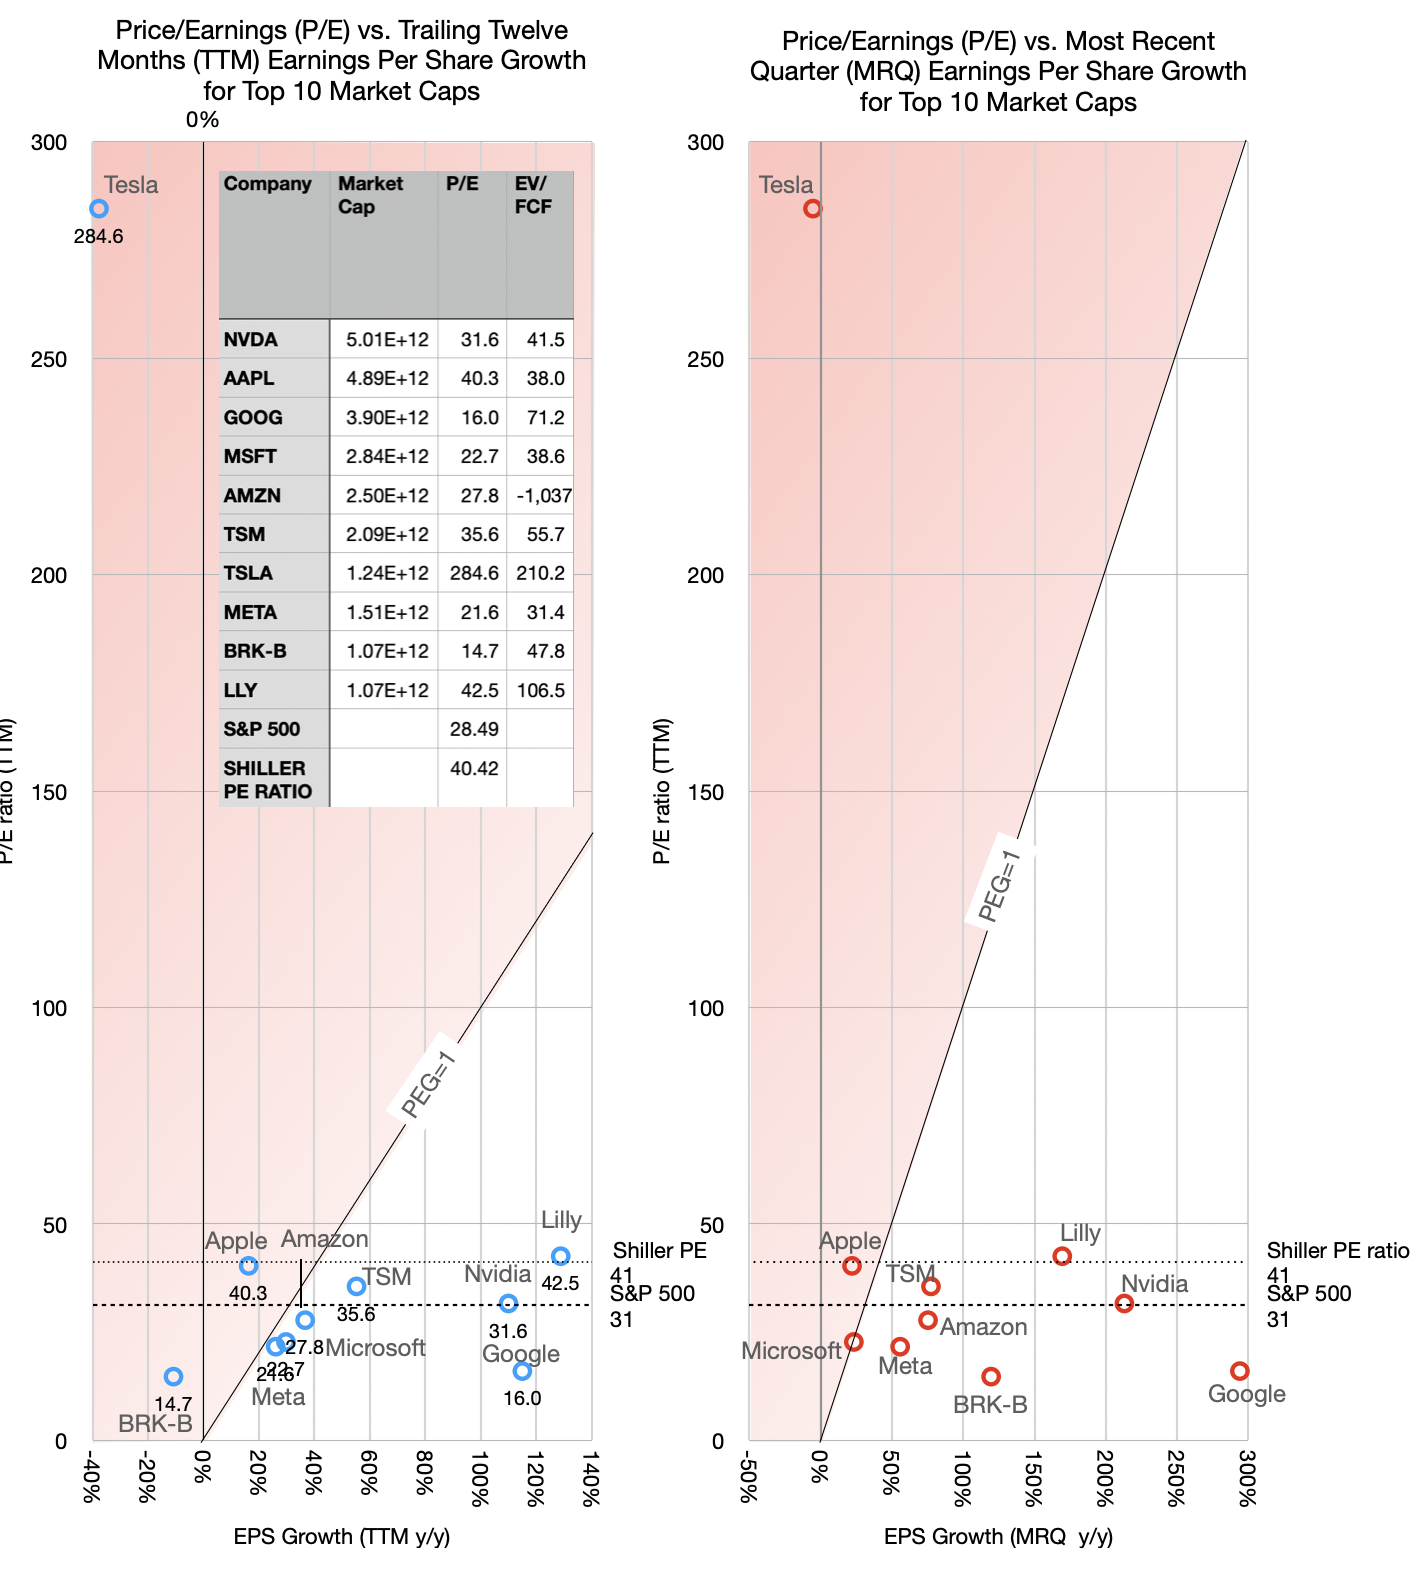
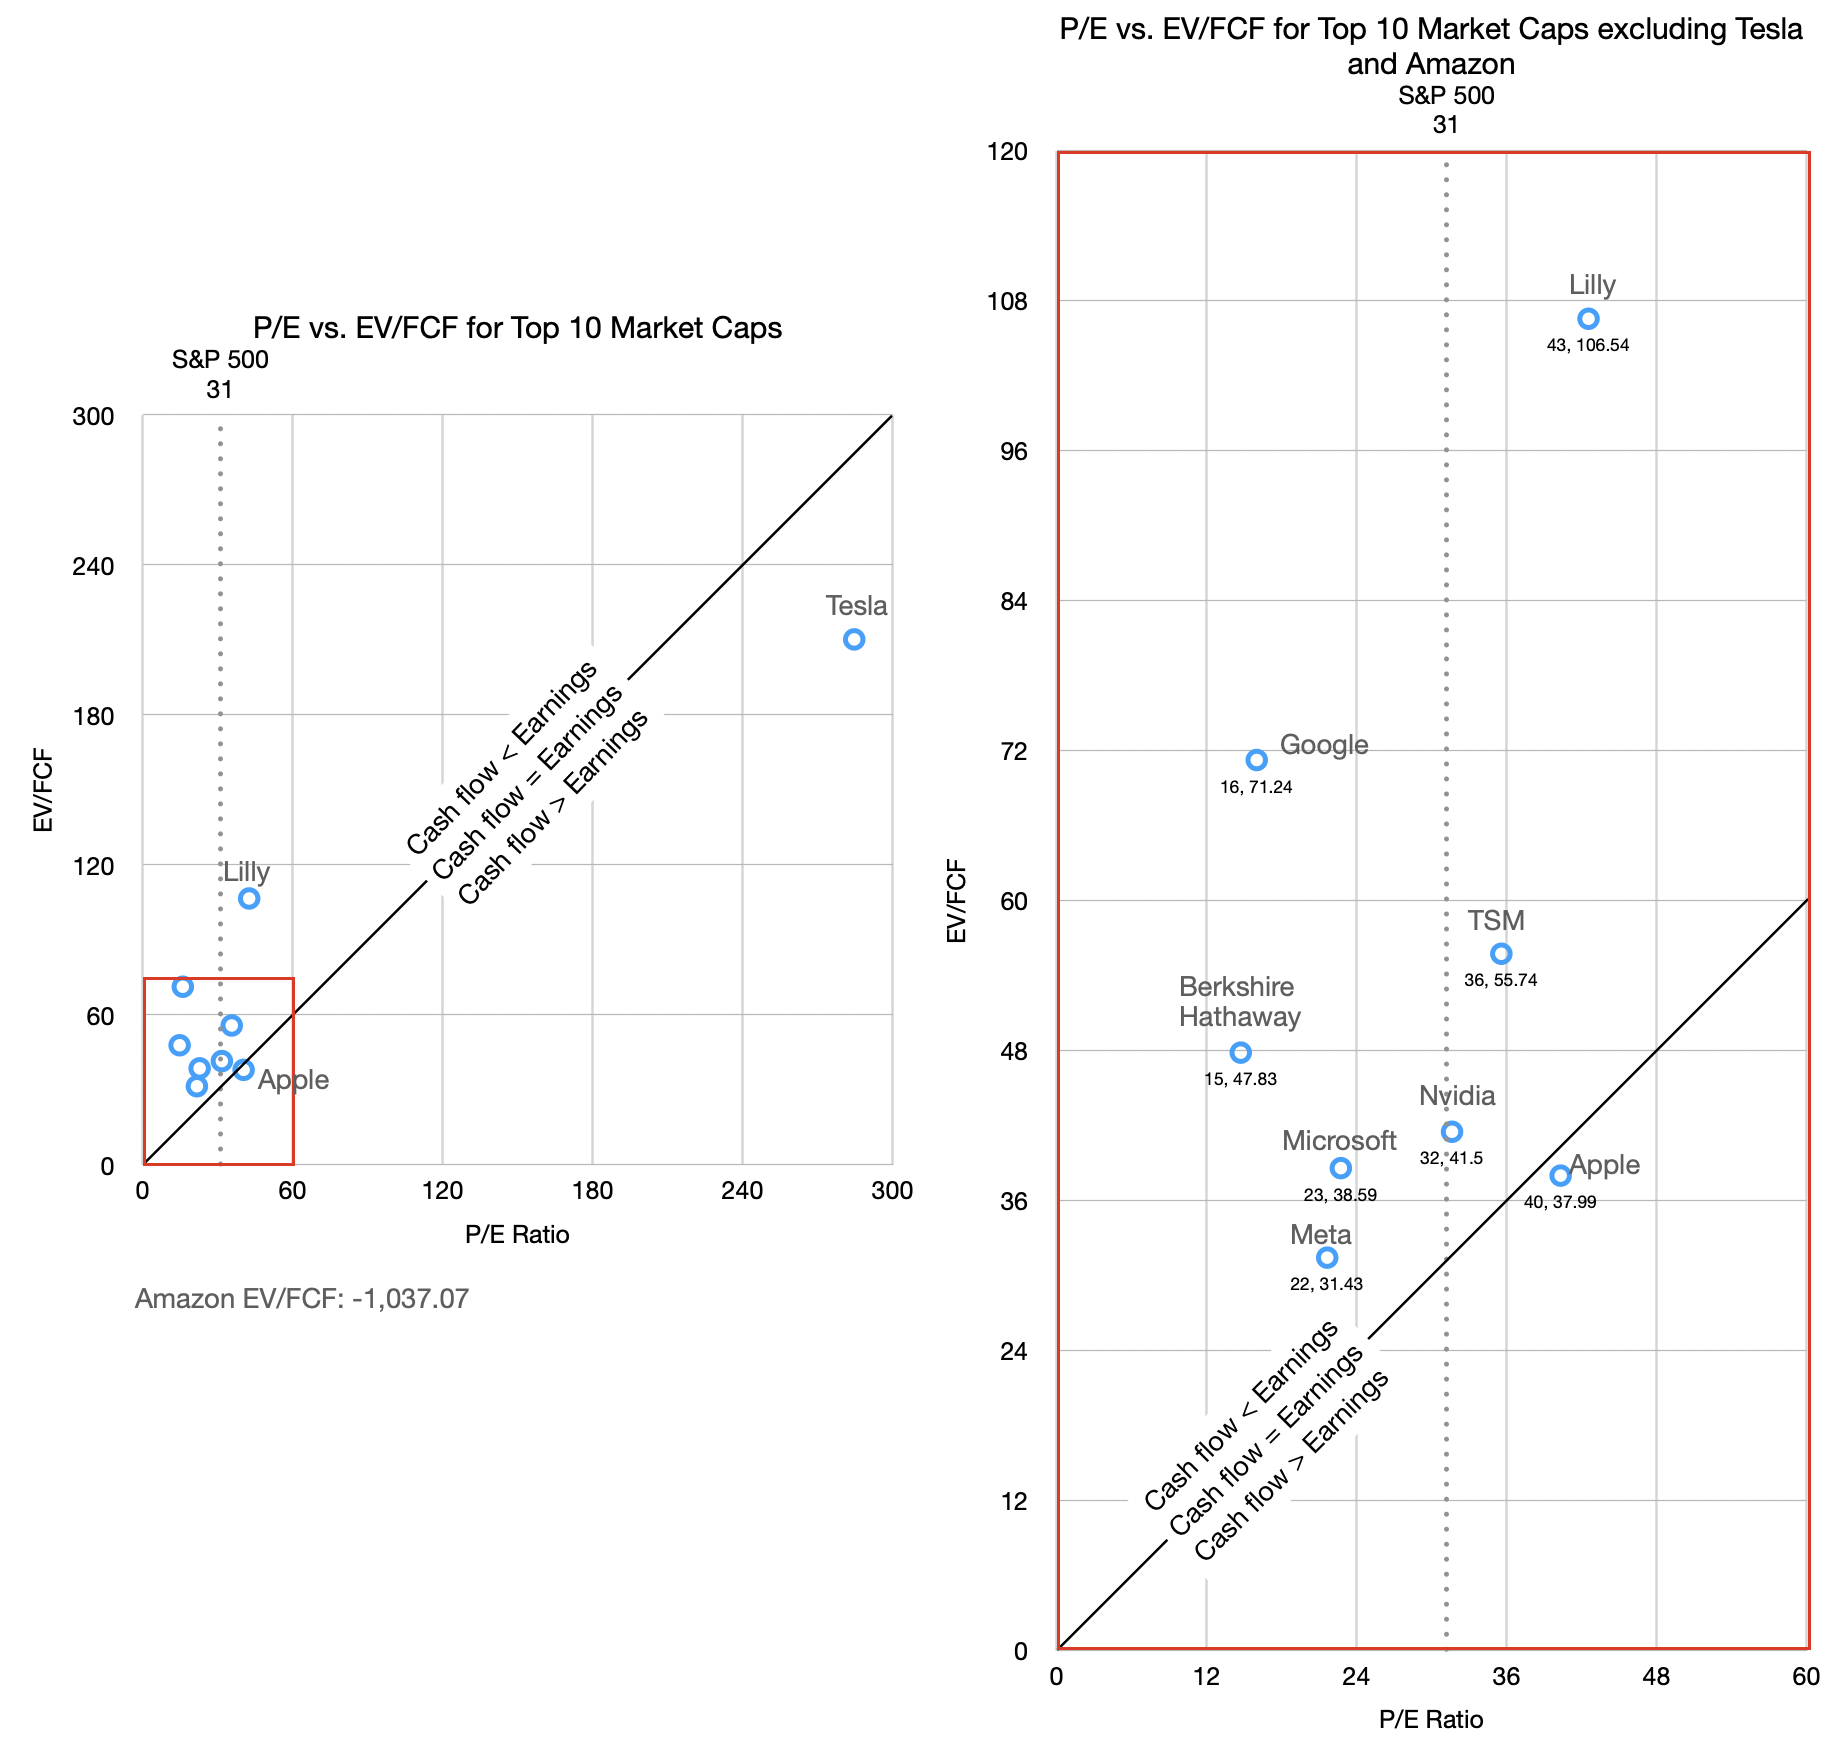
Is the market overvalued? Two measures to consider are P/E and EV/FCF. Here are those measures for 10 of the largest companies in terms of market capitalization and the overall S&P 500. Note: Amazon EV/FCF is less than negative 1,000 and is therefore excluded from the second graph. As we move forward the FCF for more of these companies will turn negative. Alphabet just recorded its first negative cash flow since going public in 2004.
P/E should be compared to growth rates. Both growth in the most recent quarter and in the last 12 months. Here are those P/E vs. Growth measures for 10 of the largest companies in terms of market capitalization and the overall S&P 500. Rule of thumb: if PE=Growth*10 (PEG=1) then the company is "fairly valued". But, given crazy capex, we should also look at EV/FCF…
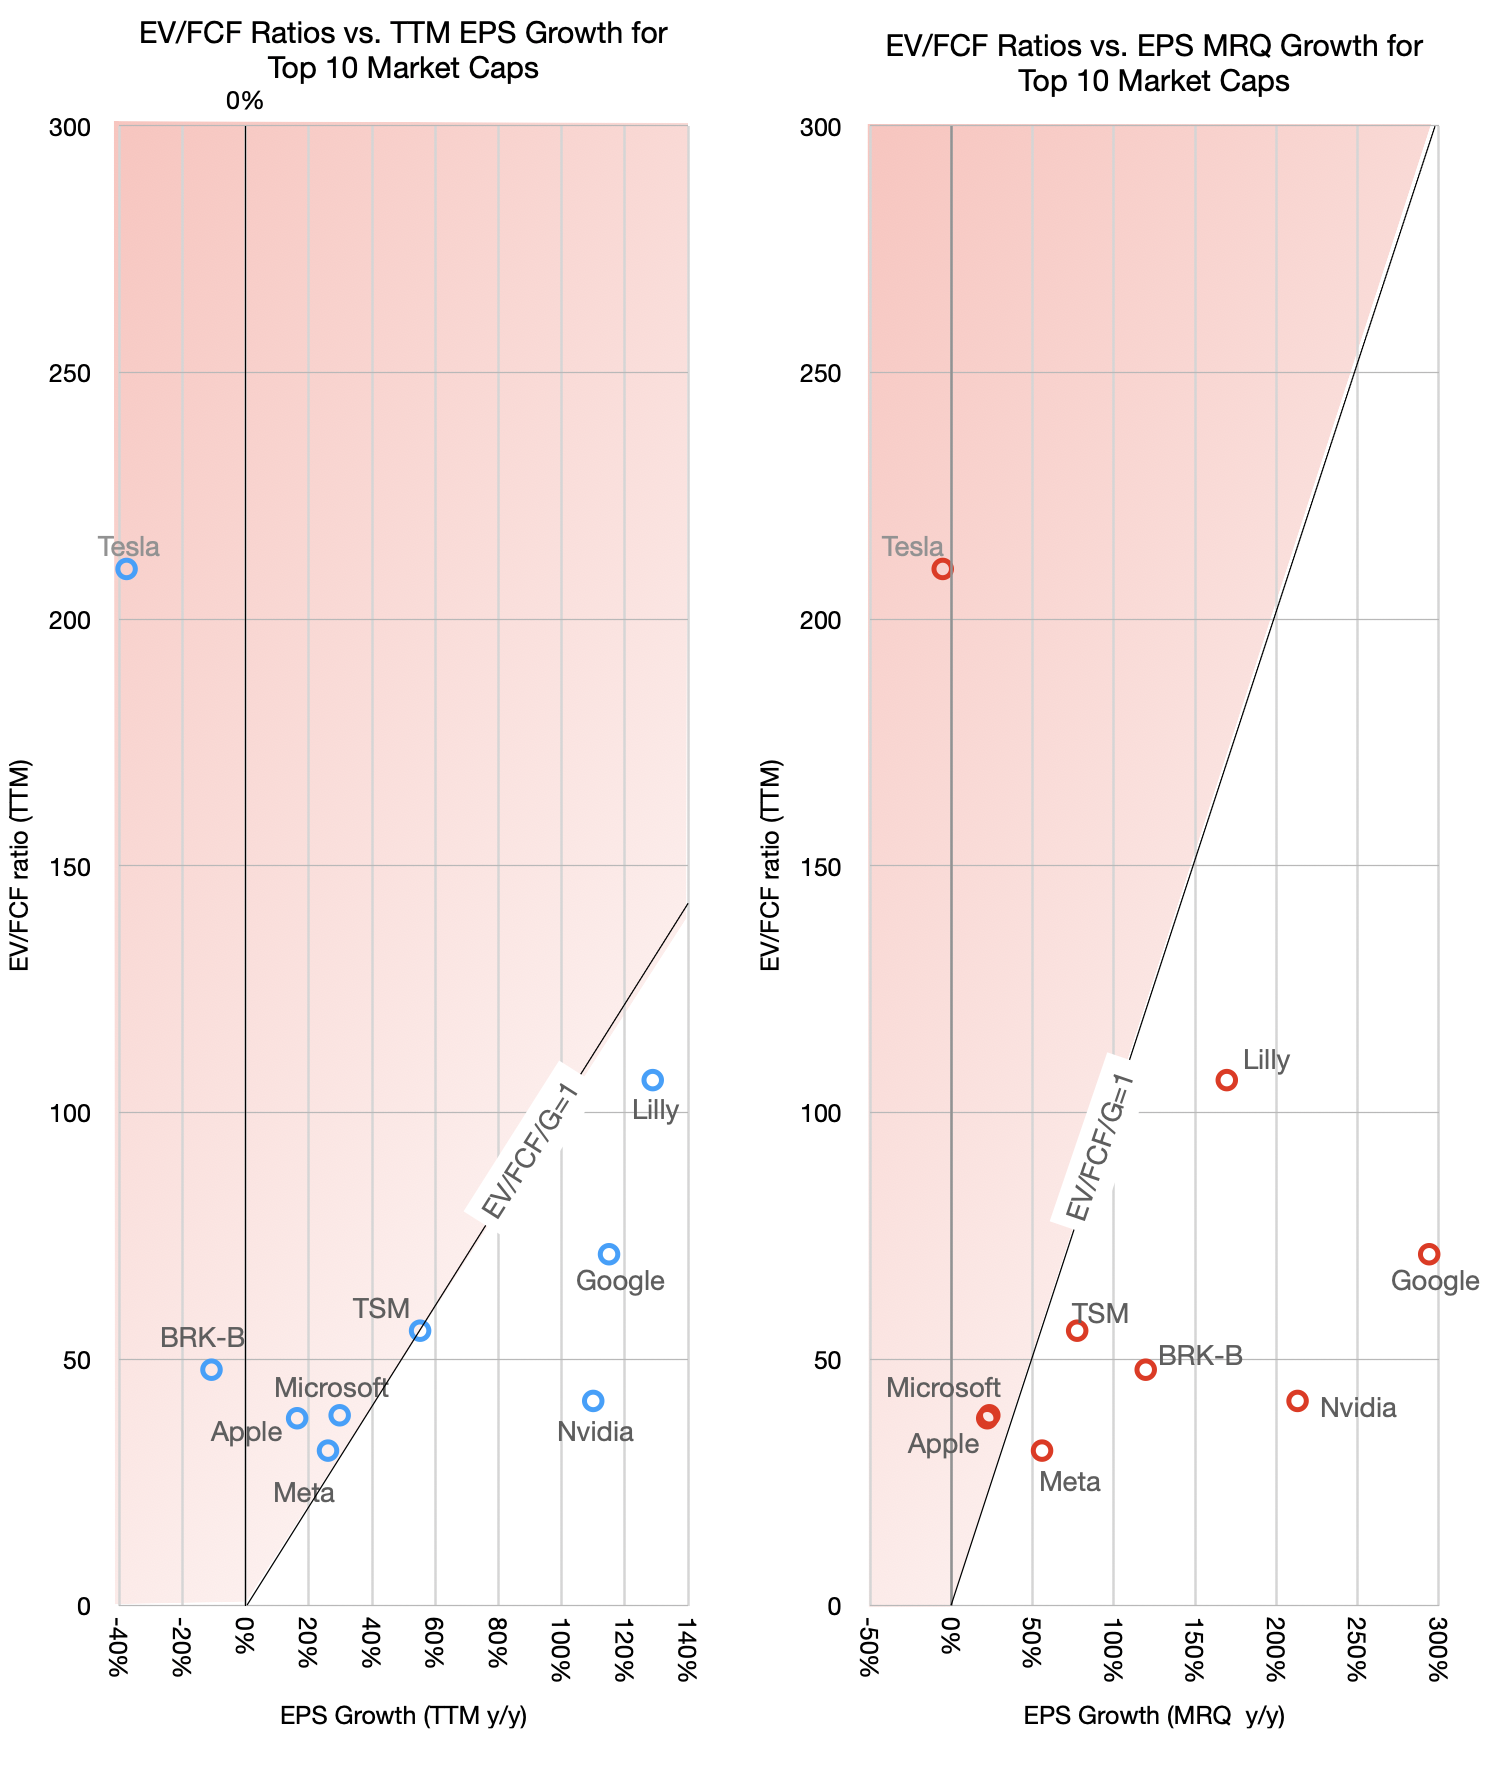
In addition to P/E, Enterprise Value/Free Cash Flow should be compared to growth rates. Both growth in the most recent quarter and in the last 12 months. Here are those EV/FCF vs. Growth measures for 10 of the largest companies in terms of market capitalization and the overall S&P 500. Rule of thumb: if EV/FCF=Growth*10 then the company is "fairly valued". Note outlier Amazon is excluded due to negative FCF. Soon, it won't be the only one. What other anomalies exist?
If the Price/Earnings (P/E) is similar to the Enterprise Value/Free Cash Flow (EV/FCF) then the company is "in balance" where neither cash is being used for investment nor earnings are overstated. Here are the two ratios relative to each other for 10 of the largest companies in terms of market capitalization and the S&P 500. We can see that the balance is uncommon. Apple is rather alone in that regard (apart from Tesla which is in its own bizarro world.) Amazon also is off the scale. Soon, it won't be the only one.
So, is the market overvalued?
Not all these companies have reported so we should update the data in the next week or so, but I've been tracking this type of data for 18 months. It continues to exhibit a reasonable P/E ratio (apart from Tesla, as always). The FCF however will turn negative and will make reasonable assessments impossible. As the cash flow turns negative, firms will raise debt to finance their desperate flight from commoditization. That's when the situation will turn challenging for not just the market but the global economy.
Recessions are built on bad debt. It's not yet at the point where there is much debt and it's not yet bad debt. But if the financing of data centers becomes debt-driven and if the cash flow does not support this financing then contagion may occur macroeconomic consequences will follow.
The market itself may not be a leading indicator if it measures only earnings. Remember: earnings are an opinion, cash flow is a fact.
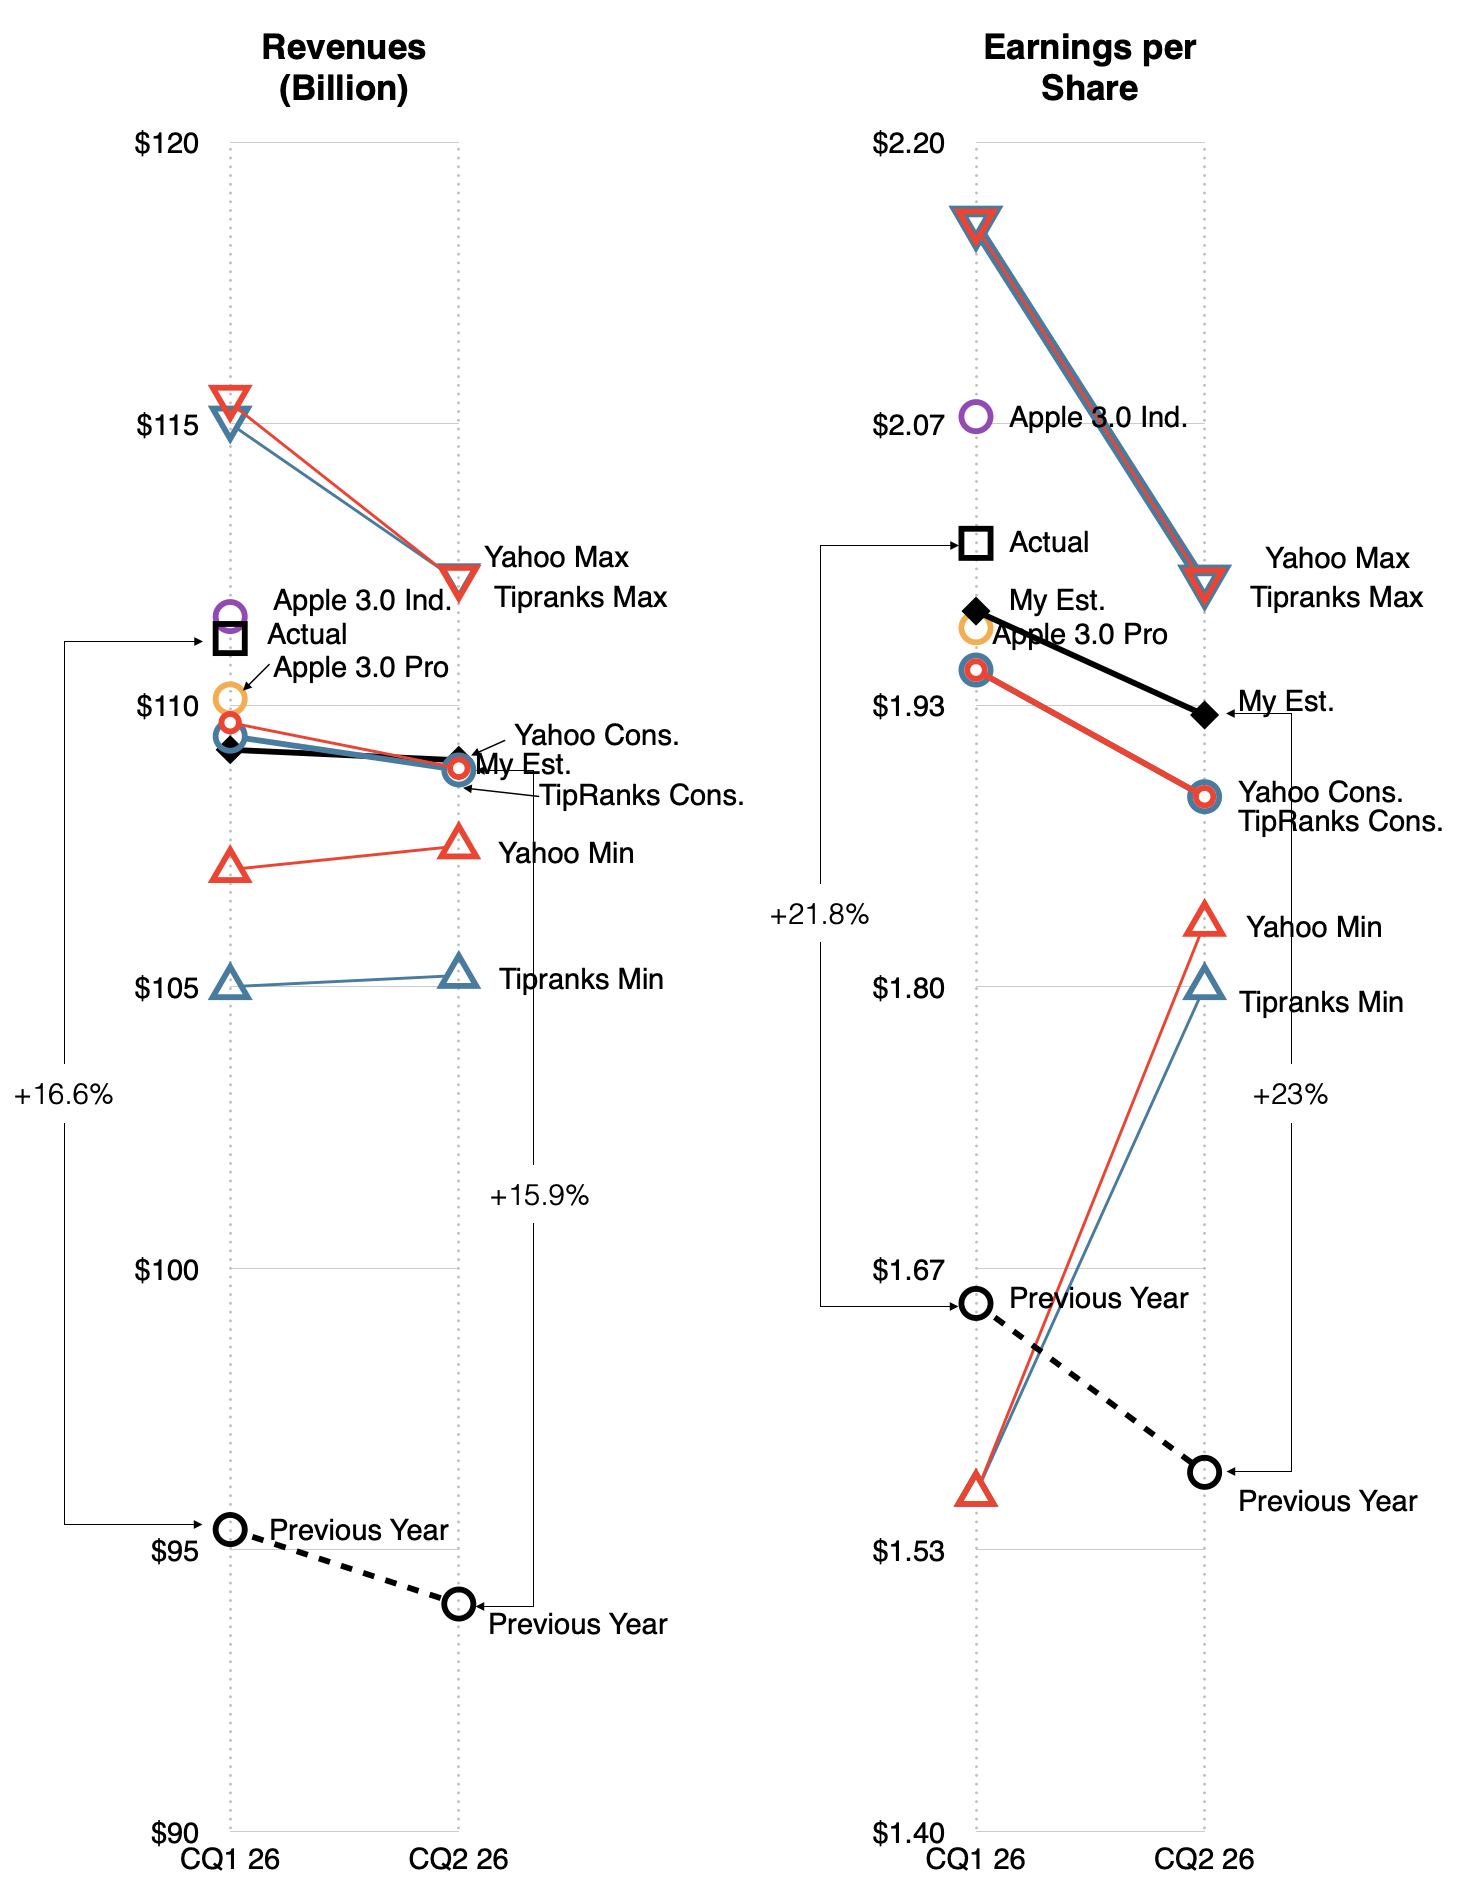
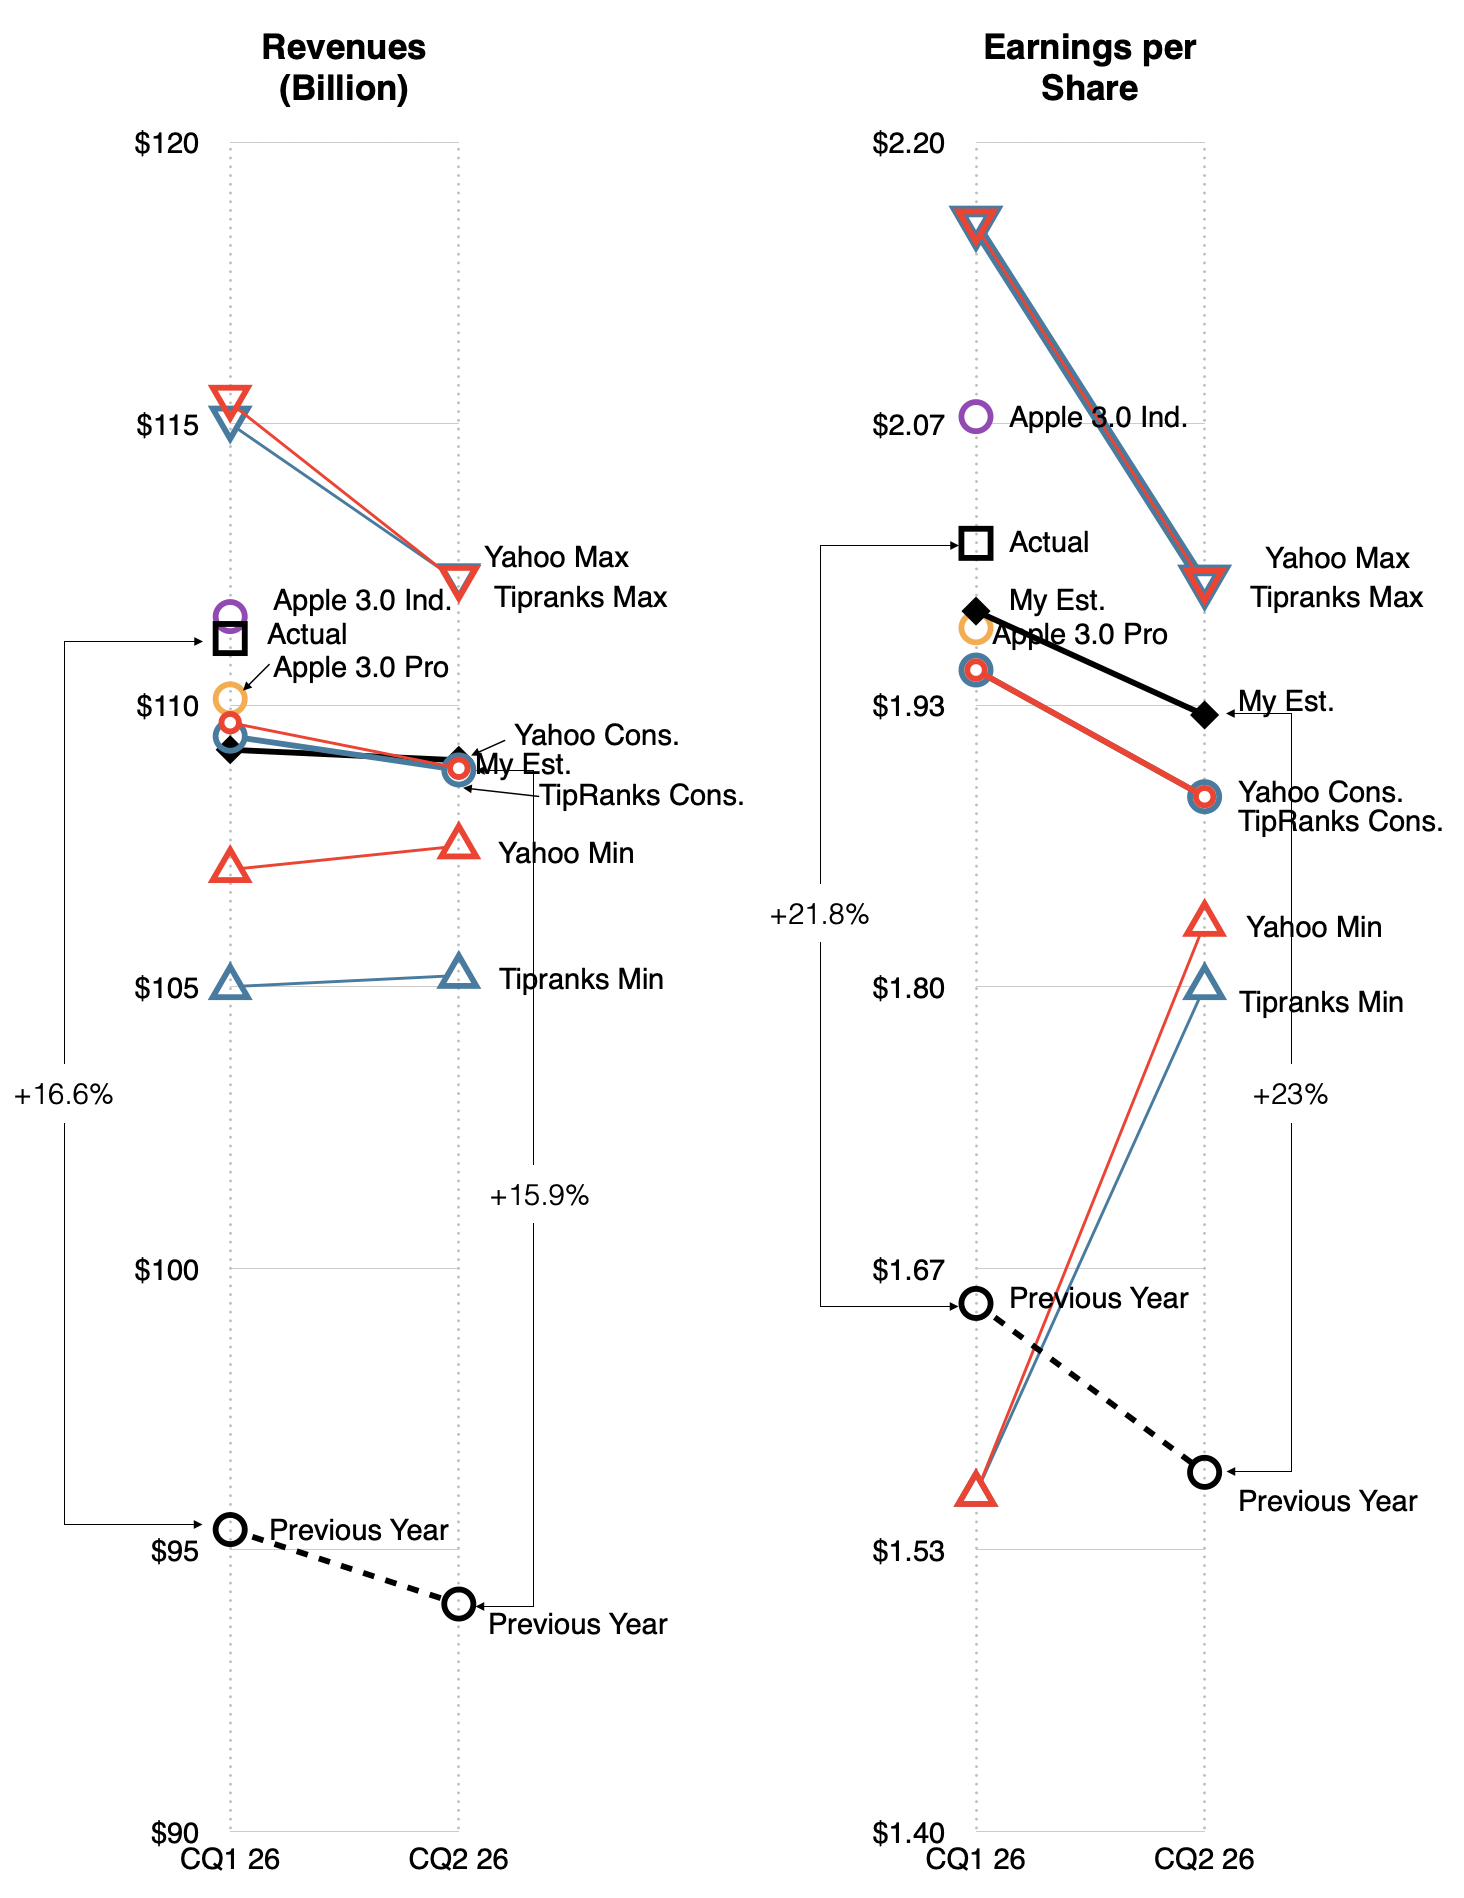
The graph below is a summary of estimates for revenues and EPS for the June quarter along with the estimates and actual results from the most recent quarter (March).
Final results will be available half an hour after markets close on July 30th. Office Hours will be held the following day.
I only note that both Yahoo and Tipranks narrowed the EPS range between min. and max significantly during the last quarter with a less prominent reduction in the Max of revenues. I don't have a hypothesis on why this might be. The data from Apple 3.0 (Pro and Independent) will be added as it becomes available.
Yesterday, Tesla reported its second quarter earnings and there were few surprises. The company's automotive business is as structurally unsound as ever. Despite automotive deliveries and revenues growing at 25% (from a very weak Y/Y comp.), Tesla only saw a 1.4% operating margin in Q2. The gross margin fell slightly but the operating income fell by 57%. Excluding regulatory credit sales of $146 million (which should disappear soon), the operating margin was only 0.7%. The days of automotive profit, never mind extraordinary profit, are gone.
Cash flow went negative at -$1.1 billion. GAAP net profit of $1.1 billion was down 6% YoY, only because of a $1 billion unrealized gain in SpaceX shares, which, if excluded, would reduce net profit to $0.35 billion, or 70% lower than Q2 2025. Shares fell 14.5% the following day and the P/E ratio fell from 350 to 335.
Tesla Bulls would argue that these metrics are not relevant because the company is in the middle of a pivot from products to services. The product business will gain its margins from subscriptions (FSD) and ride sharing (Robotaxi). Current manufacturing overcapacity (mainly due to failed Cybertruck) will be reallocated to robotic taxis and humanoid robots. Until these arrive, the metrics should be ignored. This much is already reflected in the share price as its P/E ratio is beyond reason.
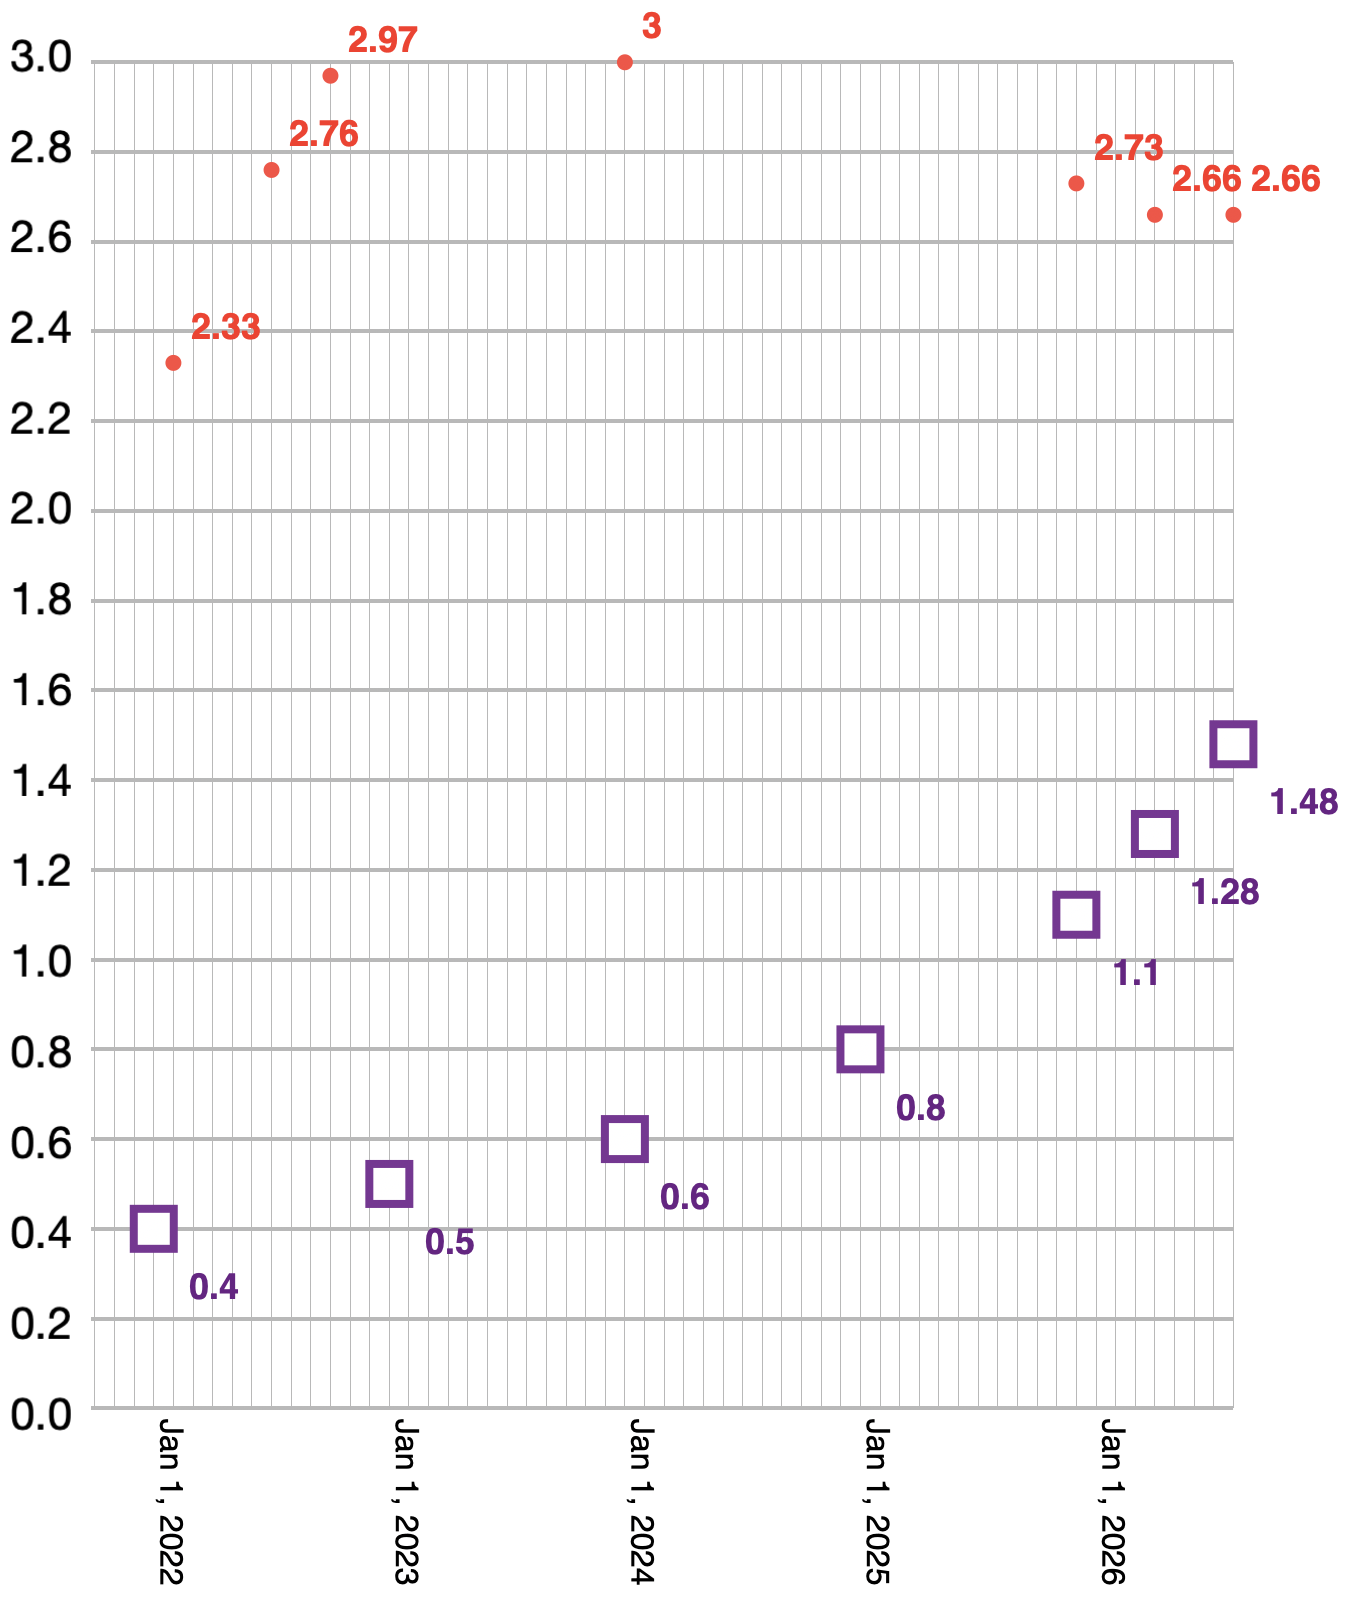
But are there other metrics we should look at besides selling cars that back this up? Robotaxi and Optimus humanoids are still not businesses contributing revenues so we can't yet measure their take-up rate. FSD subscriptions, on the other hand, are being sold and there is excitement regarding the latest numbers. At the end of last year there were 1.1 million FSD subscribers and now, six months later, the total reported was 1.48 million. The history is shown in the graph below.
It shows a nice acceleration for FSD, shown in purple squares.
But not all accelerations continue forever. As a caution, I added a second data set shown in red. It represents the number of subscribers to Peloton. Peloton was quite a darling of the tech/investor community six years ago. After going public in 2019 at around $25/share the company climbed to $150/share by end of 2020 aided, no doubt, by the pandemic. It was seen as a major "disruption" in fitness. Today the shares are $6.
The problem with Peloton was that it could not break out of a small number of relatively wealthy users and its product was disrupted by much cheaper and easier to adopt wearables which could be hired for similarly motivating exercise.
By 2024, after following the classic accelerating curve, the Peloton subscriber base peaked at 3 million. That's about twice the FSD base today. It's not impossible to imagine Tesla reaching 3 million subs by 2028, seven years after launching as a monthly software subscription. Peloton itself took a decade to peak subs. But how high can it go?
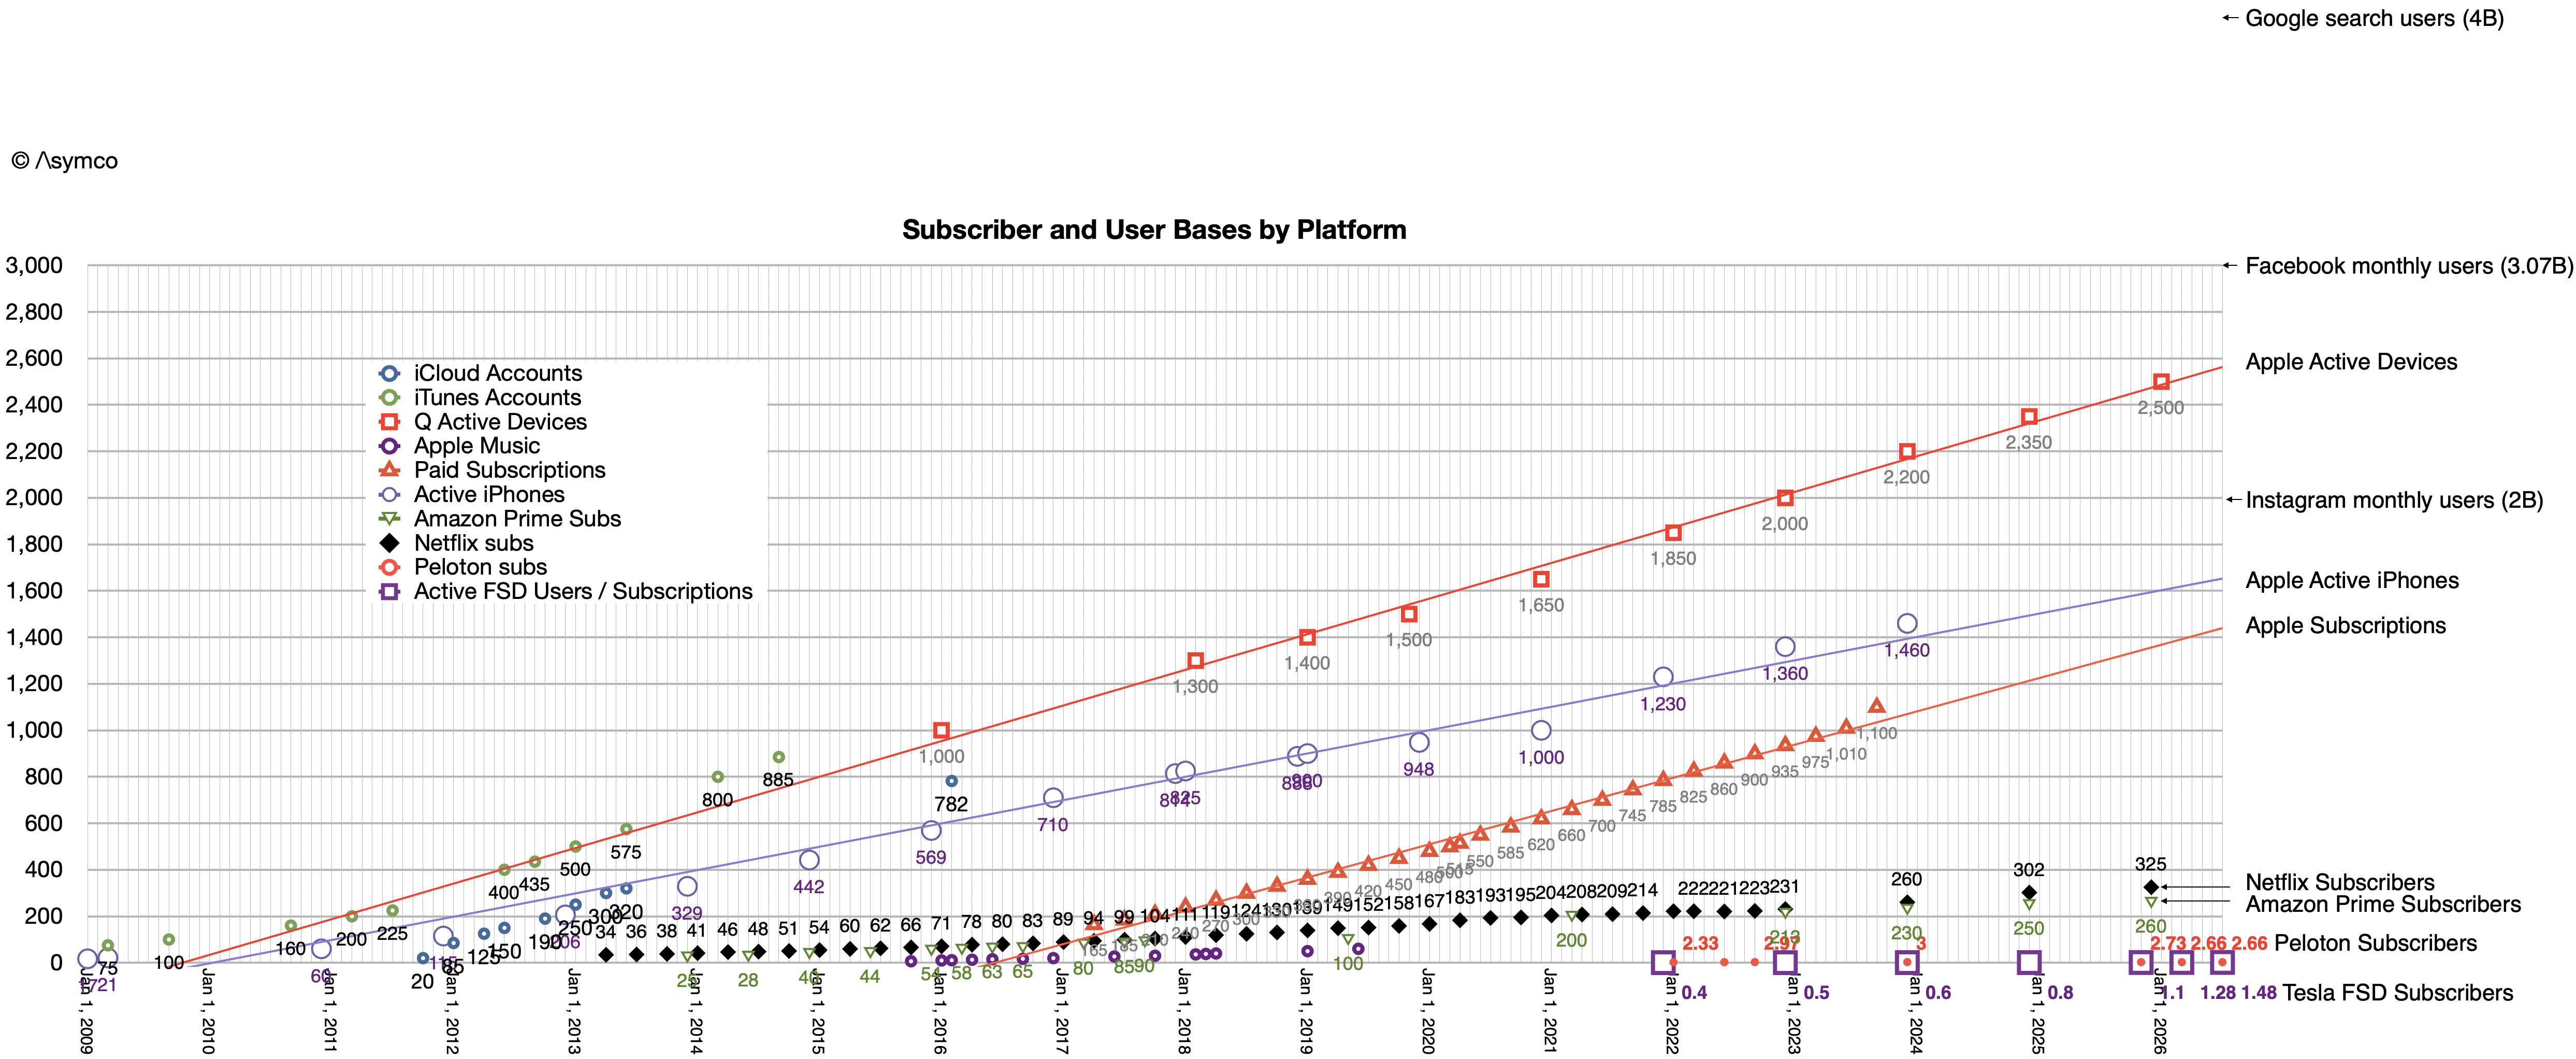
If I add a few other user bases and their histories to the graph above we can see what scale can be achieved overall. (Click image for higher resolution.)
The highest user number is arguably Google with 4 billion. Second is Facebook with 3 billion, though as part of Meta's overall 3.4 billion users of which 2 billion are Instagram users. These are not paying customers (rather, they are being sold) so the largest paying community of users are those from Apple with 2.5 billion active devices (users may be about 1.4 billion).
Active Apple subscriptions are 1.4 to 1.5 billion. PC users are about the same level.
Next would be Netflix with 325 million subscribers as of end of 2025 and Amazon with about 260 million subscribers. Note that Netflix and Amazon are growing but not accelerating suggesting they are nearing saturation.
Compared to these Peloton and Tesla are minuscule, indeed invisible on the graph. As a result the numbers are way too small to support what would be called an ecosystem--the attraction of third parties to develop on a platform. But why couldn't Tesla reach billion user numbers with FSD? The answer is structural.
The reasons are that neither exercise equipment nor automobility create consolidated, uniform, global, iterative, rapidly evolving opportunities. The products can't be obsoleted quickly enough. They are too bulky and expensive to be sacrificed for better versions. Cars are only owned by 1.2 billion people but the industry is very fragmented and becoming more so. There are hundreds of brands from dozens of auto groups with protected home markets and restrictions on distribution. Each brand has to field dozens of models which fragments the platform even more so that each product can only gain single digit million install base at best. That product has to stay in use for decades, often with to software upgrade path beyond the first few years. As a result even a prominent brand such as BMW can only create an overall customer base of 50 million users.
Tesla has barely 10 million users today1 and the total is not growing more than 2 million/yr. FSD is not even available outside the US, which is about half the install base23. Given this, the 3 million subs by 2028 might be a stretch.
Thus there isn't a critical mass in the "owned" car market that creates network effects for services and ecosystems.
What about robotic cars?
That market is yet to be measured. We can start with the taxi market and that's not very encouraging. The total professional taxi fleet globally is about 18 million, constrained by regulations. In addition, there are about 15 million active ride-hailing drivers world-wide4. They largely unconstrained by regulation but limited by economic value. If robot taxis were to replace this market5, it would not be huge enough to move toward a billion users. If it tries to replace owned cars the business has to contend with the fact that ownership is not just the utility of transport6. It's a market for smiles not miles.
And then there is the rate of change. Nothing happens quickly in transportation--the bigger the vehicle, the slower it evolves. I should also note that Tesla is 23 years old, about half the age of Apple. Ten million customers in 23 years isn't enough.
But the sclerotic automobility world is not alone .Many other industries suffer from sclerosis: housing, aviation, medical equipment, education, peacetime defense, etc. They cannot be consolidated, are not uniform, are not global, are not iterative and are not evolving rapidly enough to cope with silicon and software evolution cycles. Compare any of them with the smartphone or AI industry.
Indeed the idea of growing billion-customer bases within a decade or two is extremely rare and the exception rather than the rule. I'm guessing the challenge of adhering a service business onto the structural mess that is automobility is the primary reason Apple abandoned the idea of making a car.
Tesla cumulative global deliveries reached 9.7 million as of July 2026. Total in use must exclude scrapped cars due to accidents or end of life.
The installed base of Tesla cars in the United States is estimated to be roughly 3 to 3.5 million vehicles, derived from cumulative historical domestic sales.
Tesla maintains roughly 41% to 48% of the total active U.S. electric vehicle market share, by far its largest market by share. Europe and China are at 8% or less market share. Share in emerging markets is negligible.
Excluding buses and trains, delivery and other professional driving. The total professional driver population in the US is 5 million and world-wide, over 100 million professional drivers are employed. By overall population the US is 4% of the world.
After its first year in operations, Tesla's unsupervised robotaxi fleet has reportedly shrunk to roughly 30 vehicles, including Austin, Houston and Dallas. The Waymo fleet, having launched public commercial driverless operations in October 2020 has approximately 3,871 vehicles in active service, operating across 10 U.S. metropolitan areas. Waymo, after six years in operations, is aiming to deliver 0.0014% of an estimated 70 billion miles driven in the US each week. If it increases its operating rate by 300,000% it will reach 1% of global driven miles. Approximately 206 billion miles are driven in the world each week. This estimate comes from global calculations showing that roughly 1.3 billion vehicles log an estimated 10.7 trillion total miles every year
If it were, the service of public transit would be more popular. As an exercise, contrast that with public aviation, a utility based industry that has 99%+ market share relative to private aviation.
Asymco Bulletin is a digest of all the work we have published for the week ending Jul 26, 2026.
Office Hours
Asymco Office Hours Live Q&A — Friday, July 31 → The next Asymco Office Hours Live Q&A will be on Friday, July 31st at 12pm ET / 9am PT, the day after Apple’s fiscal Q3 2026 earnings call on Thursday. Horace will review the results and their implications, and we will take Q&A from our live audience.
Asymco One subscribers are guaranteed seats, can bring a guest, and will have access to the live recording.
Tim Long of Barclays has a Sell rating on Apple while the shares sit at an all-time high. Barclays has been at hold or sell since 2014, when the split-adjusted price target was $20. Since then the targets have risen 1,165% while the rating has fallen, with a 30% average error on one-year targets. The only way to square rising targets with a falling rating is to argue that all your previous ratings should be ignored. How long does an analyst insist on being ignored? →
Apple reports on July 30th and we will hold Office Hours the next day. My estimate is 15.9% revenue growth with iPhone up 21%, gross margin at 48.5% and EPS of $1.93, up 23%. Memory pricing is the big worry, but June and July inventory was provisioned before the increases, so I am not worried about a margin miss this quarter. The squeeze arrives in next quarter’s guidance, where 45% would not surprise. →
Rumors point to a split iPhone launch across two quarters, a folding model priced above the Pro Max, and the first break in the pricing cadence charted in the stairway to heaven. Any of these leaves management a dilemma: accurate guidance tips their hand, withheld guidance signals a miss. The next few quarters will be different and transitory while the fundamentals get stronger. The reporting will be all over the place and the negatives will overwhelm reason. Don’t be fooled. →
Nota Bene
Omdia: Global smartphone market down 4% in 2Q26 while Apple and Samsung soared → Omdia has the market down 4% in the second quarter while Counterpoint has sales down 11%, and either way Apple hit a record 20% share in its slowest quarter. The steepest drops are in the sub-$400 segment, where memory is now over 60% of the bill of materials. Xiaomi, OPPO and vivo all fell steeply on rising memory prices. In a contracting market with contracting margins, Apple is moving in the opposite direction, and every crisis of the last six years ended with the business emerging stronger. →
Why Huawei and Apple Grew While China’s Smartphone Market Fell Again in Q2 2026 → China shipments fell 4.3%, the fifth straight quarterly decline, while Huawei and Apple each grew about 20%. Both held prices steady as the Android field raised them, and Apple’s early signaling of second-half increases pulled buyers forward into the iPhone 17. The repetition matters less than the discontinuity: pull-forward demand and iPhone price increases collide in the holiday quarter, with the line-up probably split across two launch quarters and China likely targeted with the later one. →
Time to Buy, Time to Sell. → HSBC flipped to Buy with a 41% target hike to $366 while KeyBanc flipped to Underweight with a $250 target on a stock at $333. By my count 28 say Buy and 20 say Hold or Sell. KeyBanc’s own record shows targets tracking results closely while rated Buy, then diverging dramatically once the rating fell. Its latest target implies a 25% drop, set the day before the shares rallied. →
Rumor has it that Apple will split the launch of the latest iPhone models across two quarters. The high-end iPhones will be announced as always, in September, but the base models will be released in the following quarter. I don't know if this is to be believed but there are other factors that might affect the next quarter that are out of the normal.
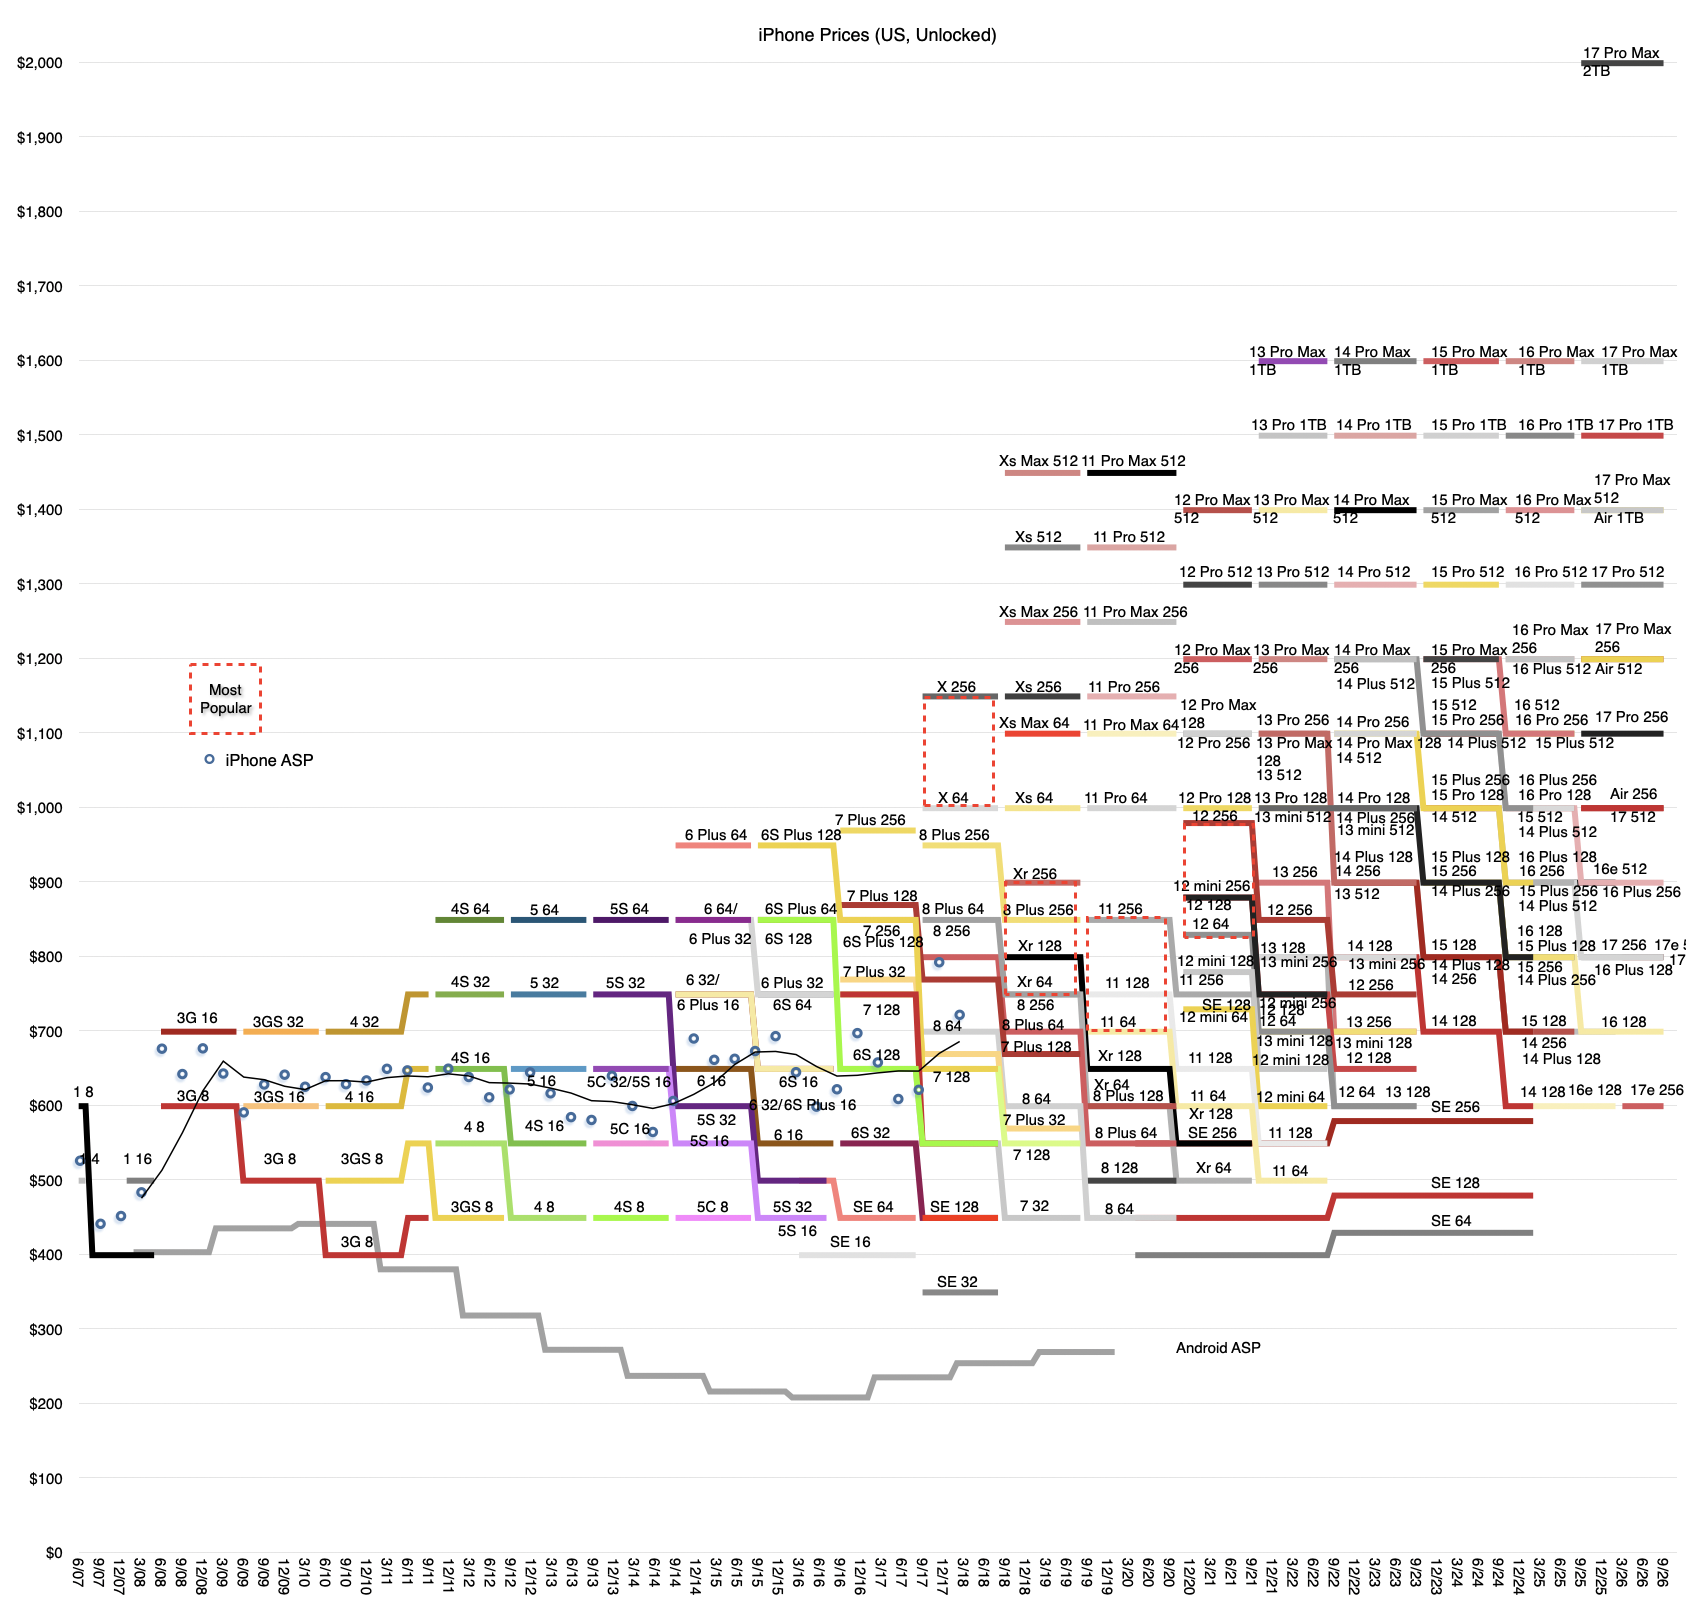
Pricing may change. Memory costs have increased so much that Apple has had to increase prices across all products apart from the iPhone. The iPhone may not be spared any longer and the normal pricing cadence may be disrupted. This cadence has been illustrated over the years as the "stairway to heaven" graph.
There might be a new form factor. Rumors are abundant about a folding iPhone being launched this fall. If true, it will probably be priced above the iPhone Pro Max given the size of the screen, battery and overall mechanical complexity. How well this product will do given the new form and new price is difficult to predict. The supply/demand balance may take some time to optimize.
Normally i don't use rumor information as it's easily corrupted, however in this case the confluence of multiple factors could cause a disturbance in the usual reliability of guidance. Here's why.
If there are new products or even a split launch, the company will not pre-announce this at earnings time. These changes in the portfolio could have a significant effect on growth relative to the previous year but the reason cannot be specified. This leaves a dilemma for providing guidance. If they provide accurate but historically divergent guidance they are tipping their hand on the mix/split/pricing. If they withhold guidance to protect the launch then they might be seen as signaling a miss.
Alternatively they might not provide any guidance since they don't know the exact impact of the new mix and pricing.
Either of these changes will undoubtedly be misinterpreted or falsely attributed to declining demand for the products.
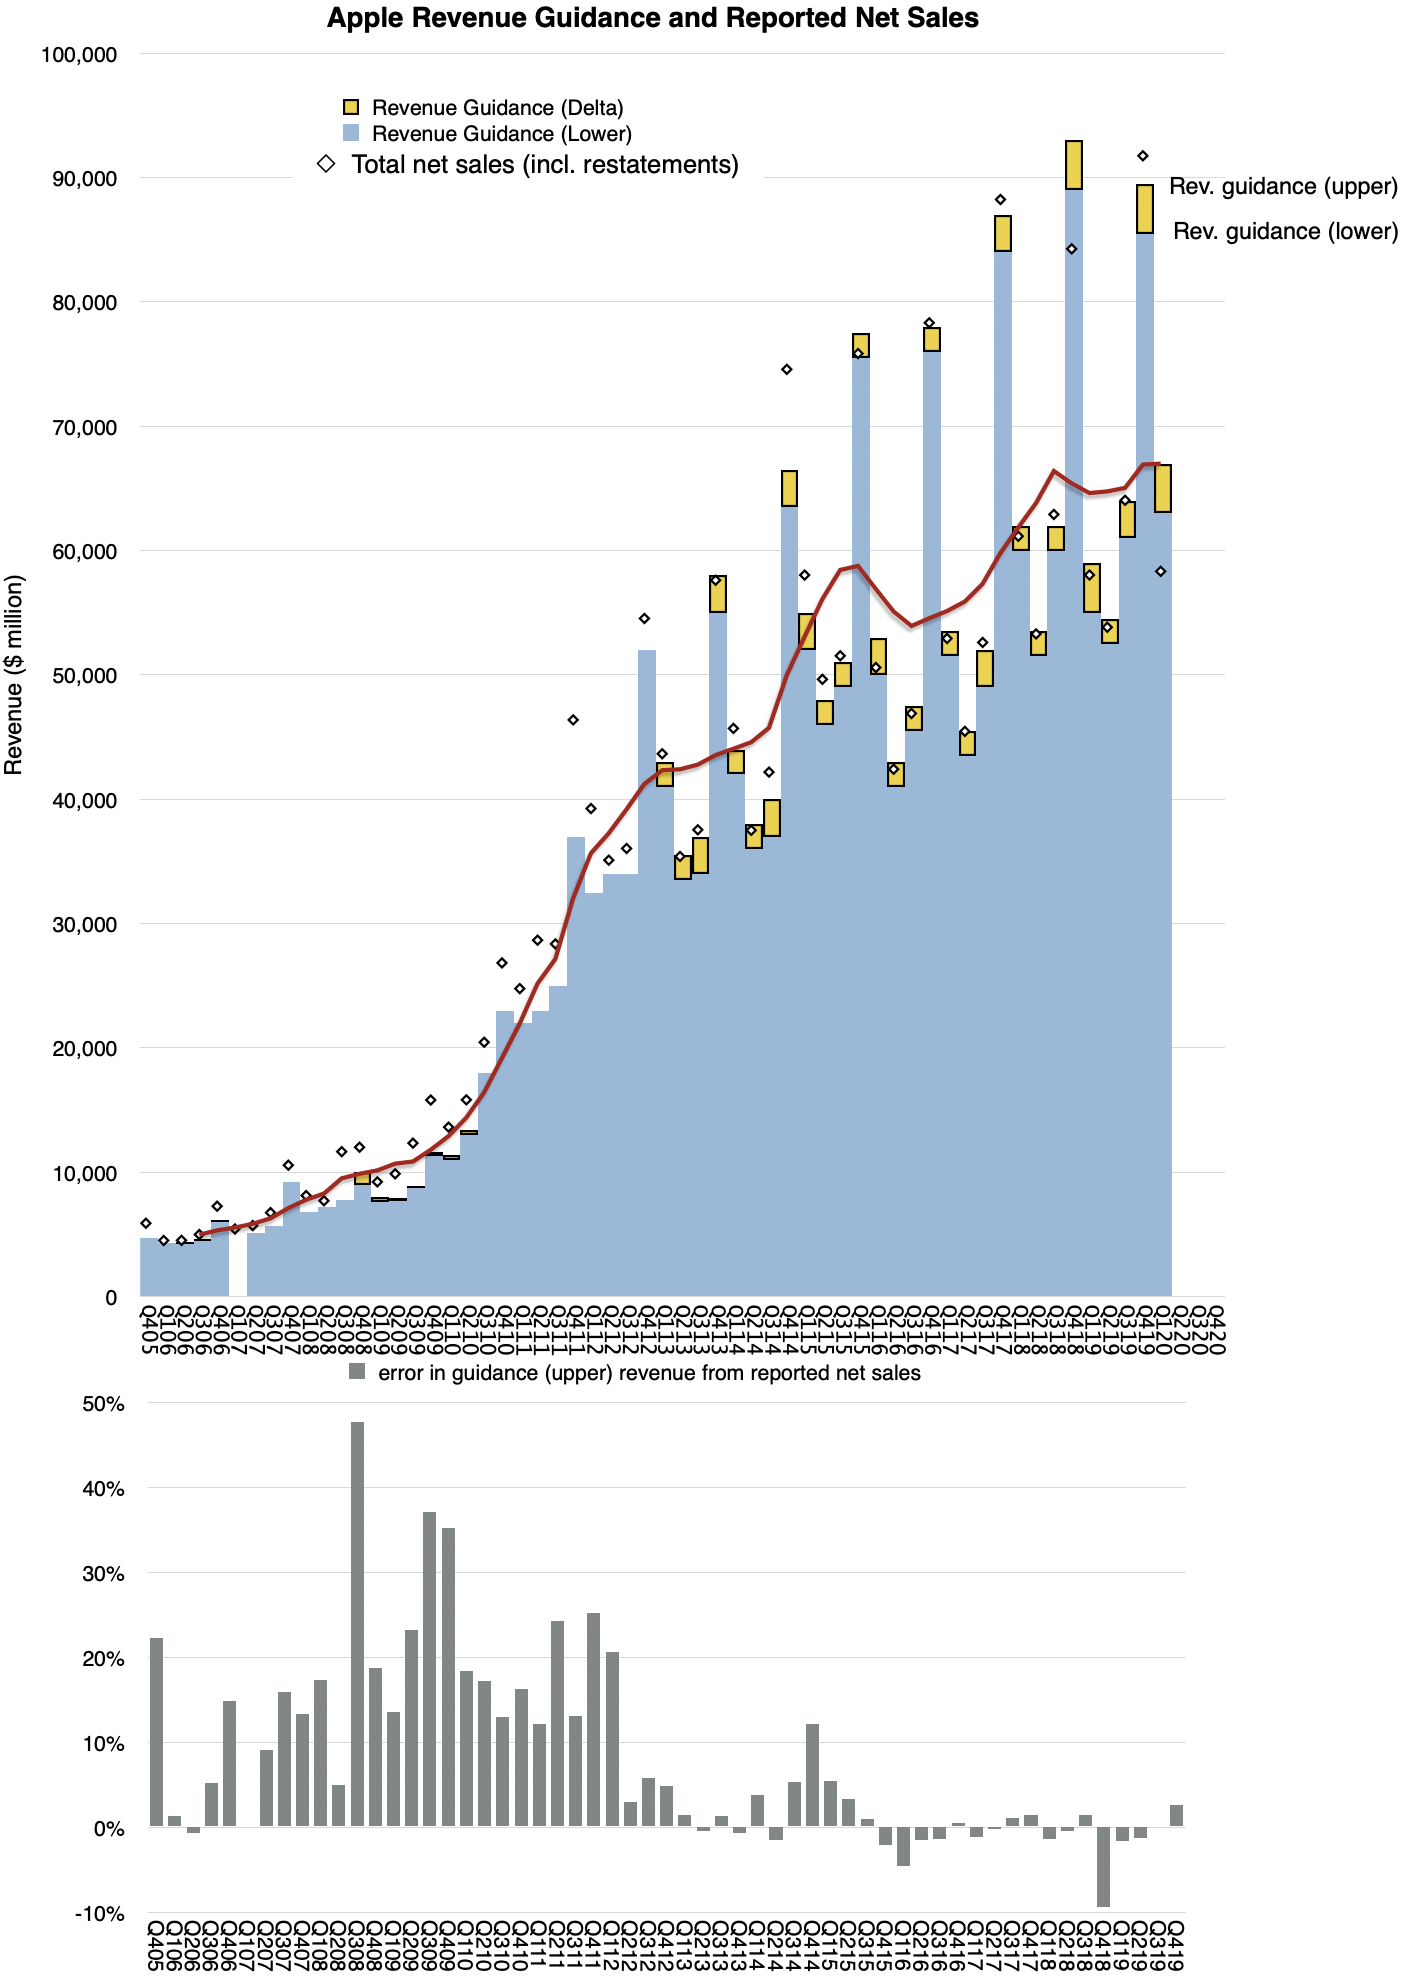
It's also possible that the new CEO will change how it communicates guidance overall. This is not unprecedented as guidance changed a few times in the last twenty years:
During Steve Jobs' time as CEO, guidance was "sandbagged" and results were far higher than predicted. (See graphs below)
Guidance on earnings was withdrawn altogether during Covid and replaced with revenue growth range, margin and operating expenses guidance (leaving the EPS as a calculation requiring a guess of the buyback rate).
Unit sales of products (and hence average selling prices) were also excluded from reporting as of 2018.
Overall, the next few quarters will be different and transitory. Products are changing, costs are changing and management is changing. However, the fundamentals are likely getting stronger. Competition will be weakened, products will be better positioned, new customers will be attracted. The reporting on this topic will be all over the place and if history is any guide, the negatives will overwhelm reason.
As we move ahead into the June quarter, I'd like to review our outlook, […]. Importantly, the color we're providing assumes that global tariff rates, policies, and their application remain in effect as of this call [and that] the global macroeconomic outlook does not worsen from today.
We expect our June quarter total company revenue to grow by 14%-17% year-over-year, which comprehends our best view of constrained supply. On iPad, keep in mind, we face a difficult compare driven by the launch of the A16-powered iPad in the prior year.
We expect services revenue to grow at a year-over-year rate similar to what we reported in the March quarter after removing the favorable year-over-year impact from foreign exchange tailwinds. Keep in mind, during the March quarter, FX was a 2.5 percentage point tailwind to the total company growth rate, and for services, that impact was slightly more favorable.
We expect gross margin to be between 47.5% and 48.5%. We expect operating expenses to be between $18.8 billion and $19.1 billion. We expect OI&E to be around $250 million, excluding any potential impact from the mark-to-market of minority investments, and our tax rate to be around 17%. - Kevan Parekh, CFO
Apple will report results on July 30th. We will conduct Office Hours to discuss them the next day. In anticipation, here are my estimates:
The revenue guidance of 14% to 17% follows a 16.6% increase in the previous quarter. My estimate is growth of 15.9% consisting of the following segments:
iPhone +21%
Mac +15%
iPad -3%
Services +16%
Wearables +4%
My gross margin estimate is 48.5% based on the following segments:
iPhone 38.2%
Mac 31%
iPad 26%
Services 77%
Wearables 41.8%
My estimate for operating expenses is the maximum of the range ($19.1 billion.) OI&E is set at the same level as guidance ($250 million) and the tax rate also set at the estimated 17%.
I expect the number of outstanding shares to decrease by 74 million to 14.625 billion. This is a reduction in the rate of re-purchase from the previous quarter's 80 million and the average over the previous 4 quarters of 83 million. This is due to higher share pricing.
As a result of these estimates, the fully diluted Earnings Per Share should be $1.93, a 23% increase from the prior year. Trailing 12 months' EPS would thus be $8.63, with a corresponding trailing P/E of 38.6 at the closing price last Friday.
My estimates were made soon after the May conference call quoted above.
Has something happened since to change these estimates?
The biggest concern is the increase in memory pricing which would have a direct impact on margins. Especially on Mac, iPad and Wearables. Less so on the iPhone as that supply is provisioned and priced well in advance.
I suspect that management factored in all the data known one month into the second quarter and that any changes in memory pricing that forced a price increase to be announced in July would not have affected June and July Mac and iPad inventory. For this reason I'm still comfortable with what the company guided for the June quarter. There might even have been some pull-forward of demand across all hardware lines as the channel began anticipating a price increase. Anecdotally, we saw Amazon and other big retailers running summer sales even after the price increases were announced. This implies channel inventory was quite high heading into July.
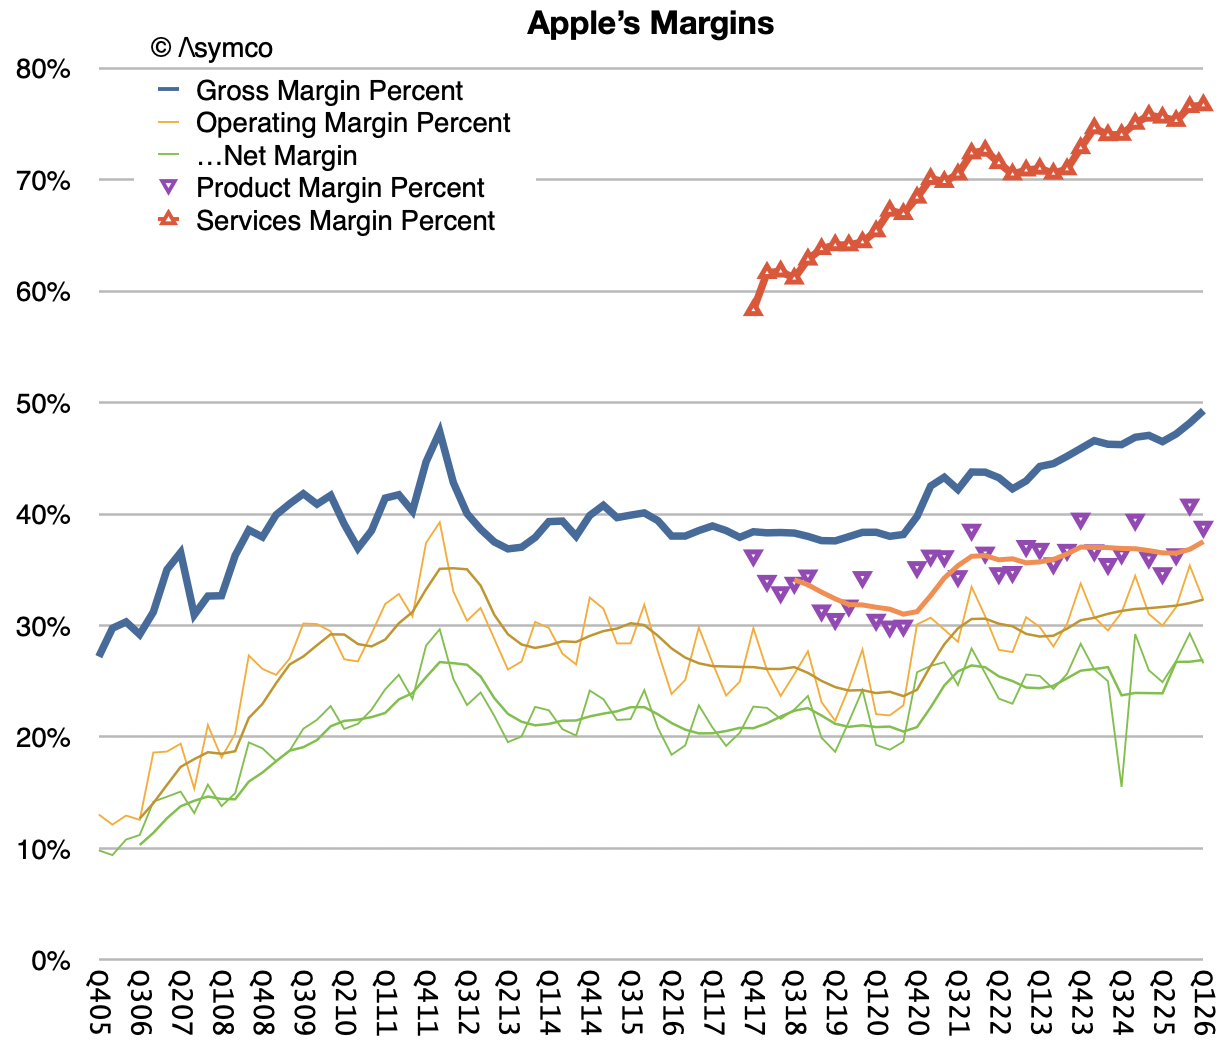
To summarize, I'm not worried that there will be a margin miss this quarter but there might be a significant reduction in margin into the next quarter's guidance. Margins are currently at record levels (48%!).
A reduction to 45% into the next quarter would not be surprising.
The September quarter will be minimally affected by the new iPhone relative to the December quarter but it might signal how iPhone margins will change.
Low 40% range will be a possibility into CQ4 though that depends on what iPhone pricing changes we will see. I still expect approximately a $100 increase across the board on iPhone. $200 is where the worry lies.
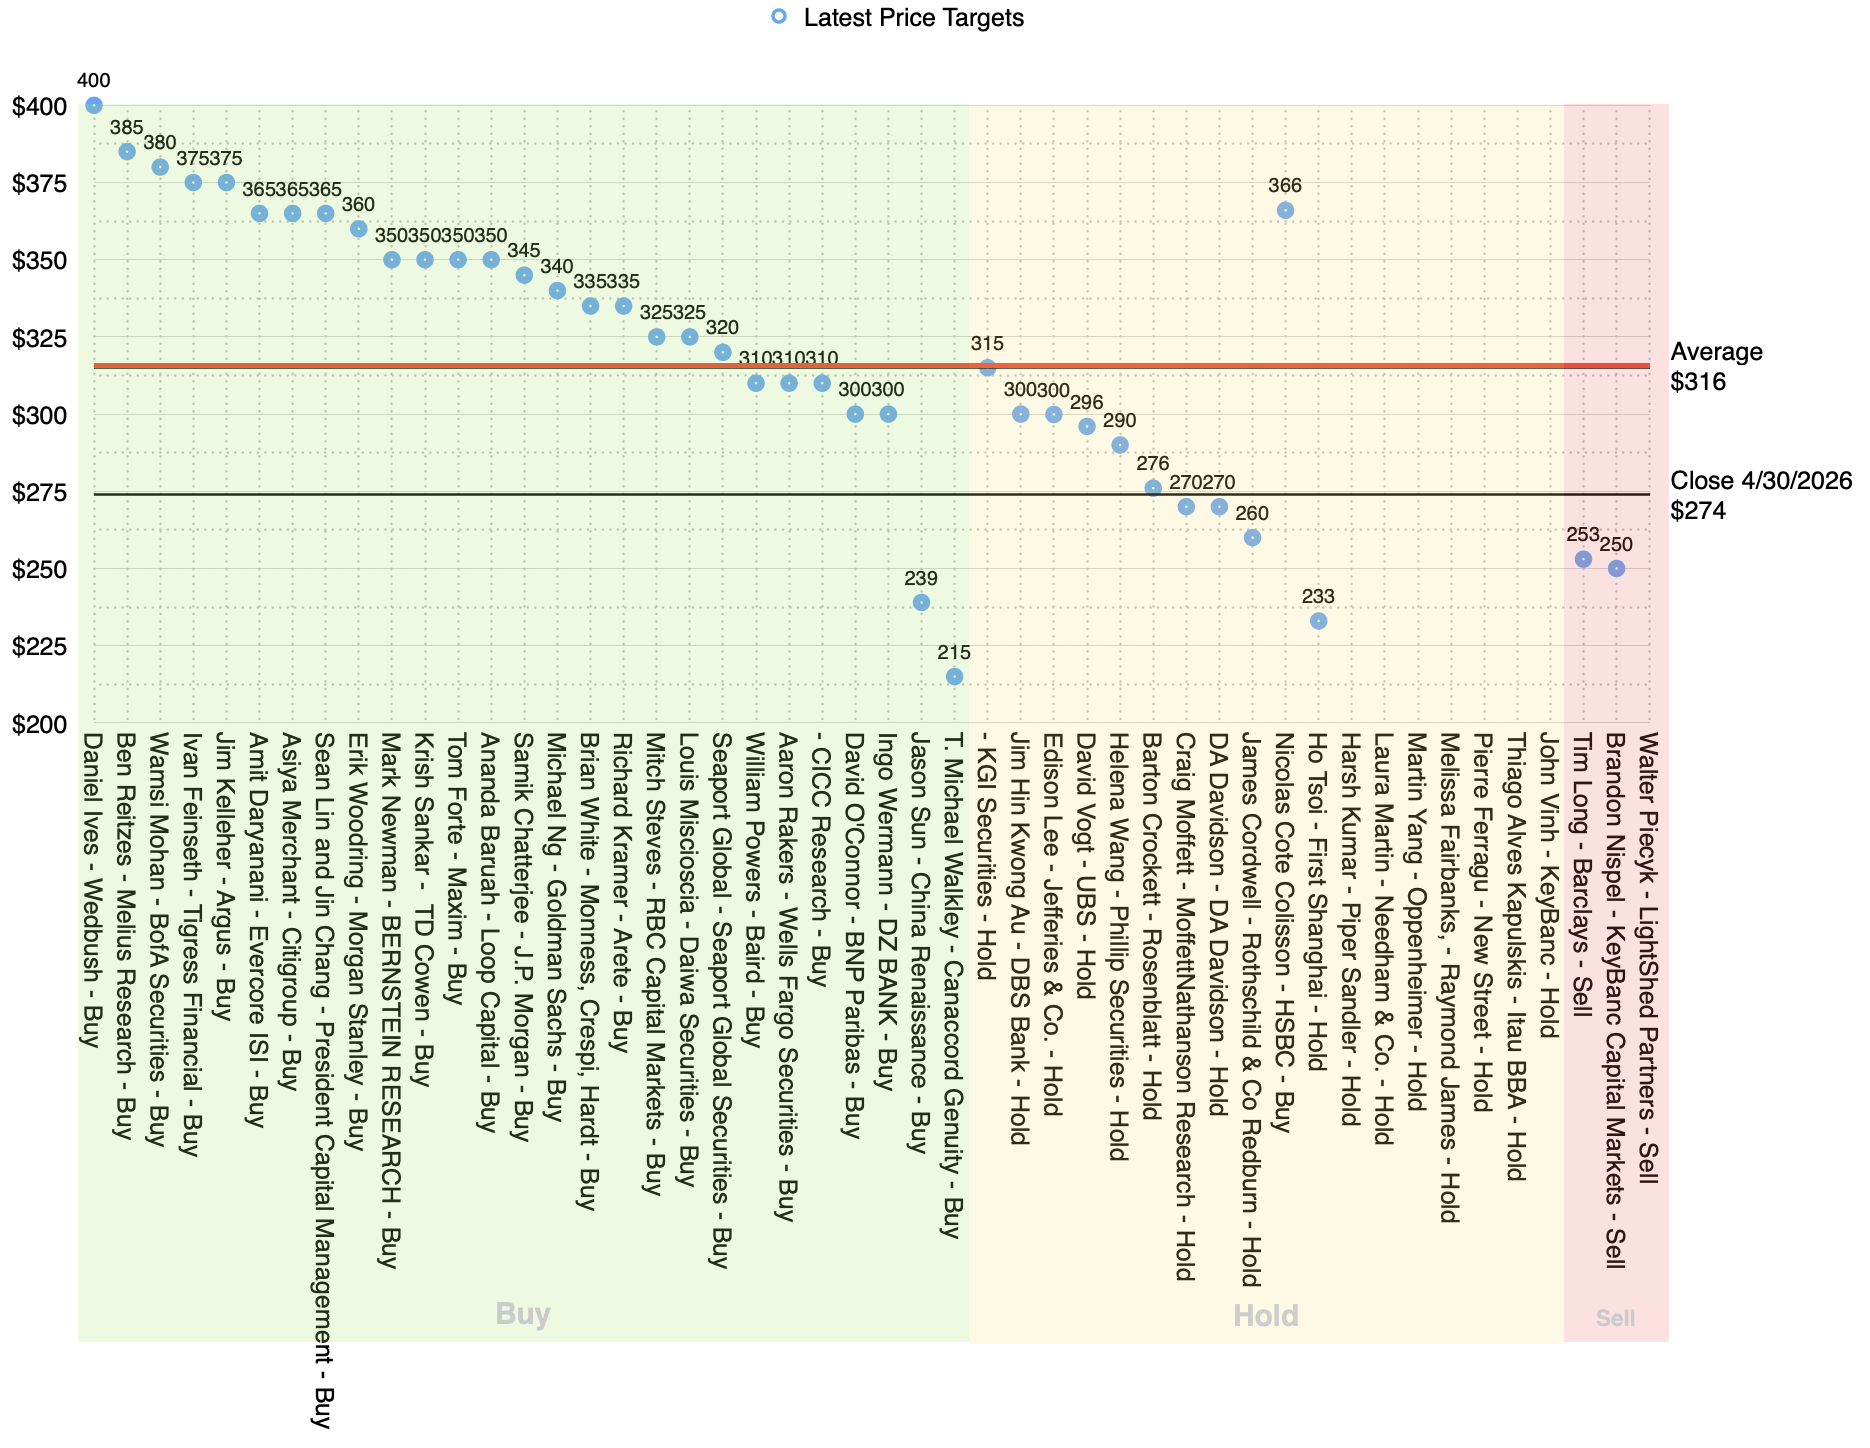
One flipped to Buy, one flipped to Sell. By my count 28 say Buy and 20 say Hold or Sell.
Apple stock inched lower in pre-market trading on Friday even after HSBC analyst Nicolas Cote Colisson upgraded the iPhone maker to Buy from Hold and raised its price target by about 41% to $366 from $260. The firm said Apple is nearing an “operational turning point,” helped by its AI plans and what it called “one of its most innovative product pipelines.”
Colisson said Apple is now better placed to benefit from AI than before. He believes the company can stay away from the “too high capex debate” while using its installed base of 2.5 billion devices to expand Apple Intelligence.
The analyst expects Apple’s revamped AI platform to play a key role. He said the new agentic Siri AI will add visual intelligence and richer interactions. It will also access information across apps to deliver better responses. According to HSBC, the AI upgrade comes at the right time as Apple prepares to launch new devices.
HSBC also highlighted Apple’s strong hardware roadmap. The analyst expects the iPhone 18 Pro and Pro Max later this year, followed by an iPhone Air, a book-style foldable iPhone, a 20th-anniversary iPhone, and smart glasses over the next two years. He believes these products, along with better AI features, could trigger a “strong renewal cycle” among iPhone users.
Reflecting this outlook, HSBC raised its 2027 and 2028 revenue forecasts by 7% to 9%. It also increased its 2027 iPhone sales forecast by 11% to 13% and lifted its 2027 EPS estimate by about 8%.
NB: 41%! From $260 to $366 is quite a jump. Meanwhile, KeyBanc Capital Markets downgraded the iPhone maker to Underweight from Sector Weight…
… slapping a $250 price target on a stock that closed at $317.31 on Monday ($333 at time of writing).
KeyBanc sees iPhone revenue up 23.2% in FY26, ahead of consensus at 19.7%, but growth slowing sharply to 4.9% in FY27 versus Street at 8.3%.
As hardware unit growth cools, the firm also cuts back its Services view, modeling FY27 Services growth decelerating to 7% versus consensus near 12%.
With Apple trading at about 24.5x FY27 EV/EBITDA and roughly 35x forward earnings — more than two standard deviations above the S&P 500 and Nasdaq — KeyBanc argues the multiple no longer fits a maturing, slower‑growth hardware and services story.
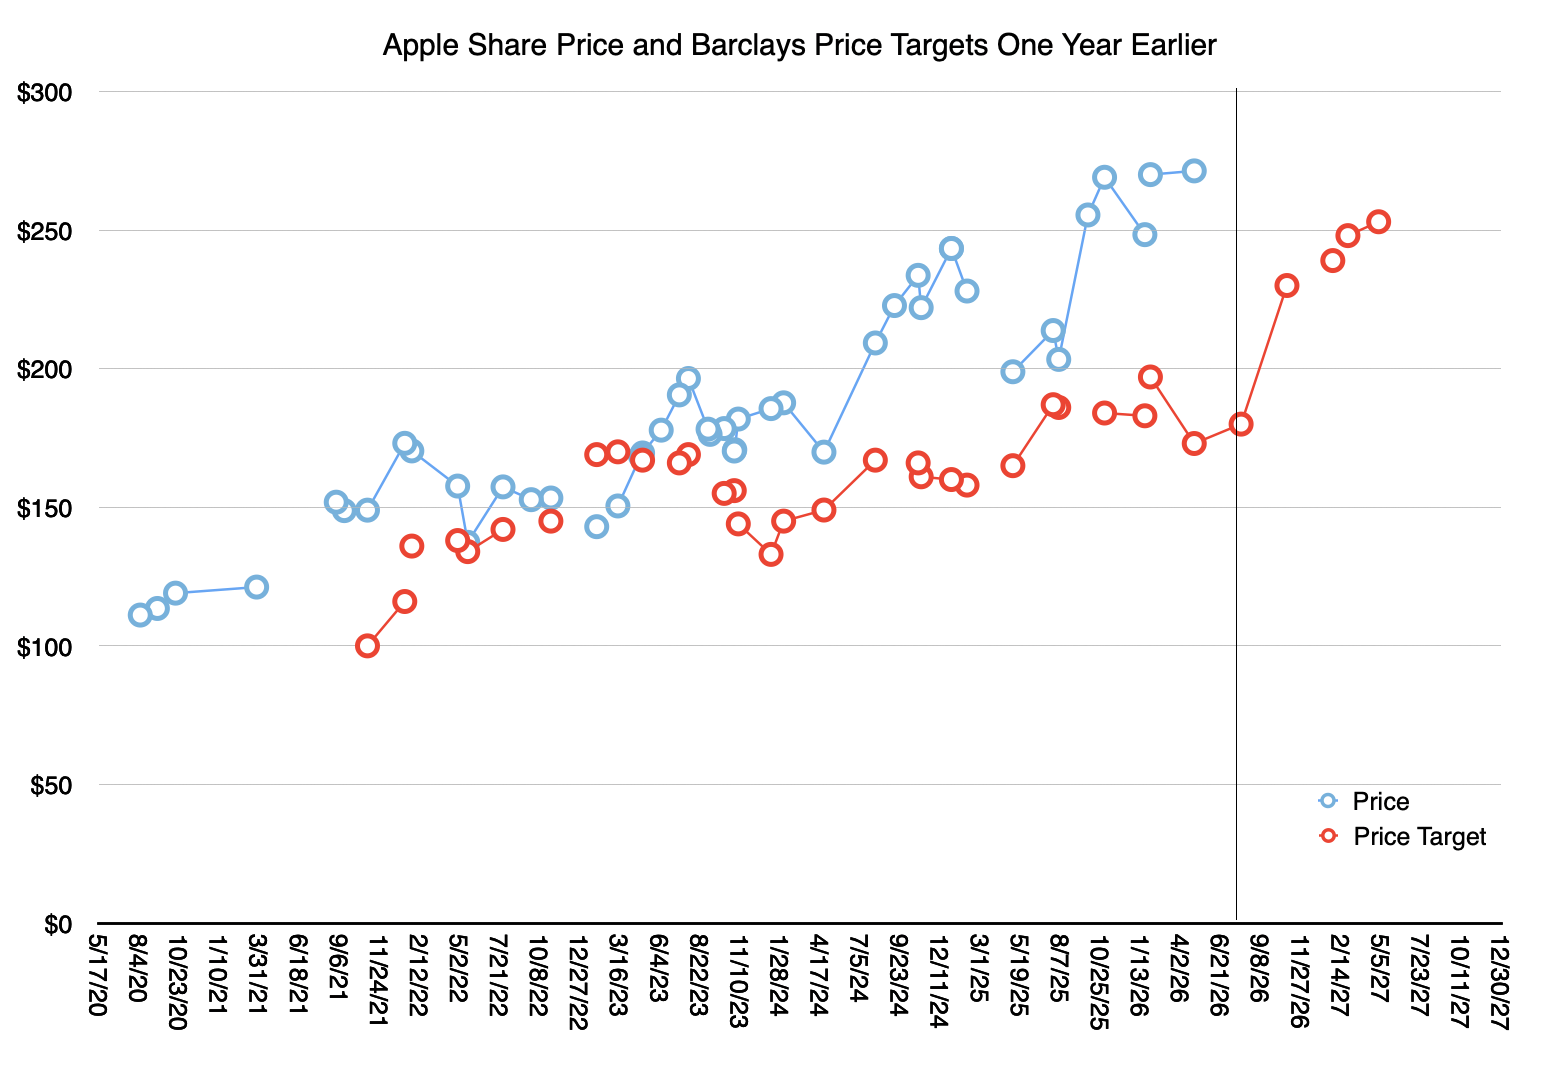
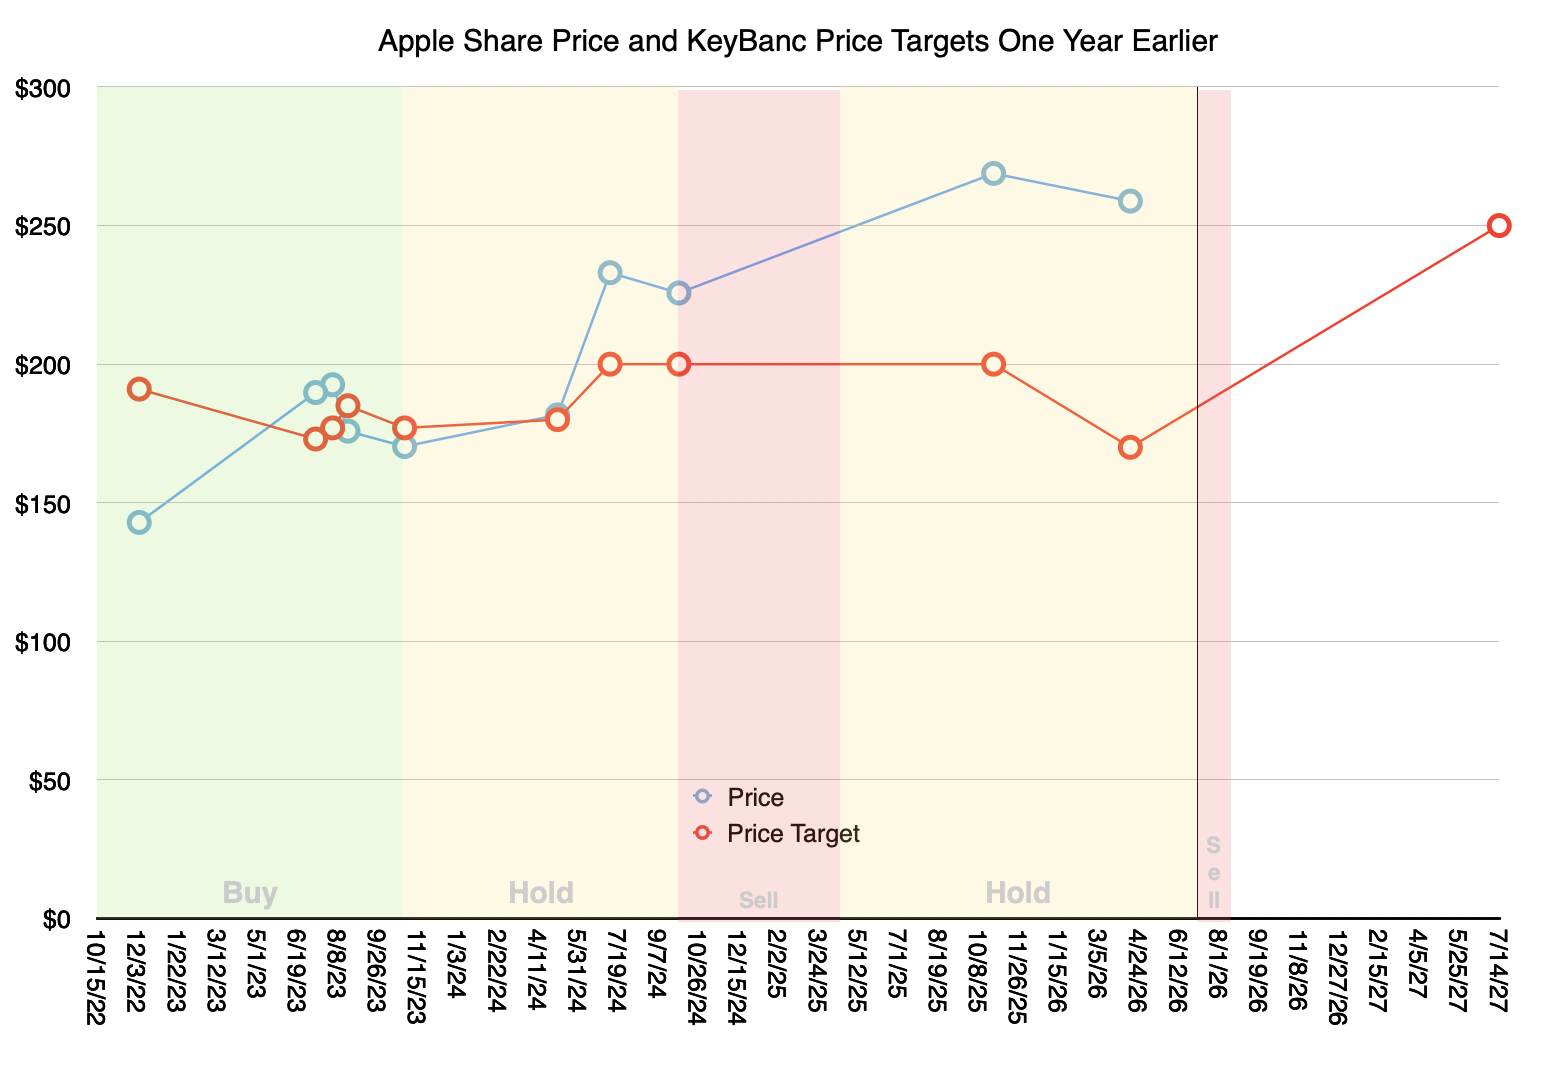
Here is Keybanc's performance on Apple targets. The red line shows the year-ago targets and the blue line shows the performance of the share price. Note that during the time when the rating was "Buy" the targets and results aligned very well, surprisingly so. As the rating switched to Hold and later to Sell, the targets diverged from results dramatically.
That happened already in 2024 and got worse since. The latest target set for $250 happened the day before the share price rallied and it now sits at $333. The implication is that shares will drop $83 or 25%.
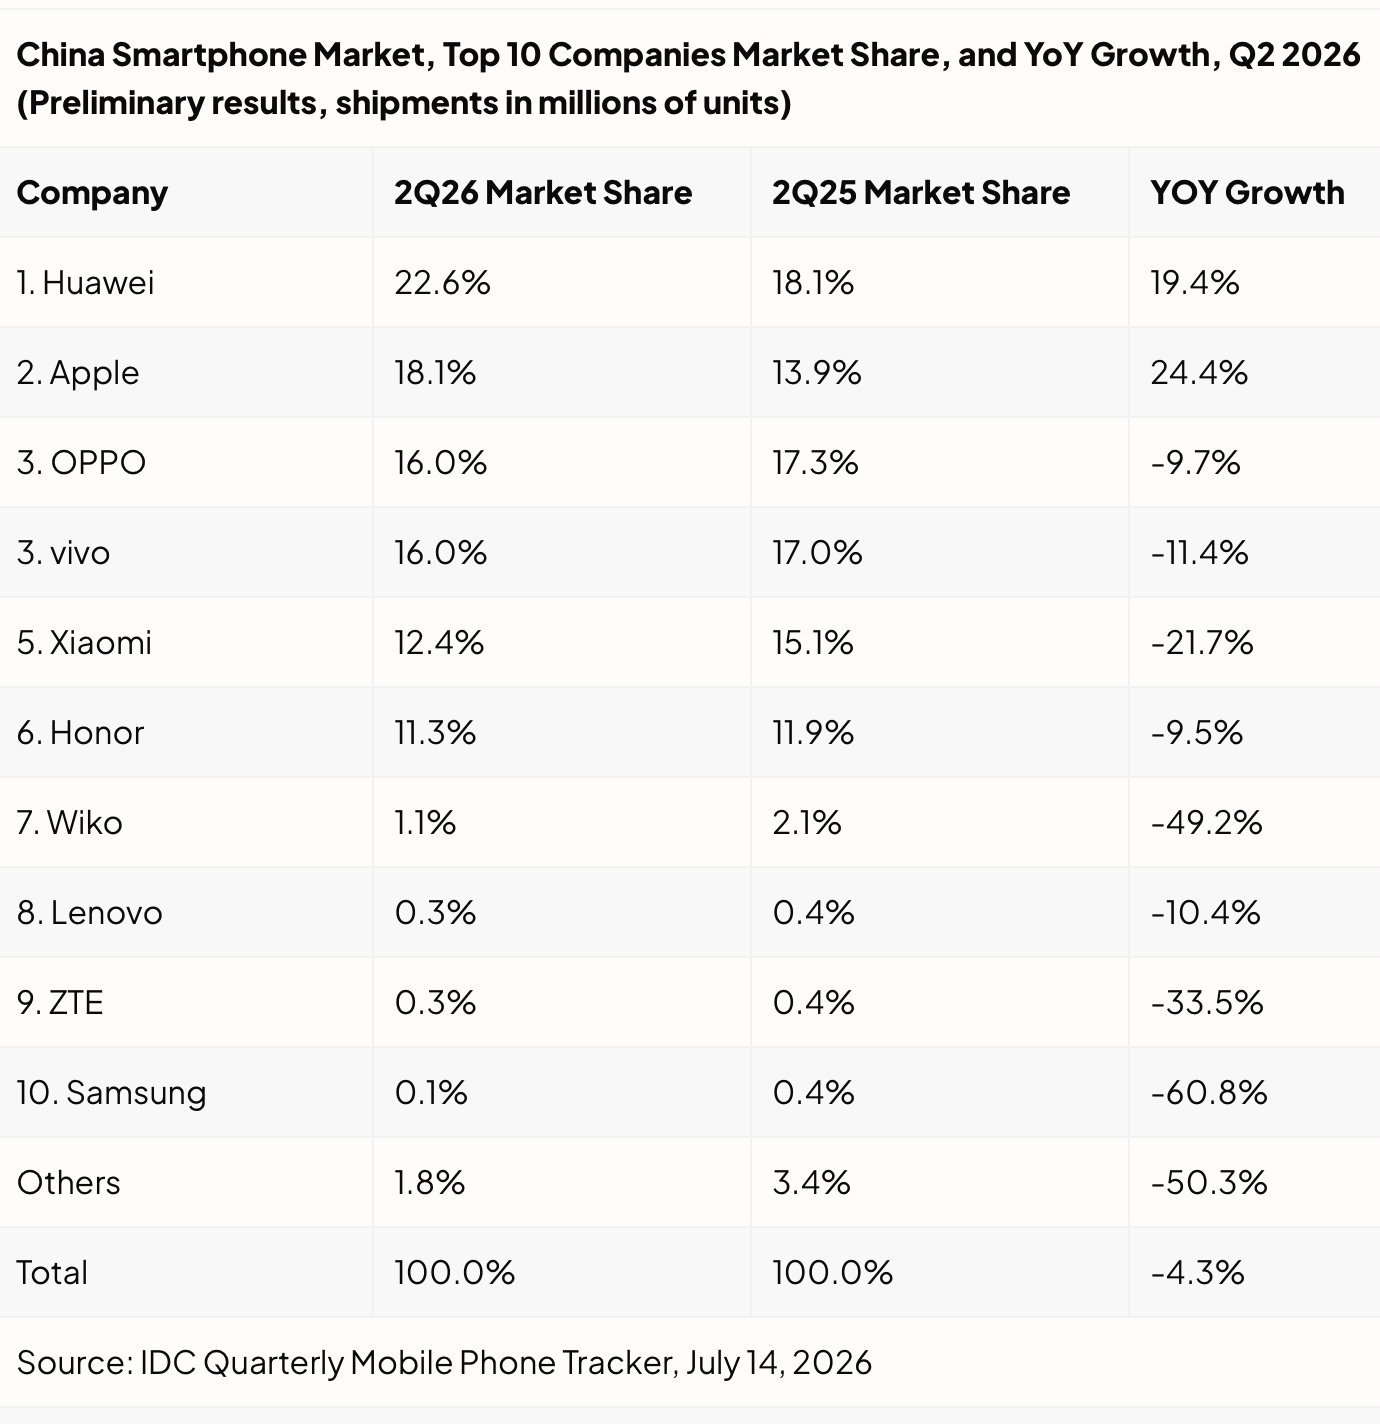
China’s smartphone shipments came in at roughly 66 million units in the second quarter of 2026, down 4.3% year over year and the fifth straight quarter of decline. Rising memory and component costs pushed most Android vendors to raise prices, which cooled upgrade demand. Huawei and Apple were the exceptions, growing close to 20% and 25% respectively.
Huawei and Apple moved in the opposite direction for reasons that were just as concrete. Both held prices steady while the rest of the Android field raised them, and both layered on targeted promotions. Huawei kept widening its lineup to cover more of the market, while Apple’s early signaling of price increases on its second-half products pulled some buyers forward into the iPhone 17 series sooner than they might have bought otherwise. Strong brand pull helped as well.
The top six vendors now hold about 96% of the market, which keeps squeezing smaller and mid-sized brands and pushes concentration higher.
China Smartphone Market at a Glance, Q2 2026
Total shipments: about 66 million units, down 4.3% year over year
Fifth consecutive quarter of year-over-year decline
First-half 2026 shipments: about 134 million units, down 4.2% year over year
Huawei and Apple: each up roughly 20% year over year
“618” festival smartphone sales: down close to 15% year over year
Vendor tiers: Huawei and Apple lead, followed by OPPO and vivo, then Xiaomi and Honor close behind
NB: Other analysts are reporting similar story globally but with Samsung instead of Huawei as growing (apart from Apple.)
The data sounds repetitive but it should be considered in light of the discontinuities we are experiencing in supply chain pricing. The challenge will be pull-forward demand into the next quarter and the price increases on the iPhone line into the holiday quarter. Note well however that the line-up will probably be split into two launch quarters, with China probably being targeted with the later (spring) quarter.
Counterpoint estimating total market sales fell 11%
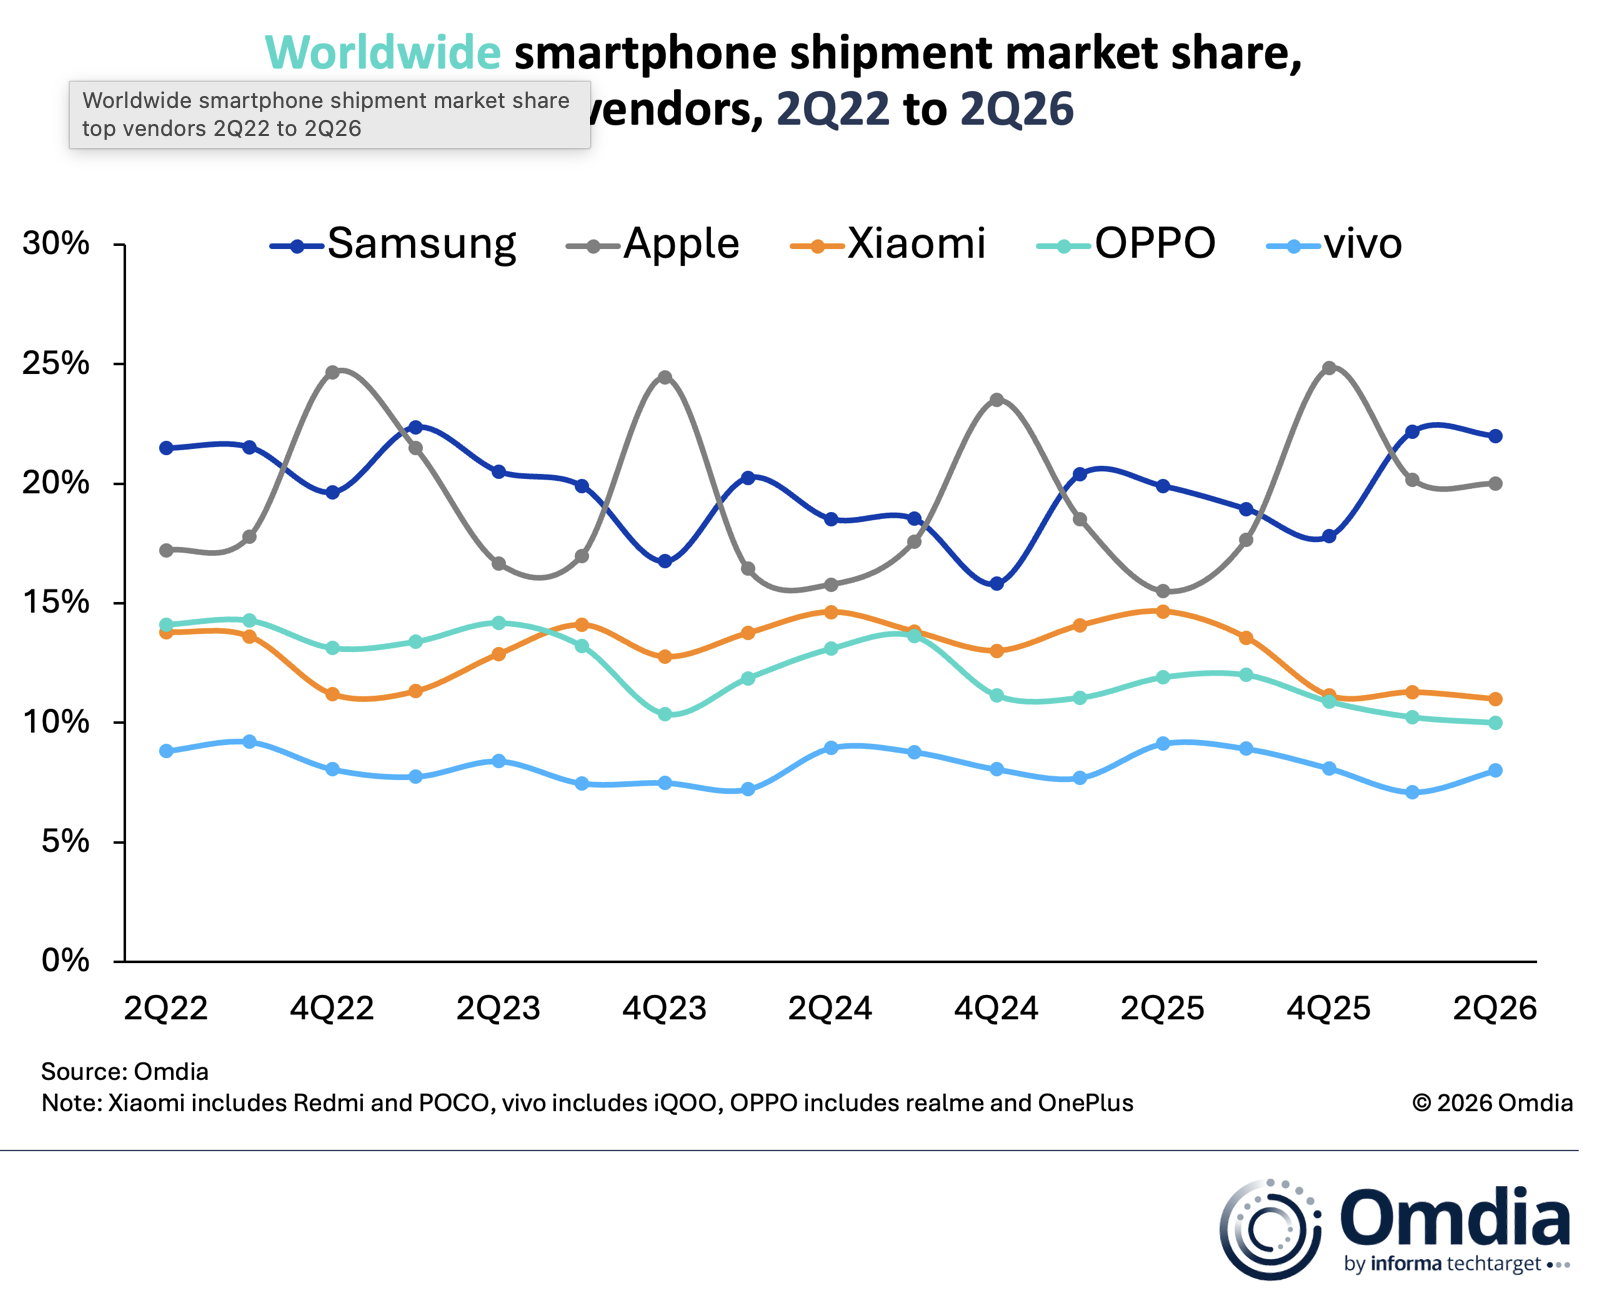
Apple delivered its best second-quarter performance ever, capturing a record-high 20% market share during what traditionally is its slowest quarter of the year. The iPhone 17 series delivered one of the strongest iPhone refresh and upgrade cycles in Apple’s history. Apple also benefited from stable pricing while most competitors were forced to raise their pricing. However, as Apple raised pricing across other products towards the end of 2Q, a key question remains to what extent iPhones might be impacted by similar hikes later this year.
“The steepest volume drops hit the sub-$400 mass market segment, where supply constraints are tightest, profit margins are slimmest, and price sensitivity is highest,” said Runar Bjorhovde, Principal Analyst at Omdia. “To adapt, vendors are shifting their strategies from volume to value by reoptimizing portfolios and adjusting retail pricing. Managing the surging component costs is incredibly complex and unpredictable, with some vendors facing memory costing more than four to five times what they did a year ago. Memory and storage alone now account for more than 60% of the bill-of-material for budget devices and more than 30% for high-end models. Although memory and storage costs are the biggest challenges for vendors, they are far from the only challenge. New semiconductor bottlenecks, such as within foundries, are adding further cost pressures.”
“We anticipate the sharpest volume declines to hit in the upcoming two quarters, where normal seasonal demand peaks – driven by new launches, holidays and shopping festivals — collide with constrained memory chip supply,” added Bjorhovde. “Consequently, vendors are expected to lean further into the higher price segments to capitalize on customers seeking device upgrades in 2026’s sales season. However, while moving upmarket protects margins and revenue, vendors offer fewer options to budget-constrained consumers. Many mass-market buyers will be forced to delay purchases, downgrade expectations, utilize financing, or opt for refurbished devices.”
NB:Counterpoint came out with a report the same day estimating that the smartphone market in the second quarter overall sales fell 11% year-over-year while Apple saw a 3% year-over-year rise in shipments and ended the quarter with 20% of the market. I note that …
… Chinese brands Xiaomi, OPPO, and vivo, all saw steep year-over-year declines, due largely to rising memory prices. Overall, during a highly stressful market condition, where the market is contracting and margins are contracting Apple seems to be moving in the opposite direction.
I recall crises such as AI, Covid, supply chain shortages and China demand collapses in the last 6 years leading to sell-offs and loss of confidence in the company. In all cases, the business emerged stronger.